Tourism statistics - seasonality at regional level
Data extracted in November 2023
Planned article update: November 2024
Highlights
In one out of five EU NUTS 2 regions, more than 40 % of the annual nights are spent in the top 2 months, July and August.
EU capital NUTS 2 regions tend to have lower seasonality in tourism.
This article focuses on the tourist accommodation sector in the European Union (EU) Member States, candidate countries and EFTA countries, and looks at the seasonality of nights spent in accommodation establishments at regional NUTS 2 level.
The article Seasonality in the tourist accommodation sector examines the seasonality at national level, based on short-term data that Eurostat receives monthly from the Member States. This article gives information on seasonality looking deeper at regional NUTS 2 level across the EU, based on a breakdown by month of the regional data that Member States send to Eurostat once per year. This article complements the article Tourism statistics at regional level (most recent update March 2023, with 2021 data). A more comprehensive discussion of accommodation statistics is available in the article Tourism statistics - annual results for the accommodation sector (most recent update October 2023, with 2022 data).
Full article
Introduction
Dealing with seasonality is a key policy issue in tourism. The phenomenon of seasonality affects most destinations in the EU, albeit at different levels, as is elaborated in this article. The concentration of tourism demand in a limited number of months – often July and August – can impact on the environment (e.g. waste production, water and energy use), but also on the labour market conditions and quality of service provided or support for tourism by local communities. Seasonality can also affect the economic performance of the tourism industries, as infrastructure and workforce are used only for part of the year, leading to higher costs and lower profitability.
Policy needs for tourism data are often at regional level, as highlighted in the 2022 Commission report Transition Pathway for Tourism. With the entry into force of Commission Delegated Regulation (EU) 2019/1681, Eurostat receives data on nights spent at tourist accommodation establishments at regional level (NUTS 2) from the Member States, broken down by month. This data enables the analysis of seasonality at a subnational level in this article, complementing and deepening the article on Seasonality in the tourist accommodation sector that focuses on the country level.
Different measures of seasonality can be used, ranging from inequality indices, such as the Gini coefficient or dispersion measures such as the coefficient of variation for twelve-monthly values, to more transparent or clear measures comparing top and bottom observations or indicating the share of the top months in the annual total. While the first group might better capture the skewness of the distribution of the twelve-monthly observations and better absorb the effect of outliers, the latter approach is used in this publication, for reasons of clarity and simplicity of interpretation for non-expert users. Unless mentioned differently, this article looks mainly at the share of the top 2 months in the annual number of nights spent in rented accommodation.
The regions with the highest seasonality are coastal regions
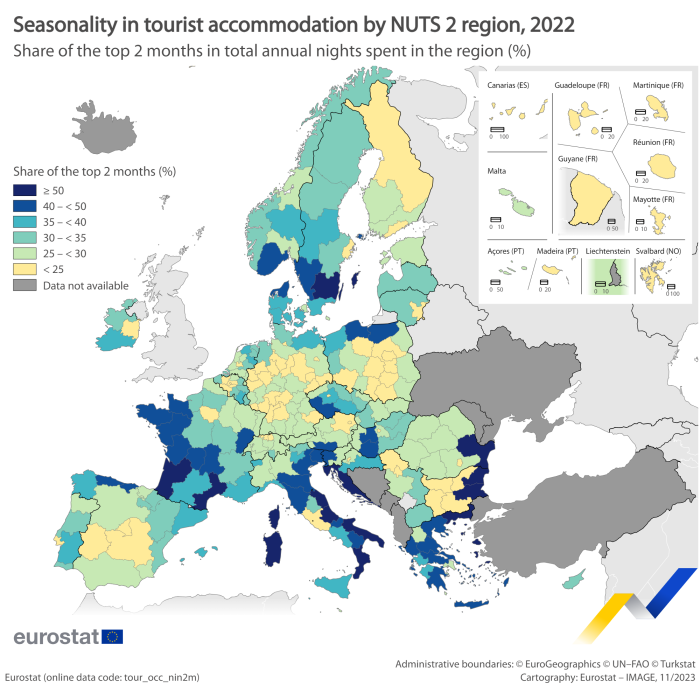
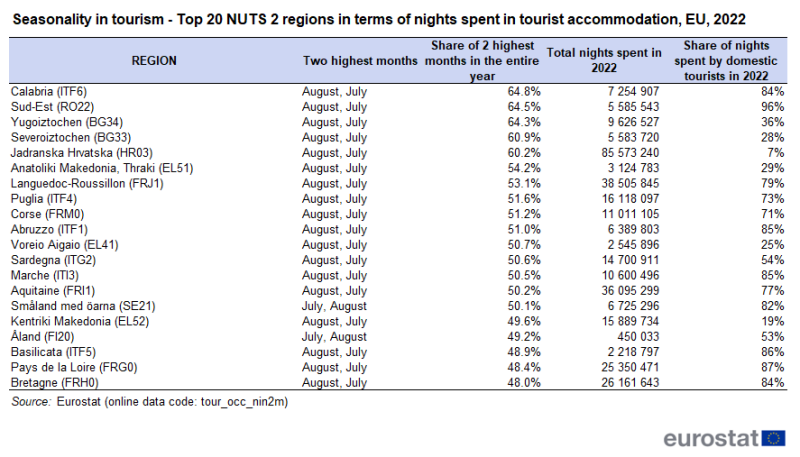
Map 1 and Table 1 show for each EU region the share in the annual total of the top 2 months in terms of nights spent at tourist accommodation establishments. The map reveals a very dispersed pattern across Europe but also within most of the countries, underlining the relevance of analysing seasonal patterns at a subnational level. In 15 regions, located in Bulgaria, Greece, France, Croatia, Italy, Romania and Sweden, more than 5 out of 10 tourism nights are spent during July or August, the top 2 months in these regions. All these regions are coastal regions.
Source: Eurostat (tour_occ_nin2m)
Source: Eurostat (tour_occ_nin2m)
The five regions with the highest seasonality in 2022 include the two main tourism regions in Bulgaria, namely Yugoiztochen (64.3 % of all nights concentrated in July and August) and Severoiztochen (60.9 %), the coastal region of Romania, Sud-Est (64.5 %) and the Croatian region Jadranska Hrvatska (60.2 %), which is also the second EU region in terms of number of nights spent in the entire year. The EU region with the highest level of seasonality is Calabria, in Italy, with 64.8% of all nights concentrated in July and August.
In one out of five regions for which data is available (49 out of 242 regions), more than 40 % of the annual nights are spent in the top 2 months (in all cases it concerns the tandem July and August). With over 710 million annual nights spent, these 49 regions represent 26 % of all nights spent in the EU.
August is the top tourism month in the EU
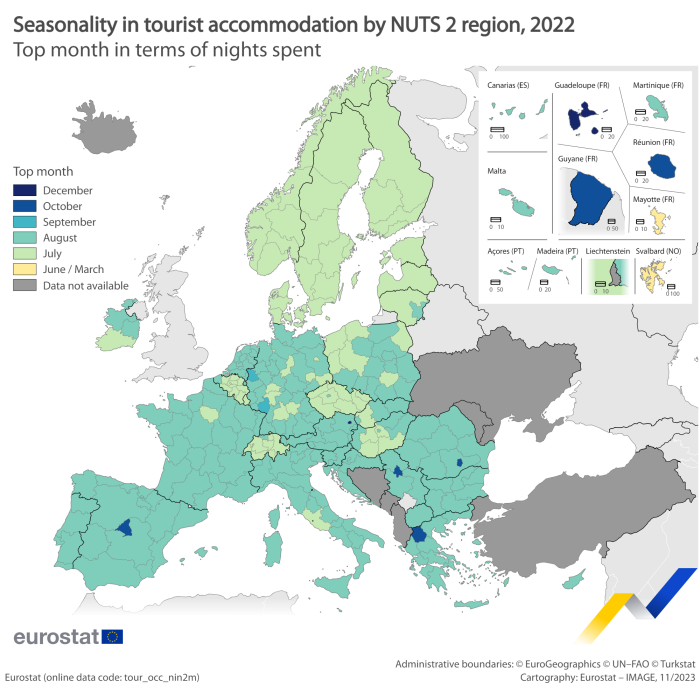
Map 2 shows for each EU region the month with the highest number of nights spent in tourist accommodation throughout 2022. In nearly three out of four EU regions (170 out of the 242 EU regions with available data), August is the month with the highest concentration in the number of nights spent, followed by July in 62 EU regions mainly, covering most of northern Europe and parts of Belgium, Czechia, Germany, France, Italy, Hungary and Slovakia.
Source: Eurostat (tour_occ_nin2m)
In only 5 EU regions October is the top month, namely Dytiki Makedonia in Greece, Comunidad de Madrid in Spain, Guyane and La Réunion in France and Bucureşti-Ilfov in Romania. In other four regions, September or December is the top month. This is the case for the capital region of Austria (Wien), the German regions Düsseldorf and Rheinhessen-Pfalz and the French region Guadeloupe. In the French region Mayotte, March is the top month. As is the case for all regions where neither July nor August are the top month, these regions have a relatively weak seasonality, below the EU average (which is 34 % of annual nights spent in the top 2 months).
Capital regions tend to have a less significant seasonal pattern
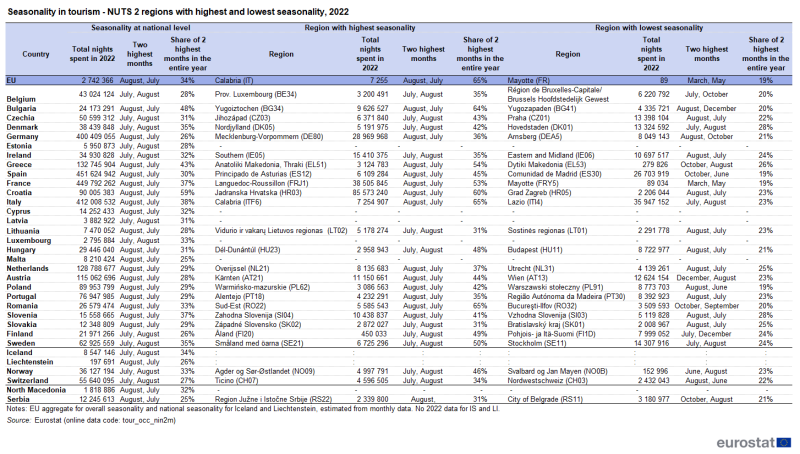
Table 2 breaks down the data by country, showing for each the region with the highest seasonality and the region with the lowest seasonality. The three countries that include the most seasonal regions (see above) have also the widest spread within the country: in Romania, the most seasonal region records 65 % of all tourism nights during July or August, while in the least seasonal region, Bucureşti-Ilfov, the top 2 months account for only 20 % of all tourism nights. Similarly, in Bulgaria the least seasonal region only records 20 % of annual tourism nights in the top 2 months (August and December, for the region of Yugozapaden), compared with 64 % for the most seasonal region. In Italy, the most seasonal region records 65 % of all tourism nights during July or August, while the least seasonal region, Lazio, accounts for only 23 % of annual tourism nights in the same top 2 months.
Source: Eurostat (tour_occ_nin2m)
Generally speaking, regions that include capital cities tend to attract tourists all year round, be it for private or professional reasons, and show a less pronounced seasonal pattern. In 15 out of 22 countries that have regional subdivisions, the capital region is the least seasonal region. This is the case for the regions comprising Brussels, Sofia, Prague, Copenhagen, Dublin, Madrid, Zagreb, Rome, Vilnius, Budapest, Vienna, Warsaw, Bucharest, Bratislava and Stockholm.
Only a few regions see a different seasonal pattern for domestic and international guests
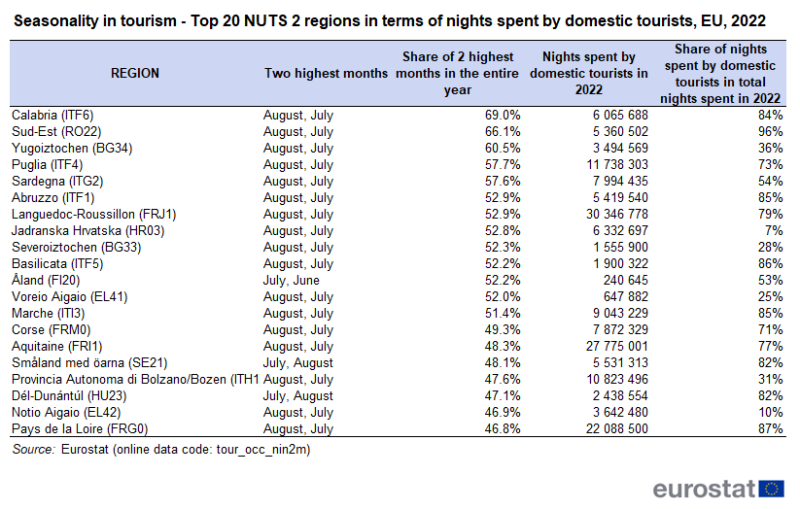
Tables 3 and 4 look at the seasonal pattern in tourism flows, broken down by domestic guests and international guests respectively. Among the top 10 regions that have the highest seasonality when considering the segment of domestic tourists, 5 are located in Italy. Except for Puglia and Sardegna, these Italian regions attract predominantly domestic tourists all year round.
Source: Eurostat (tour_occ_nin2m)
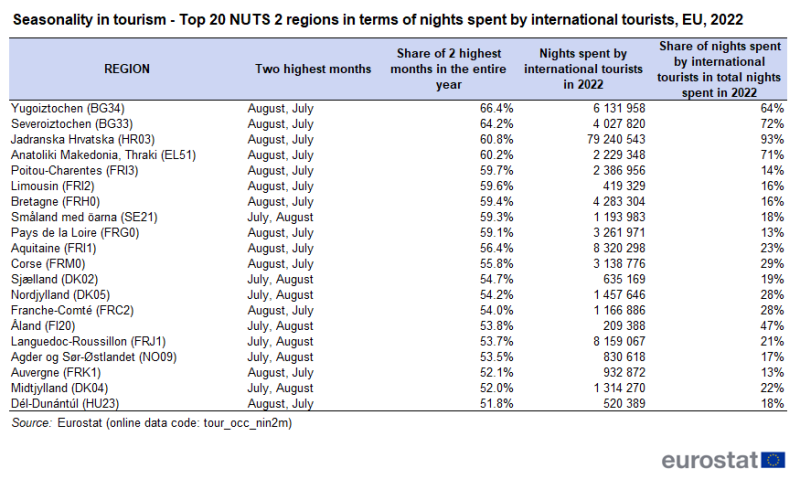
Alternatively, when looking at the top 10 regions that have the highest seasonality when considering the segment of international tourists, 5 are located in France. However, the significance of international tourism is relatively low in these regions. Only in 17 out of 242 regions are the top 2 months for domestic tourists different from the top 2 months for international tourists. This is the case for regions of Bulgaria, Germany, Ireland, Spain, France, Croatia, Italy, Austria, Poland and Finland.
Source: Eurostat (tour_occ_nin2m)
The Greek region Notio Aigaio records the highest number of tourists versus locals in the peak month
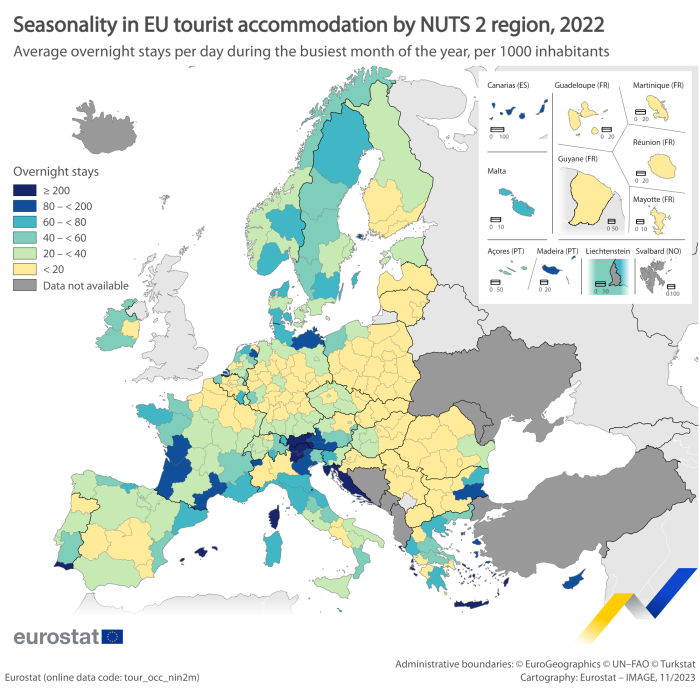
Map 3 shows for each region the tourism intensity during the peak month, defined as the number of nights spent at tourist accommodation establishments per 1000 inhabitants. In ten EU regions, this ratio exceeds 200. The highest ratio is observed in the island region Notio Aigaio in Greece (which includes popular islands like Rhodes, Kos, Mykonos), where during the peak month (August) 787 overnight stays by tourists are recorded per 1000 inhabitants. It should be noted that the data is an underestimation of the real tourism pressure as the nominator of the ratio doesn’t include same-day visitors or tourists staying in non-rented accommodation, such as second homes or stays with friends or relatives. Other regions with a high tourism intensity are the region bordering the Adriatic coast in Croatia (Jadranska Hrvatska), the Austrian and Italian alpine areas, island regions in Greece (Ionia Nisia, Kriti), Spain (Illes Balears) and France (Corse), and Algarve in Portugal.
Source: Eurostat (tour_occ_nin2m)
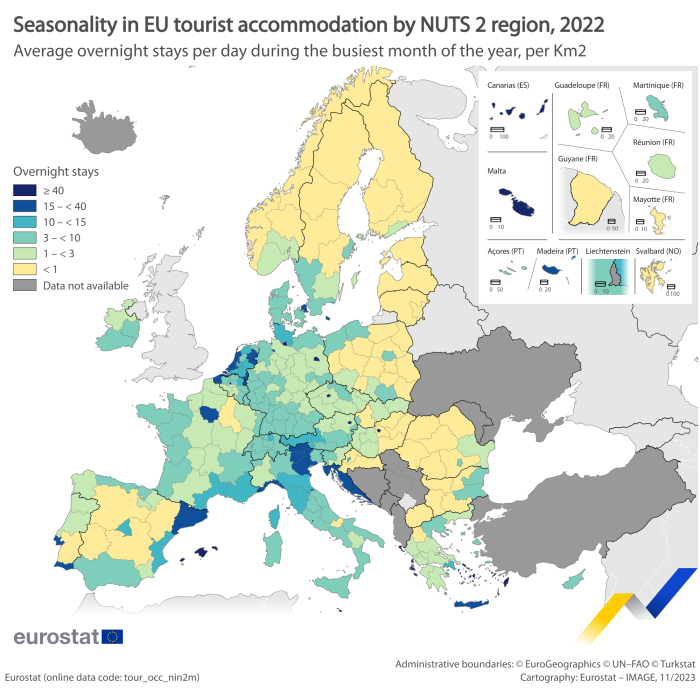
When considering the number of tourism nights per square kilometer during the peak month (Map 4), the regions with the highest tourism density are generally smaller regions that comprise a major city. This is the case for regions that comprise Brussels (on average 128 tourists per night per km2 in the peak month), Vienna (114), Berlin (107), Prague (101), Hamburg (70) and Budapest (60). In these six cities, the peak month is July, August or December. With 112 overnights stays on average per square kilometer, the tourism density was also high in the peak month for Malta (August), while in Illes Balears in Spain, it reached 84 overnights stays on average per square kilometer.
Source: Eurostat (tour_occ_nin2m)
Source data for tables and graphs
Data sources
Regulation (EU) No 692/2011 concerning European statistics on tourism, organises the European statistical system of tourism statistics. This system consists of two main components: statistics on capacity and occupancy of tourist accommodation and statistics on tourism demand. The former are collected in most Member States via surveys filled in by accommodation establishments, while the latter are mostly collected by means of traveller surveys at the border or via traditional household surveys.
Statistics on the occupancy of tourist accommodation refer to the number of arrivals (at accommodation establishments) and the number of nights spent by residents and non-residents, broken down by type of establishment or by region. Both annual and monthly series are available. Statistics on the use of bed places and bedrooms (occupancy rates) are also compiled.
Statistics on the demand for tourism look at participation, i.e. the number of residents that make at least one trip of at least one overnight stay during the reference period. They also look at the number of tourism trips made (and the number of nights spent on those trips), broken down by tourism-related variables such as country of destination, month of departure, length of stay, type of organisation of the trip, mode of transport, type of accommodation or expenditure, and by socio-demographic variables, such as age or gender.
Context
In June 2010, the European Commission released a Communication entitled Europe, the world's No. 1 tourist destination - a new political framework for tourism in Europe. One of the challenges and opportunities facing the European tourism industry is the seasonal distribution of demand for tourism. Better use of existing tourist infrastructure and staff in the low season could help businesses improve their productivity and benefit from a more stable and motivated workforce. Extending the tourism season or spreading tourism activities more evenly throughout the year can significantly boost the sustainability and competitiveness of European tourist destinations.
Direct access to
Main tables
- Tourism (t_tour)
Database
Dedicated section
Publications
Methodology
- Capacity and occupancy of tourist accommodation establishments (ESMS metadata file — tour_occ_esms)
Legislation
- Regulation (EU) No 692/2011 of the European Parliament and of the Council of 6 July 2011 concerning European statistics on tourism and repealing Council Directive 95/57/EC. (Summary)
- Commission Implementing Regulation (EU) No 1051/2011 of 20 October 2011 implementing Regulation (EU) No 692/2011 of the European Parliament and of the Council concerning European statistics on tourism, as regards the structure of the quality reports and the transmission of the data.
- Commission Delegated Regulation (EU) No 253/2013 of 15 January 2013 amending Annex II to Regulation (EU) No 692/2011 of the European Parliament and of the Council, as regards adaptations following the revision of the International Standard Classification of Education ISCED in relation to the variables and breakdowns to be submitted.
- Commission Implementing Regulation (EU) No 81/2013 of 29 January 2013 amending Implementing Regulation (EU) No 1051/2011 as regards the micro-data files for the transmission of data.
- Commission Delegated Regulation (EU) 2019/1681 of 1 August 2019 amending Regulation (EU) No 692/2011 of the European Parliament and of the Council concerning European statistics on tourism, as regards the transmission deadlines and adaptation of Annexes I and II.
- Commission Delegated Regulation (EU) 2020/1569 of 23 July 2020 amending Annex I to Regulation (EU) No 692/2011 of the European Parliament and of the Council, on the classification of countries of residence of guests staying at tourist accommodation establishments in the context of the withdrawal of the United Kingdom from the Union.
- Commission Implementing Regulation (EU) 2021/1179 of 16 July 2021 amending Implementing Regulation (EU) No 1051/2011 as regards the aggregate tables and micro-data files for the transmission of the data.
Visualisations
- Regional Statistics Illustrated - select statistical domain 'Tourism' (top right)
External links
- Agenda for a sustainable and competitive European tourism (Communication from the European Commission, October 2007)
- European Commission - Directorate-General for Internal Market, Industry, Entrepreneurship and SMEs - Tourism
- European Commission - Directorate-General for Internal Market, Industry, Entrepreneurship and SMEs - Low season tourism