Archive:International trade in cars
Data extracted in March 2022.
Planned article update: April 2023.
Highlights
Cars – exports to countries outside the EU fell from €140 billion in 2019 to €127 billion in 2021.
Cars - In Slovakia 48 % of exports to countries outside the EU in 2021 were cars.
Cars – Germany largest exporter (€77 billion, 61 % of EU total) in 2021.
EU exports, imports and trade balance in motor cars, 2002-2020
This article describes the development of trade in cars. The car industry is of prime importance to the economy of the European Union (EU) and plays a major role in international trade.
This article is part of an online publication providing recent statistics on international trade in goods, covering information on the EU's main partners, main products traded, specific characteristics of trade as well as background information.
Full article
Car exports peaked in 2015
In 2021, the EU exported €127 billion worth of cars, which was 23 billion less than the peak of €150 billion in 2015. Imports in 2021 amounted to €53 billion, giving the EU a trade surplus of €74 billion (Figure 1). The value of extra-EU trade in cars increased by an average of 3.0 % per year between 2002 and 2021 with imports (3.9 %) growing faster than exports (2.6 %).
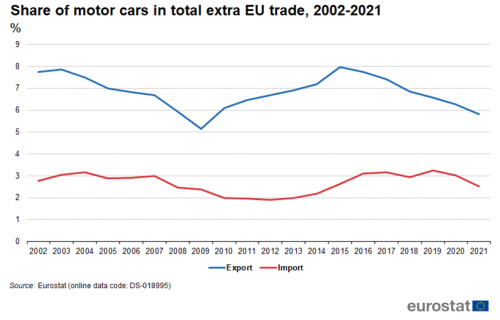
In 2002, the share of cars in total extra EU exports of goods was 7.7 % (Figure 2). This share dropped to 5.2 % in 2009 and peaked at 8.0 % in 2015 and then dropped to 5.8 % in 20210. The share of cars in total extra EU imports of goods was 2.8 % in 2002. It dropped to 1.9 % in 2012 and reached a peak of 3.3 % in 2019 before falling to 2.5 % in 2021.
The United Kingdom and the United States were the EU's biggest partners in trade of cars in 2021
In 2021, the United States was the main export destination of EU's cars (20 % of the total), ahead of the United Kingdom, China (both 17 %), Switzerland, South Korea, Japan (all 5 %) and Turkey (4 %). These seven partners made up almost three quarters of extra-EU exports of cars.
With 15 %, the United States and United Kingdom were the main origin of extra-EU imports, ahead of South Korea, Japan (both 13 %), Turkey, China (both 11 %) and Mexico (9 %). Together the top seven made up 88 % of all extra-EU imports of cars. It should be noted that exports and imports relate to production within the corresponding country, regardless of the nationality of the factory.
Between 2002 and 2008, exports of cars to the United States had already fallen from €23 billion to €18 billion (Figure 4). In 2009 they declined to €11 billion, losing €7 billion in only one year. However, there was a strong resurgence of exports, peaking at 34 billion in 2015. In 2021 exports were €26 billion.
Imports from the United States grew from €3 billion in 2002 to €6 billion in 2008 but then halved in 2009. They peaked in 2020 at €11 billion but dropped to €8 billion in 2021.
During the whole period, the EU had a trade surplus for cars with the United States. It was lowest in 2009 (€8 billion), peaking in 2015 (€27 billion) and then stood at €17 billion in 2021.
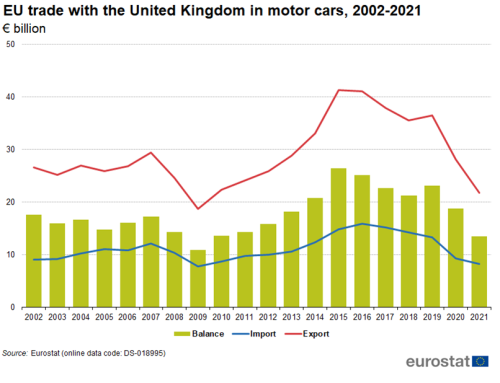
In 2002, exports of cars to the United Kingdom amounted to €27 billion, which after some fluctuations dropped to €19 billion in 2009 (Figure 5). After that they grew to €41 billion in 2015 and 2016, but had dropped to €22 billion in 2021.
Imports from the United Kingdom were €9 billion in 2002, and remained between €8 billion and €12 billion until 2014. They increased to €16 billion in 2016 after which they gradually fell to €8 billion in 2021.
Between 2002 and 2021, the EU had a trade surplus for cars with the United Kingdom which peaked at €26 billion in 2015. It dropped to €13 billion in 2021.
In 2002, exports of cars to China amounted to €1 billion, growing to 5 billion in 2009 (Figure 6). After that growth accelerated, peaking at €21 billion in 2021. Imports of cars from China where very small until 2019 but in recent years are growing, reaching €6 billion in 2021.
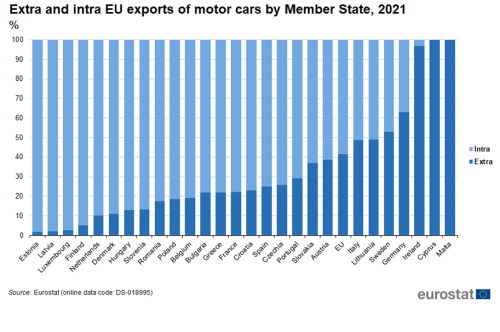
The share of intra- and extra-EU imports of cars varied greatly between Member States (Figure 7). The share for extra-EU imports was above 50 % in Cyprus (56 %), Malta (55 %), Belgium (51 %) and Slovenia (41 %), and below 5 % in Luxembourg (1 %), Slovakia, Croatia (both 3 %), Estonia, Austria (both 4 %), Latvia and Czechia (both 5 %). The average for the EU was 24 %.
The share of intra- and extra-EU exports of cars varied even more than for imports. The share for extra-EU exports was above 90 % in Malta, Cyprus (both 100 %) and Ireland (97 %) and below 5 % in , Luxembourg (3 %), Latvia and Estonia (both 2 %). The average for the EU was 41 %.
Germany is the EU's largest exporter of cars
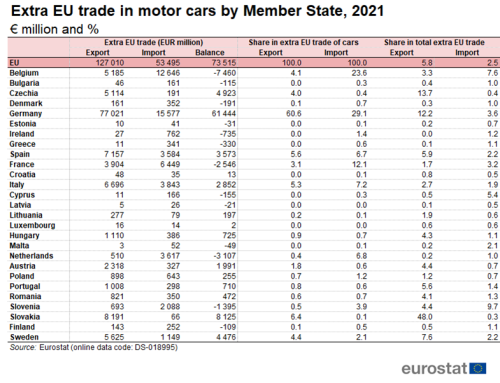
Looking at the trade in cars by individual Member State, Germany alone was responsible for 60.6 % of the EU total exports in 2021 (Table 1). In relative terms, i.e. compared to their total extra-EU export, cars represented 12.2 % of Germany's total exports. This share was surpassed only by Slovakia (48.0 %) and Czechia (13.7 %) which were the only other Member States whose share of cars in total exports of goods was higher than 10 %.
With a trade value of €15.6 billion in 2021, Germany’s share in total EU imports of cars (29.1 %) was the highest of the EU imports. It was followed by Belgium (23.6 %) and France (12.1 %). For most member states imports of cars made up less than 5 % of their total imports of goods. The only three countries with higher shares were Slovenia (9.7 %), Belgium (7.6 %) and Cyprus (5.4 %). Thirteen Member States had deficits for trade in cars in 2021. It was highest in Belgium (€7.5 billion), the Netherlands (€3.1 billion) and France (€2.5 billion). The remaining fourteen Member States had surpluses, which was highest in Germany (€61.4 billion) and Slovakia (€8.1 billion).
The subcategory 'motor cars and other motor vehicles for transporting persons', described above as cars, is one of the six subcategories that make up the category road vehicles. Total exports of road vehicles in 2021 were worth €214.4 billion and their imports were worth €101.5 billion. Exports of cars (€127.0 billion) made up 59 % of road vehicles while imports of cars (€53.5 billion) were 59 % of imports (Figure 9). 'Parts and accessories of motor vehicles' followed with exports of €53.7 billion (25 %) and imports of €23.5 billion (23 %). 'Motor vehicles for the transport of goods and special-purpose motor vehicles’ had exports of €17.3 billion (8 %) and imports of €6.7 billion (7 %). 'Motor cycles and cycles, motorized and non-motorized; invalid carriages' is the only subcategory where the EU had a trade deficit which amounted to €8.3 billion in 2021.
Source data for tables and graphs
Data source
EU data comes from Eurostat’s COMEXT database.
COMEXT is the Eurostat reference database for international trade in goods. It provides access not only to both recent and historical data from the EU Member States but also to statistics of a significant number of non-EU countries. International trade aggregated and detailed statistics disseminated from Eurostat website are compiled from COMEXT data according to a monthly process. Because COMEXT is updated on a daily basis, data published on the website may differ from data stored in COMEXT in case of recent revisions.
European statistics on international trade in goods are compiled according to the EU concepts and definitions and may, therefore, differ from national data published by Member States.
The United Kingdom is considered as an extra-EU partner country for the EU for the whole period covered by this article. However, the United Kingdom was still part of the internal market until the end of the transitory period (31 December 2020), meaning that data on trade with the United Kingdom are still based on statistical concepts applicable to trade between the EU Member States. Consequently, while imports from any other extra-EU trade partner are grouped by country of origin, the United Kingdom data reflect the country of consignment. In practice this means that the goods imported by the EU from the United Kingdom were physically transported from the United Kingdom but part of these goods could have been of other origin than the United Kingdom. For this reason, data on trade with the United Kingdom are not fully comparable with data on trade with other extra-EU trade partners.
Product classification Products of the road vehicles sector are defined according to the fourth revision of the Standard international trade classification. They include divisions for 781 motor cars and other motor vehicles for transporting persons; 782 Motor vehicles for the transport of goods and special-purpose motor vehicles; 783 Road motor vehicles, not elsewhere specified (tractors, etc); 784 Parts and accessories of motor vehicles; 785 Motor cycles and cycles, motorized and non-motorized; invalid carriages; and 786 Trailers and semi-trailers.
Unit of measure Trade values are expressed in millions of euros. They correspond to the statistical value, i.e. to the amount which would be invoiced in case of sale or purchase at the national border of the reporting country. It is called a FOB value (free on board) for exports and a CIF value (cost, insurance, freight) for imports.
Context
Trade is an important indicator of Europe’s prosperity and place in the world. The bloc is deeply integrated into global markets both for the products it sources and the exports it sells. The EU trade policy is one of the main pillars of the EU’s relations with the rest of the world.
Because the 27 EU Member States share a single market and a single external border, they also have a single trade policy. EU Member States speak and negotiate collectively, both in the World Trade Organization, where the rules of international trade are agreed and enforced, and with individual trading partners. This common policy enables them to speak with one voice in trade negotiations, maximising their impact in such negotiations. This is even more important in a globalised world in which economies tend to cluster together in regional groups.
The openness of the EU’s trade regime has meant that the EU is the biggest player on the global trading scene and remains a good region to do business with. Thanks to the ease of modern transport and communications, it is now easier to produce, buy and sell goods around the world which gives European companies of every size the potential to trade outside Europe.
Direct access to
Other articles
Main tables
- International trade in goods - long-term indicators (t_ext_go_lti)
- International trade of machinery and transport equipment (SITC 7), by declaring country (tet00009)
- Extra-EU28 trade of machinery and transport equipment (SITC 7), by Member State (tet00059)
- Extra-EU28 trade of machinery and transport equipment (SITC 7), by main partners (tet00030)
- International trade in goods - short-term indicators (t_ext_go_sti)
- Imports of goods - machinery and transport equipment (teiet170)
- Exports of goods - machinery and transport equipment (teiet070)
Database
- International trade in goods - aggregated data (ext_go_agg)
- International trade in goods - detailed data (detail)
Dedicated section
Data visualisations
Methodology
- International trade in goods statistics - background
- International trade in goods (ESMS metadata file — ext_go_agg_esms)
- User guide on European statistics on international trade in goods
Legislation
- Regulation (EC) No 471/2009 of 6 May 2009 on Community statistics relating to external trade with non-member countries
- Summaries of EU Legislation: Extrastat: statistics relating to trade with non-EU countries
- Regulation (EU) No 92/2010 of 2 February 2010 implementing Regulation (EC) No 471/2009, as regards data exchange between customs authorities and national statistical authorities, compilation of statistics and quality assessment
- Regulation (EU) No 113/2010 of 9 February 2010 implementing Regulation (EC) No 471/2009 , as regards trade coverage, definition of the data, compilation of statistics on trade by business characteristics and by invoicing currency, and specific goods or movements.


