Archive:Employment - quarterly statistics
Data extracted in October 2021
Planned article update: January 2022
Highlights
The second quarter of 2021 marked an important phase in the recovery of the European economy and labour market. This is the beginning of the general lifting of distancing measures generated by the health crisis due to the COVID-19 pandemic. Many EU Member States started implemented intermediary measures and announced the end, partially or entirely, of the financial assistance to businesses to mitigate the negative effects of the COVID-19 crisis on employment and businesses. In the second quarter, the rebound of the economy is initiated and clearly visible comparing with the first quarter of 2021.
This article gives an overview of employment at EU level as well as in tEU Member States focusing on the two first quarters of 2021. The reference data are from the European Union Labour Force Survey (EU-LFS). It also provides for the first time an insight of the quarterly results collected on the employment of first but also second generation of immigrants. More traditionally, this article depicts employment in general and specifically by gender, age, and level of educational attainment. A specific analysis is dedicated to the temporary contracts and part-time work in the second quarter of 2021.
This article is part of the publication Labour market in the light of the COVID-19 pandemic.
Note: Please take note that figures presented in this article may differ in some cases from the source data due to continuous revision of the Eurostat database (Employment and unemployment (Labour Force Survey)).
Full article
Employment in upward phase, specifically for mid-age women
<> </> In the EU, employment of women aged 25 to 54 increased by 1.2 p.p., highest increase recorded from Q1 2021 to Q2 2021, lowest increases recorded for workers aged 55-64
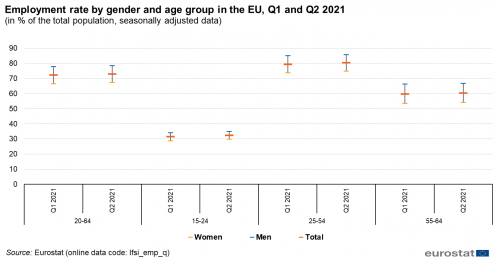
In the second quarter of 2021, the share of employed people in the total population aged 20 to 64 reached 72.1 % after recording an increase of 0.7 percentage points (p.p.)) from the previous quarter (see Figure 1). The total employment rate hides a significant difference between men and women. While 78.3 % of men aged 20-64 are employed, women showed an employment rate of 67.2 %. Therefore, the gender gap amounted to 11.1 p.p. in the second quarter of 2020.
In the EU, slightly less than 1 in 3 young people aged 15 to 24 are employed (32.3 %). The male employment rate was 34.9 % against 29.6 % for women. Gender gap was narrower for young people (i.e. 5.3 p.p.) than for the reference population. Employment of men and women increased to the same extent between the first and second quarter of 2020 (+ 0.9 p.p.).
Around 8 in 10 people aged 25 to 54 were employed in the EU in Q2 2021 (80.3 %). The gender gap become wider in comparison with young people with a difference of 9.9 p.p. between the employment rate of men (85.7 %) and of women (74.8). The development between the first and the second quarter showed a noticeable difference between men and women. The employment rate of women increased by 1.2 p.p. against 0.8 p.p. for men. The lowest increases between the two quarters have been registered among people aged 55 to 64, the share of employed men as well as of employed women increased both by 0.6 p.p to reach respectively 66.7 % and 54.0 %. Employed people in this age group also show the biggest gender gap compared to the other two groups with a difference between men and women of 12.7 p.p.
(in % of the total population, seasonally adjusted data)
Source: Eurostat (lfsi_emp_q)
Employment increased in 25 out of 27 EU Member States from Q1 2021 to Q2 2021
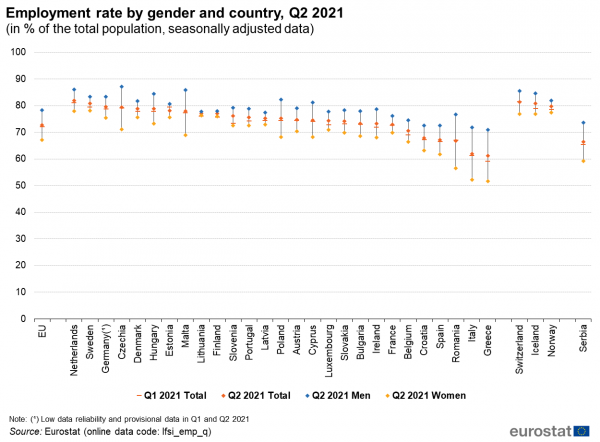
In order to provide an overview of the employment at national level, Figure 2 presents the employment rate of people aged 20 to 64 by country and gender in the second quarter of 2021, it also shows the level of employment in the previous quarter for the total population. This figure clearly shows that the employment rates are not homogeneous across the European Union, first between countries but also between gender in many EU Member States. In the Netherlands and in Sweden, more than 8 in 10 people aged 20 to 64 were employed (82.0 % and 80.8 % respectively) while the share of employed people stood below 70 % in Greece (61.2 %), Italy (62.0 %), Romania (66.8 %), Spain (67.2 %) and Croatia (67.8 %).
Comparing with the first quarter of 2021, the highest increases were reported by Slovenia (+2.8 p.p.), Greece (+2.1 p.p.), Belgium and Luxembourg (both +1.5 p.p.). The share of employed people also increased in France, Cyprus, Czechia, Bulgaria and Austria but a lesser extent: the increases in those countries did not exceed 0.5 p.p. Only in two EU Member States (i.e. Estonia and Romania), the employment rate decreased from the first to the second quarter 2021 (-1.4 p.p. and -0.3 p.p.). In all EU countries, the share of employed men is higher that the share of employed women. Although the three widest gender gaps in employment are also observed among countries with the lowest employment rates, this relationship between both is not verified in all countries. The greatest differences between the employment rate of men and women were found in Romania, Italy, Greece, Malta and Czechia, all showing a gender gap exceeding 15 p.p. Czechia and Malta showing relatively high employment rates, 79.4 % and 78.0 % respectively. In contrast, Estonia, Latvia, Finland and Lithuania recorded the narrowest gaps between men and women as they were all below 5 p.p. For comparison purpose, Czechia, Netherlands and Malta reported the highest male employment rates of men with respectively 87.1 %, 86.0 % and 85.8 % while the highest female employment rates reached in Q2 2021 78.2 % in Sweden, 78.0 % in the Netherlands and 76.3 % in Lithuania.
(in % of the total population, seasonally adjusted data)
Source: Eurostat (lfsi_emp_q)
Around half people with low education level in employment
Slovakia, Romania, Poland and Bulgaria recorded the largest employment differences between people with low and high educational attainment level in Q2 2021
Another way of looking at employment according the educational attainment level is to show the distribution of people in employment and in the total population according to the level of education as displayed in Figure 3. The objective here is to investigate if there are differences in the employed population in comparison with the total population (employed and not employed) as regards the level of education. Figure 3 presents these distributions for both men and women and for the total. In the whole population aged 20 to 64, around 1 in 5 persons had a low educational attainment level (20.3 %) but among employed people, only 15.0 % had a low educational attainment level so this category seems under-represented in the employed population. The low educational attainment level refers to the attainment of less than primary, primary or lower secondary education, at most. With respect to people with a medium educational attainment level (corresponding to at most upper secondary or post-secondary non-tertiary education), they show approximately the same weight in the population as well as in employment, 47.9 % vs 47.6 %. People with a high level of educational attainment level i.e. tertiary education accounted for 31.7 % of the total population but for 37.4 of total employment.
The largest differences were found among women with a low and high level of education. The share of women with a low level of education in the female population was 19.4 % but they accounted only for 12.3 % of the employed women. In the opposite, more than 40 % (42.5 % exactly) of employed women had a high level of education but looking at the total female population, they accounted for slightly more than one third (34.4 %).
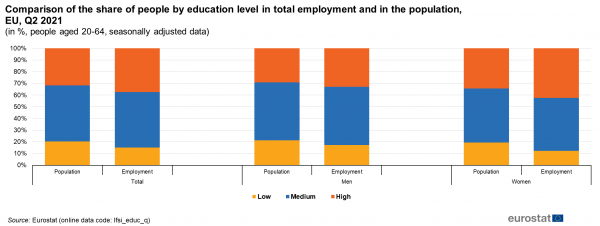
(in %, people aged 20-64, seasonally adjusted data)
Source: Eurostat (lfsi_educ_q)
At EU level, the employment rate of people with a low level of education is 54.3 %, 72.4 % among people with a medium level of education and 84.8 % for people with a high level of education. As a matter of fact, the EU countries show very disparate employment rates with respect to people with a low educational attainment level. More than 60 % of people with low educational attainment level are employed in Portugal (68.7 %), the Netherlands (66.2 %), Malta (64.8 %), Cyprus (63.8 %), Germany (61.1 %), Luxembourg (60.6 %) and Estonia (60.3 %) but less than 45 % in Belgium (43.8 %), Croatia (43.4 %), Romania (41.7 %) and Slovakia (25.3 %). The largest differences between the share of employed people with a high and those with a low educational attainment level were found in Slovakia (59.8 p.p.), Romania (47.0 p.p.), Poland (43.4 p.p.), Bulgaria (43.0 p.p.), Croatia (40.9 p.p.) and Belgium (40.4 p.p.). Based on the most recent data, more than one third (34.2 %) of people aged 25-64 with a low education attainment level are actually between 55 and 64 years old. This category of people aged 55 to 64 represent 27.1 % of those with a medium educational attainment level aged 25-54 and 18.3 % of those with a high education level.
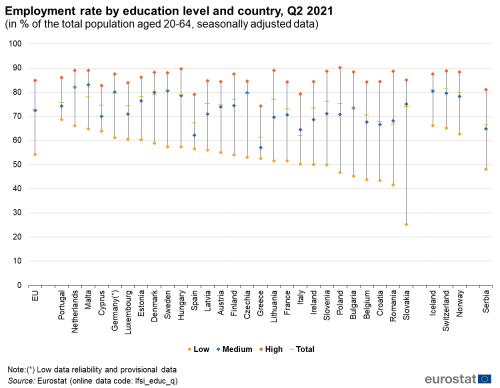
(in % of the total population aged 20-64, seasonally adjusted data)
Source: Eurostat (lfsi_educ_q)
Prevalence of temporary contracts among young employed people, part-time among women
One relevant finding in the second quarter of 2021 refers to the share of temporary contracts (see Figure (map) . Taking the population of employees as reference, temporary contract affects 13.0 % of employees in the EU. This share hit 24.7 % in Spain and 23.1 % in the Netherlands that means that alsmost 1 in 4 employees aged 20-64 are employed with a temporary contract. This share was below 5 % in Slovakia (3.7 %), Bulgaria (3.2 %), Romania (2.4 %), Latvia (2.4 %), Lithuania(1.9 %), Estonia (1.7 %). It also seems that there is no clear link between the level of employment and the share of temporary contract in a country, this means that a high or a low employment rate did not explicitely impact the share of temporary contracts in a specific country (see the attached excel file for further details).

(in % of total employees aged 20-64, seasonally adjusted data)
Source: Eurostat (lfsi_pt_q)
However, the disparity between the different age groups is very high. Almost 1 in 2 employees aged 15 to 24 (49.0 %) was under a temporary contract when it turned to around 1 in 10 (11.9 %) for people aged 25 to 54 and less (6.3 %) for people aged 55 to 64. Furthermore, the last quarterly results based on the Labour Force Survey show that the share of temporary contracts among young people is quite specific across countries. For example, it equals to or exceeds 60 % in Spain, which recorded the highest share with 69.4 %, in the Netherlands (66.6 %), in Slovenia (64.7 %), in Italy (61.7 %) and in Portugal (60.0 %) while temporary contracts in the total employees amounted to less 15 % in Malta (14.7 %), Slovakia (13.5 %), Hungary (13.2 %), Romania (8.8 %), Lithuania (8.7 %) and Bulgaria (8.5 %).
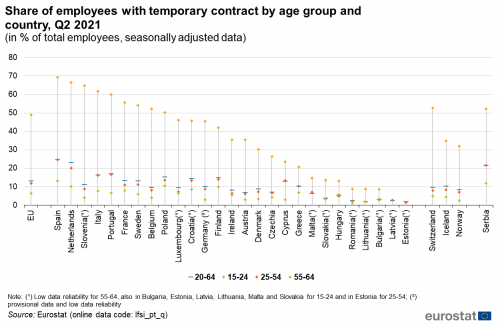
(in % of total employees, seasonally adjusted data)
Source: Eurostat (lfsi_pt_q)
Temporary contracts and part-time employment lag behind
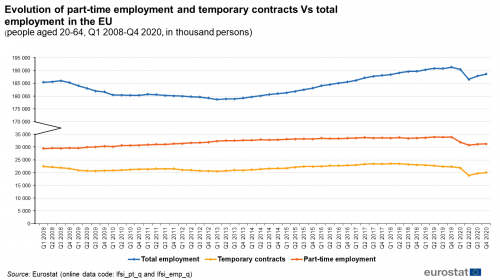
(people aged 20-64, Q1 2008-Q4 2020, in thousand persons)
Source: Eurostat (lfsi_pt_q)
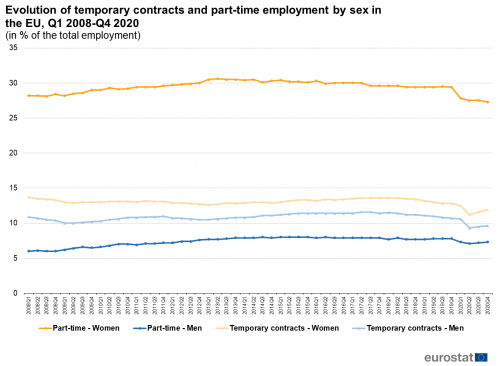
(in % of the total employment)
Source: Eurostat (lfsi_pt_q)
A 10% drop in temporary contracts
Temporary contracts accounted for 10.6 % of total EU employment in the last quarter of 2020, or slightly more than one out of every ten employed people in the EU in Q4 2020, compared to 11.7 % in Q4 2019. From Q4 2019 to Q2 2020, the number of temporary contracts fell by 15.1 % while employment fell by 2.5 %. Consecutively, between Q2 2020 and Q4 2020, the temporary contracts increased by 6.0 %. Over the period Q4 2019-Q4 2020, they decreased by 10.1 % (see Figure 8).
Women with temporary contracts accounted for 11.9 % of the total female employment while this share was 9.6 % for men in the fourth quarter of 2020 (see Figure 9). Men and women seem to follow the same trend however the development in 2020 slightly differs. From Q4 2019 to Q2 2020, the share of temporary contracts in the total female employment decreased by 1.6 p.p. against 1.4 p.p. for men. However, from Q2 2020 to Q4 2020, this share increased by 0.7 p.p. for women but only by 0.3 p.p. for men.
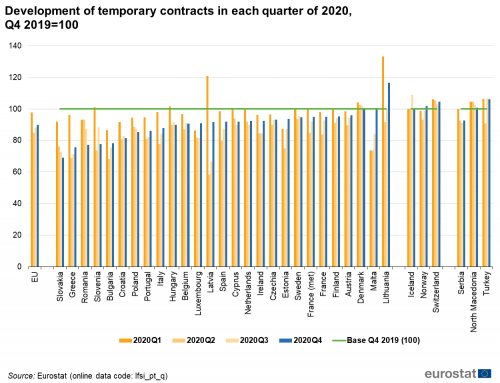
Figure 10 shows the level of temporary contracts in each quarter of 2020 by taking Q4 2019 as a reference (fixed to 100). The level in Q4 2020 was below the level in Q4 2019 in 23 out of 26 countries for which data is available, and in 5 countries, the level in Q4 2020 was even more than 20 % lower than in Q4 2019: these countries were Slovakia (69.2 in Q4 2020), Greece (75.7), Romania (77.3), Slovenia (77.7) and Bulgaria (78.3).
Decrease by 8% in part-time employment
Part-time employment corresponded in Q4 2020 to 16.6 % of the total EU employment. From Q4 2019 to Q2 2020, part-time employment dropped by 9.3 % while total employment fell by 2.5 %. Consecutively, between Q2 2020 and Q4 2020, the number of people in part-time employment increased by 1.4 %. Over the period Q4 2019-Q4 2020, they decreased by 8.0 % (see Figure 8).
Figure 9 shows clearly the gender gap among part-time employment. In the total female employment, women with part-time employment amounted to 27.3 % against 7.3 % for men. From Q4 2019 to Q2 2020, the share of women with part-time employment decreased by 1.9 p.p. against 0.7 p.p. for men, and from Q2 2020 to Q4 2020, the share of women still decreased by 0.2 p.p. while the share of men increased by 0.2 p.p. Comparing Q4 2020 with Q4 2019, women in part-time employment experienced a largest decrease than men in part-time employment (-2.1 p.p. for women versus -0.5 p.p. for men).
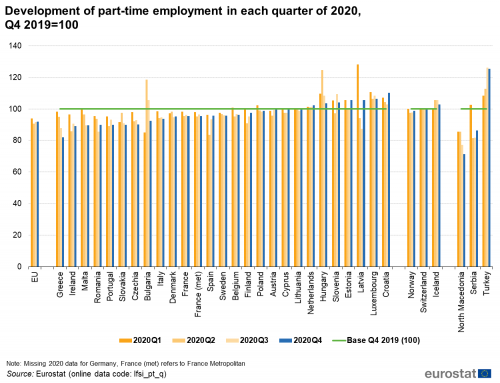
As previously shown for temporary contracts, Figure 10 shows the level in each quarter of 2020 by taking Q4 2019 as a reference (fixed to 100). Based on Figure 11, five out of twenty-six countries for which data is available were at least 10 points below their level of Q4 2019, namely Greece (82.1 in Q4 2020), Ireland (89.3), Malta (89.7), Romania and Portugal (both 89.9).
Source data for tables and graphs
Data sources
All figures in this article are based on seasonally adjusted quarterly results from the European Union Labour Force Survey (EU-LFS).
Source: The European Union Labour Force Survey (EU-LFS) is the largest European household sample survey providing quarterly and annual results on labour participation of people aged 15 and over as well as on persons outside the labour force. It covers residents in private households. Conscripts in military or community service are not included in the results. The EU-LFS is based on the same target populations and uses the same definitions in all countries, which means that the results are comparable between countries.
European aggregates: EU refers to the sum of the 27 EU Member States.
Country note: (1) In Germany, from the first quarter of 2020 onwards, the Labour Force Survey (LFS) has been integrated into the newly designed German microcensus as a subsample. Unfortunately, for the LFS, technical issues and the COVID-19 crisis have had a large impact on the data collection processes, resulting in low response rates and a biased sample. For this reason, the full sample of the whole microcensus has been used to estimate a restricted set of indicators for the four quarters of 2020 for the production of LFS Main Indicators. These estimates have been used for the publication of German results, but also for the calculation of EU and EA aggregates. By contrast, EU and EA aggregates published in the Detailed quarterly results (showing more and different breakdowns than the LFS Main Indicators) have been computed using only available data from the LFS subsample. As a consequence, small differences in the EU and EA aggregates in tables from both collections may be observed. For more information, see here. (2) Metropolitan France, also known as European France, is the area of the French Republic which is geographically in Europe. It comprises mainland France and Corsica, as well as nearby islands situated in the Atlantic Ocean, the English Channel and the Mediterranean Sea. In contrast, overseas France is the collective name for all the French-administered territories outside Europe. Metropolitan and overseas France together form the French Republic, referred to as "France" in the EU-LFS database.
Definitions: The concepts and definitions used in the Labour Force Survey follow the guidelines of the International Labour Organisation.
Different articles on detailed technical and methodological information are linked from the overview page of the online publication EU Labour Force Survey.
Seasonally adjustment models: Some of the EU-LFS based seasonally adjusted data published this quarter has been revised substantially. Indeed, the outbreak of the COVID-19 crisis actually lead to a major shock into the series. The impact of COVID-19 on a number of indicators have been explicitly modelled as outliers, and the combined effect of this shock and the new identification of the models explains the observed revisions. The methodological choices of Eurostat in terms of seasonal adjustment in the COVID period are summarised in the methodological paper: "Guidance on time series treatment in the context of the COVID-19 crisis". These choices assure the quality of the results and the optimal equilibrium between the risk of high revisions and the need for meaningful figures, as less as possible affected by random variability due to the COVID shock.
Context
The COVID-19 pandemic hit Europe in January and February 2020, with the first cases confirmed in Spain, France and Italy. COVID-19 infections have since been diagnosed in all European Union (EU) Member States. To fight the pandemic, EU Member States have taken a wide variety of measures. From the second week of March, most countries closed retail shops, with the exception of supermarkets, pharmacies and banks. Bars, restaurants and hotels were also closed. In Italy and Spain, non-essential production was stopped and several countries imposed regional or even national lock-down measures which further stifled economic activities in many areas. In addition, schools were closed, public events were cancelled and private gatherings (with numbers of persons varying from 2 to over 50) banned in most EU Member States.
The majority of the preventative measures were taken during mid-March 2020, and most of the measures and restrictions were in place for the whole of April and May 2020. The first quarter of 2020 was consequently the first quarter in which the labour market across the EU was affected by COVID-19 measures taken by Member States.
Employment and unemployment as defined by the ILO concept are, in this particular situation, not sufficient to describe the developments taking place in the labour market. In the first phase of the crisis, active measures to contain employment losses led to absences from work rather than dismissals, and individuals could not look for work or were not available due to the containment measures, thus not counting as unemployed.
The quarterly data on employment allows along the quarters to report on the impact of the crisis due to the COVID-19 pandemic on employment. This specific article focuses on the age and the level of education attainment of employed people in order to determine potential categories more or less affected by the economic downturn. It also shows the evolution of part-time employment and temporary contracts. Another article on the evolution of employment by occupation, sector of economic activity and professional status is also available in the context of the publication Labour market in the light of the COVID-19 pandemic.
Direct access to
- All articles on employment
- Labour market in the light of the COVID 19 pandemic - quarterly statistics
- Employment rates – annual statistics
- Job vacancy statistics
- Labour market statistics at regional level
- People outside the labour force
- The EU in the world - labour market
- Labour market slack – annual statistics on unmet needs for employment
- LFS main indicators (t_lfsi)
- Population, activity and inactivity - LFS adjusted series (t_lfsi_act)
- Employment - LFS adjusted series (t_lfsi_emp)
- Unemployment - LFS adjusted series (t_une)
- LFS series - Detailed annual survey results (t_lfsa)
- LFS series - Specific topics (t_lfst)
- LFS main indicators (lfsi)
- Employment and activity - LFS adjusted series (lfsi_emp)
- Unemployment - LFS adjusted series (une)
- Labour market transitions - LFS longitudinal data (lfsi_long)
- LFS series - Detailed quarterly survey results (from 1998 onwards) (lfsq)
- LFS series - Detailed annual survey results (lfsa)
- LFS series - Specific topics (lfst)
- LFS ad-hoc modules (lfso)
Publications
- EU labour force survey — online publication
- Labour Force Survey in the EU, candidate and EFTA countries — Main characteristics of national surveys, 2017, 2018 edition
- Quality Report of the European Union Labour Force Survey 2017, 2019 edition
ESMS metadata files and EU-LFS methodology
- Employment and unemployment (Labour Force Survey) (ESMS metadata file — employ_esms)
- Employment growth and activity branches - annual averages (ESMS metadata file — lfsi_grt_a_esms)
- LFS ad-hoc modules (ESMS metadata file — lfso_esms)
- LFS main indicators (ESMS metadata file — lfsi_esms)
- LFS series - Detailed annual survey results (ESMS metadata file — lfsa_esms)
- LFS series - detailed quarterly survey results (from 1998 onwards) (ESMS metadata file — lfsq_esms)
