- Data from September 2010, most recent data: Further Eurostat information, Main tables and Database.
This article examines recent statistics on the developments of service activities in the European Union (EU). Short-term business statistics (STS) are provided in the form of indices that allow the rapid assessment of the economic climate within an economy. Traditionally, short-term business statistics were concentrated on industrial and construction activities, and to a lesser extent retail trade. Since the middle of the 1990s, major developments in official statistics within the EU have seen short-term data collection efforts focus increasingly on services.
Main statistical findings
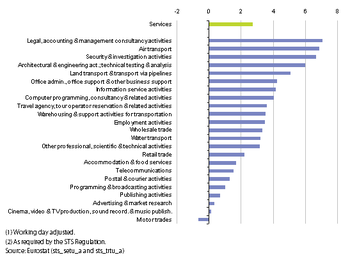
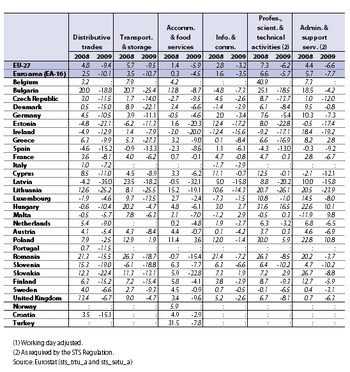
The EU-27 services turnover index grew at an average rate of 2.7 % between 2004 and 2009 (see Figure 1). It should be noted, however, that this five-year range covers a period of relatively steady growth in turnover which came to an abrupt end in mid-2008, followed by a period of slower growth and in some cases falling turnover. In fact the services turnover index fell by 8.5 % in the EU-27 in 2009 compared with the year before. Every Member State (Belgium and Italy, not available) recorded a fall in this index in 2009, ranging from -1.2 % in Poland to in excess of -20 % in each of the Baltic Member States – with Latvia recording a fall of 30.6 %.
Among service activities (at the NACE Rev. 2 division level), the fastest rate of turnover growth in the five-year period between 2004 and 2009 was for employment activities, where sales grew at an average rate of 7.1 % per annum, followed by air transport (6.8 % per annum). In contrast, there was a negative rate of change for motor trades (-0.7 % per annum) and almost no growth for cinema, video and TV production activities (0.1 % per annum). In 2009 (compared with the year before) the EU-27 turnover index fell for all six NACE Rev. 2 service sections covered by STS, ranging from a 3.2 % reduction for information and communication to losses of nearly 10 % for distributive trades and for transport and storage.
While the turnover index shows developments in current prices, the volume of retail sales indicates developments once price changes have been removed. The decline in the volume of retail sales in 2009 reached -1.7 % in the EU-27, following on from a relatively small increase of 0.2 % in 2008 (see Table 2). The fall in sales in 2009 was reported across most of the EU Member States: only six countries reported year on year growth, reaching 2 % or higher in Poland, Luxembourg and Austria. In contrast, the volume of retail sales index fell by 10 % or more in seven Member States, most notably in the three Baltic Member States with Latvia recording a fall of 28.0 %. A monthly series of the index shows the volume of retail sales peaked in the EU-27 in January 2008 and fell a total of 2.1 % through to August 2009, after which the index returned to positive rates of change. Throughout this period of decline, there was no significant reduction in the volume of retail sales index for textiles, clothing, footwear and leather in specialised stores, nor for the index for medical goods, cosmetics and toiletries, although in some periods the rate of change was around zero. In contrast, the volume of sales index for retailing of household equipment fell 6.6 % between February 2008 and May 2009, while the retailing of computers and telecommunications equipment recorded a decline of 2.3 % between April 2008 and January 2010. A similar decrease was recorded for the retailing of food, beverages and tobacco between August 2007 and February 2009, however, in this activity the index remained stable through to July 2010, recording 17 consecutive months of almost unchanged sales in volume terms.
Data sources and availability
Short-term business statistics (STS) on services are compiled within the same methodological framework as short-term statistics on industry and construction. The article on short-term developments in industry and construction provides information on: the STS Regulation; the different forms of presentation of indices, namely gross, working-day adjusted, seasonally adjusted, and trend; the implementation of NACE Rev. 2; and the exercise to rebase STS indices to a new base year of 2005=100.
The turnover index and the employment index are compiled for retail trade and for other services, and it is foreseen that the labour input indices concerning wages and salaries and hours worked will be provided for all of these services starting from the new base year to be introduced in 2013. For retail trade one additional indicator is provided, namely the volume index of retail sales, which is effectively a deflated turnover index. Furthermore, service output price indices have been developed for a selection of services in recent years.
The index of turnover shows the evolution of sales in value terms. Note that prices for some services have actually been falling, perhaps due to market liberalisation and increased competition (for example, telecommunications and other technology-related activities). In such cases, the rapid growth rates observed for turnover value indices for some activities would be even greater in volume terms.
The retail trade indices have particular importance because of the role of retail trade as an interface between producers and final customers, allowing retail sales turnover and volume of sales indices to be used as short-term indicators for final domestic demand by households. The volume measure of the retail trade turnover index is more commonly referred to as the index of the volume of (retail) sales. To eliminate the price effect on turnover in retail trade, a deflator of sales is used. This deflator is an index with a similar methodology to that of an output price index, but it is adapted specifically for retail trade; it reflects price changes in the goods sold rather than those in the retail sales service provided.
Context
Some of the most important STS indicators are a set of principal European economic indicators (PEEIs) that are essential to the European Central Bank (ECB) for conducting monetary policy within the euro area. Three PEEIs concern services short-term business statistics, namely indices covering: the volume of sales in retail trade, service turnover, and services producer prices.
Further Eurostat information
Publications
- European business – facts and figures – 2007 edition
- Quarterly panorama of European business statistics
- Key figures on European business – with a special feature section on SMEs
Main tables
- Trade and services - Services
- Trade and services - Retail
Database
- Trade and services
Dedicated section
Methodology / Metadata
- Short-term business statistics (ESMS metadata file - sts_esms)
Other information
- Evolution of service statistics – proceedings of the seminar on service statistics within short-term business statistics
- Glossary of business statistics
- Methodological guide for developing producer price indices for services
- Methodology of short-term business statistics – associated documents
- Methodology of short-term business statistics – interpretation and guidelines


