Data extracted in July 2024.
Planned article update: July 2025.
Highlights
This article presents the services producer price index (SPPI) (also called service output price index), measuring prices of services as calculated and used at the level of the European Union (EU) and its Member States. For the first time it presents a complete overview of price data for all service areas covered by the European Business Statistics Regulation.
General overview
The services producer price index is a business cycle indicator which provides information on the development of prices for basically all market service industries except financial and insurance services. This information is used for the analysis of inflation and its sources, but also for the deflation of value measures in the service sector.
This article presents services producer prices for all uses (B2All indicators), i.e. services consumed by private consumers, by business customers and others. However, a large number of the service industries covered by the indicator are those which are, as a matter of fact, mainly requested by businesses (B2B indicator, including also transaction with the Government/State, i.e. B2G), they include, for example, freight transport, legal and accounting services, advertising and market research.
Services producer prices - development since 2021
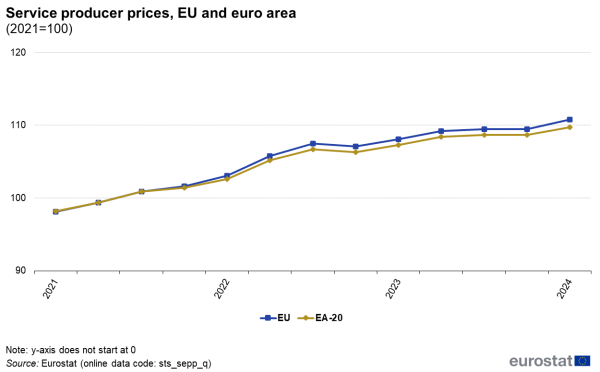
Figure 1 presents aggregated services producer prices for the EU and the euro area. The indicators combine all service areas for which services producer prices are collected under the European Business Statistics Regulation (EC) of 27 November 2019, i.e. transport services, hotel and accommodation services, real estate services, information communication, scientific and technical services and administrative and business support services.
Following their introduction in 2006, aggregated services producer prices showed a relatively steady increase. During the economic and financial crisis, prices fell between mid-2008 and mid-2009. In the years between 2010 and 2016, services producer prices remained almost stable. Around 2016, a more dynamic development started which was also not much affected by the Covid-19 crisis.
In 2021, and particularly in the first half of 2022, services producer prices increased relatively fast (more than 9% between the first quarter 2021 and the third quarter 2022). Since then, prices continued to increase although less dynamically.

Services producer prices – main aggregates
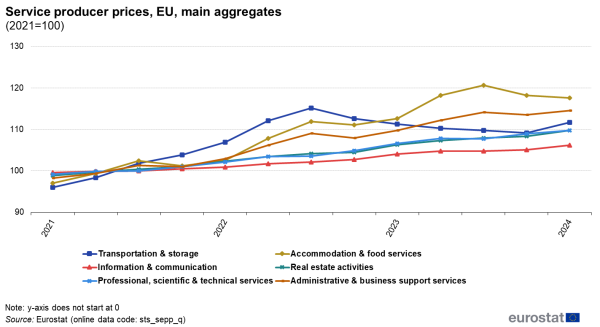
Figure 2 provides an overview of the recent development for the main services aggregates. The overall dynamic development of services producer prices was, in particular, the result of an increase in prices for transport services (notably in 2022) as well as prices for accommodation and food services (particularly in 2023). Prices for administrative and business support services also showed a relatively strong increase. The price for the other services industries – professional, scientific and technical services, real estate activities, and information and communication services – showed a steady but less strong development.
Transport services
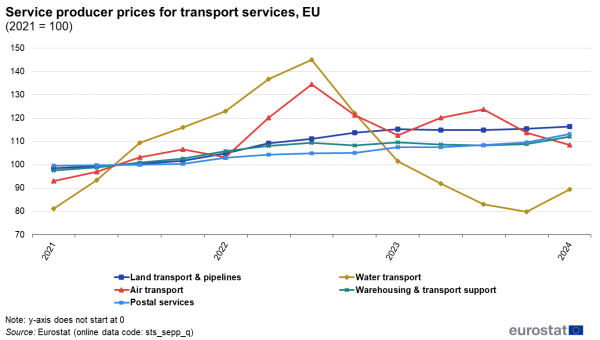
Figure 3 depicts the price development for various transport services as well as for postal services. Most of these services show a relatively steady but slow increasing trend. Air transport prices increased strongly in the first half of 2022 but dropped again in the following two quarters. In the first half of 2023, air transport prices went up again but not as dynamically as in 2022. Note that, unlike many other STS indices, price indices are not adjusted for seasonal effects and the air transport prices clearly follow a seasonal pattern.
Water transport prices increased by almost 80% between the first quarter of 2021 and the third quarter of 2022. Afterwards they dropped almost as quickly until the last quarter of 2023. Because of the comparatively large variations in water transport prices, and despite their relatively small share in the total STS service aggregate, the ups and downs in water transport prices can have a significant effect on the total services price level.
Accommodation and food services
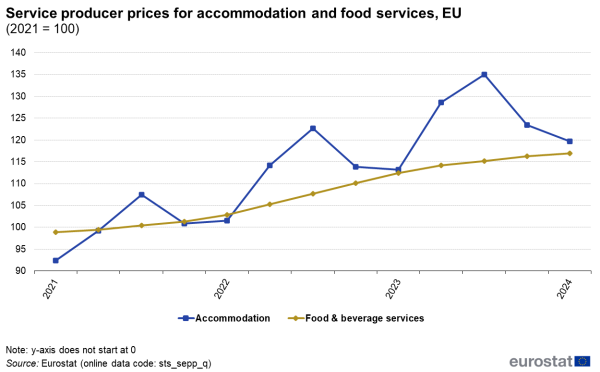
Prices for accommodation services have a clear seasonal pattern with increases in the first two quarters of the year, a drop in the third quarter and relative stability in the last quarter (Figure 4). The general trend for accommodation services (mainly hotels) has been clearly upwards during the recent years.
Prices for food services (mainly restaurants) followed a stable and steady upward trend.
Information and communications
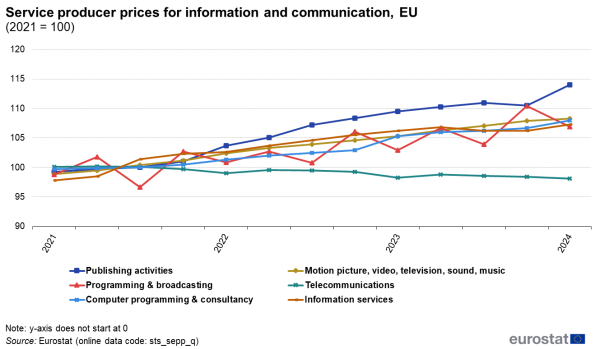
The most dynamic developments among the various communication services can be found for publishing services (up 11% between the first quarter 2021 and the third quarter of 2023). Recently these prices went down again (Figure 5). Prices for telecommunication services follow a long-term downward trend since 2006 which was also continued during the last years. Prices for various other communication services have increased relatively moderately since 2021.
Real estate activities
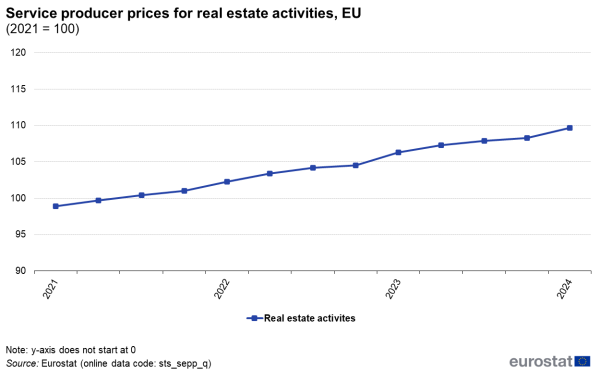
Prices for real estate services are presented for the first time in this publication. These prices show a very steady and continuous upward trend since 2021 (Figure 6).
Professional, scientific and technical services
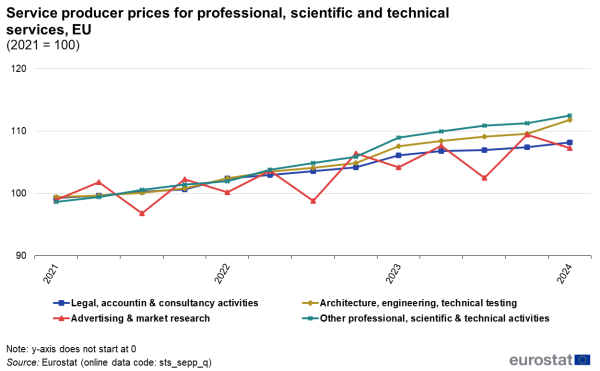
Professional, scientific and technical services have displayed a comparatively moderate yet steady increase since 2021 (Figure 7). With the exception of advertising and market research, these prices do not show a pronounced seasonal pattern.
Administrative and business support services
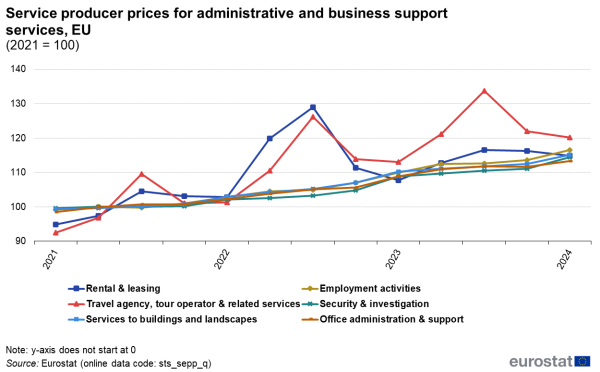
For many business services (Figure 8) prices have steadily increased over recent years, especially the prices for employment services and cleaning and landscaping services. Many of these services are not characterised by a pronounced seasonal pattern, and it can be assumed that many of these services are based on long-term contracts. The exceptions to this general trend are rental and leasing services as well as the services of travel agencies, tour operators and similar agents. Like accommodation services (see above) prices for these services tend to rise strongly during the first quarters of the year but then usually drop in the last quarter.
Member States
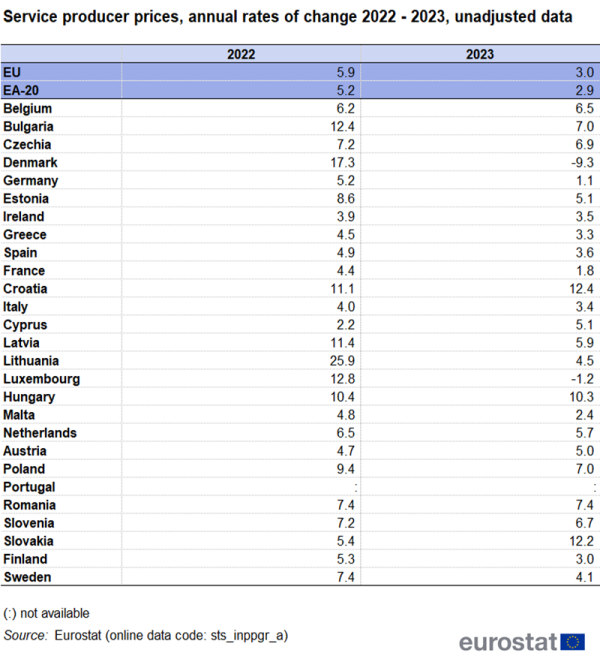
Table 1 provides an overview of the annual rates of change for total market services producer prices (excluding financial services) for the EU, the euro area and the EU countries. Prices increased rather strongly in 2022 and several EU countries experienced even double-digit growth rates. Often these price increases were due to higher prices for transport services. With the exception of Denmark and Luxembourg, where service producer prices decreased in 2023, the upward trend continued in 2023 but was less dynamic.
Source data for tables and graphs
Data sources
Information on producer prices of services is generally collected by business surveys. However, for some prices other sources are used, for example information from regulatory bodies for telecommunication prices or for legal services. Web surveys are also used to collect certain price information. The services price indices are calculated on a quarterly basis, selected data are available from 2006 on but the full set of services producer prices is only available as of 2021. The collection of price data for services poses a number of statistical problems due to the special nature of services. In particular, it is difficult to ascertain the quality of services and therefore difficult to collect price data for services of a comparable nature and quality over time. Measurement problems are also due to the fact that services are often consumed on production and that many services are unique and tailor-made for the client.
Producer prices (output prices) represent the prices from the point of view of the producer. The prices are transaction prices and take into account discounts, rebates, surcharges and similar price-determining elements but not product taxes. There are several important differences between producer prices and consumer prices, notably:
- Producer prices are calculated without VAT and similar taxes since they do not count as revenues from the point of view of the producer. Consumer prices include such taxes since the consumer has to pay them.
- Producer prices cover output produced by domestic producers – including output that is exported. Consumer prices include the prices of imported goods.
- An important use of producer prices is to deflate value data to produce information on real output. Consumer prices are used to deflate expenditure data.
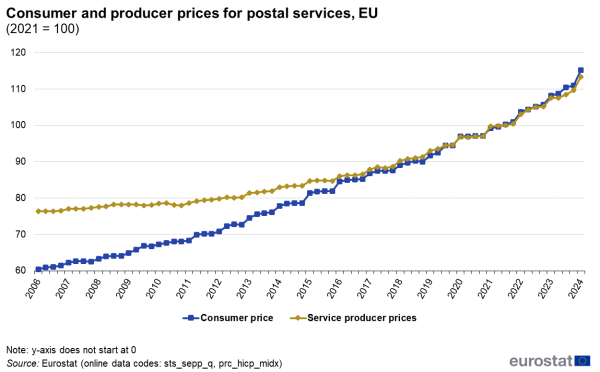
Figure 9 illustrates the difference between consumer and producer prices with the example of postal services.
Context
Services are an important part of European economies and contribute substantially to output and employment. Traditionally, short-term statistics mainly covered industrial and construction activities. When the monetary union was prepared it became clear that better and more complete data for the services sector were necessary. Regulation (EC) N0 1158/2005 of 6 July 2005 amended the short-term statistics regulation of 1998 (short-term statistics Regulation (EC) No 1165/98) and introduced the collection of output services prices on a quarterly basis. First data became available in 2009. The services output price index is today one of the Principal European Economic Indicators (PEEIs) which are used to monitor and steer economic policy in the EU and in the euro area.
Explore further
Other articles
Database
- Services (sts_os)
- Service producer prices (SPPI) (sts_os_pp)
Thematic section
Publications
- Service producer price indices (SPPI): a new European economic indicator - Statistics in focus 103/2008
Selected datasets
Methodology
- European Business Statistics Manual – 2021 edition
- European business statistics manual for short-term business statistics – 2021 edition
- Short-term business statistics - Metadata in SDMX format (ESMS metadata file — sts_esms)
- More information on Metadata in Eurostat
- Eurostat-OECD Methodological Guide for Developing Producer Price Indices for Services (2nd edition)
- Methodological guide for developing producer price indices for services
