Archive:Employment - quarterly statistics
Data extracted in January 2021
Planned article update: 30 April 2021
Highlights
The health crisis due to the COVID-19 pandemic has impacted employment in the European Union. In order to keep the negative consequences of the COVID-19 crisis on employment and businesses at bay, measures like short-time work or financial support to enterprises have been implemented in many EU Member States. However, employment was clearly impacted especially in the second quarter of 2020. Several factors might explain this: inflows into employment might have been reduced because enterprises might have slowed down, revised or cancelled their hiring process or might have decided to not renewing fixed-term contracts or probationary periods for example. These specific effects affecting directly young people were clearly visible during the second quarter of 2020 as further explained in this article. In addition, enterprises might have laid off employed people increasing outflows from employment. Consecutively, the third quarter of 2020 is characterised by the reduction of the containment measures in many countries and the subsequent upturn of activity. The fourth quarter of 2020 confirmed the increase recorded in the previous quarter even in the increase is more tempered.
This article focuses on the changes in employment observed during the crisis due to the COVID-19 pandemic based on the quarterly data from the European Union Labour Force Survey (EU-LFS). It shows the recent and long term developments as regards employment, mostly on a global European level, but also specifically according to gender, age and level of educational attainment. A specific analysis dedicated to the evolution of temporary contracts and part-time work.
Another article complements this article with a detailed analysis on the evolution of the employed population by occupation, sector of economic activity, age, level of educational attainment and professional status, by EU Member State. Both articles are part of the publication Labour market in the light of the COVID-19 pandemic. The current version of these articles focuses on the evolution of employment from the last quarter 2019 to the third quarter of 2020, i.e. from October-December 2019 to July-September 2020. In April 2021, they will be reviewed in order to include data on the fourth quarter of 2020.
Note: This article mainly uses seasonally adjusted data. Given that the adjustment model applies to the whole time series, figures released for previous quarters may have changed with the inclusion in the model of this last quarter (fourth quarter of 2020). Please also take note that figures presented in this article may differ in some cases from the source data due to continuous revision of the Eurostat database (Employment and unemployment (Labour Force Survey)).
Full article
Employment overview in 2020 in the EU and in the Member States
After the strongest decline ever recorded since 2000 (-1.4 p.p. from Q1 to Q2 2020), the employment rate rose by 0.6 p.p. in Q3 2020 and by 0.3 p.p. in Q4 2020
Since 2013, the share of employed people in the total EU population kept on growing from one quarter to the next until the third and the fourth quarter of 2019 (using seasonally adjusted data) when it remained stable and slightly decreased in the first quarter 2020 (-0.1 p.p.). However, from the first quarter of 2020 (Q1 2020) to the second quarter of 2020 (Q2 2020), the share of people in employment went down from 73.1 % to 71.7 % (-1.4 p.p.), recording the sharpest cut since 2000 (see Figure 1). From the second to the third quarter of 2020, the employment rate rose by 0.6 p.p., followed by an increase of 0.3 p.p. in the fourth quarter of 2020. These last increases do not compensate so far the decrease recorded in the second quarter of 2020.
An additional relevant finding concerns the labour force (also called the active population), which includes both employed and unemployed people: its share in the total population reached 78.2 % in Q4 2020, after a cut by 1.3 p.p. between Q1 and Q2 2020. Unlike employment, it therefore almost regained the same level as before the COVID-19 pandemic (the share of the labour force was 78.3 % in Q4 2019). This might be partly explained by the number of people who likely gave up their job search during Q2 2020 and so, did not fulfill the ILO criteria to be considered as unemployed, and consequently part of the labour force. However, those people started again to seek work in Q3 2020 and, therefore, reintegrated the labour force (being considered again as unemployed). More information on the impact of the COVID-19 pandemic on the unemployed population can be found in the article Key figures on the impact of the COVID-19 crisis on the labour market.
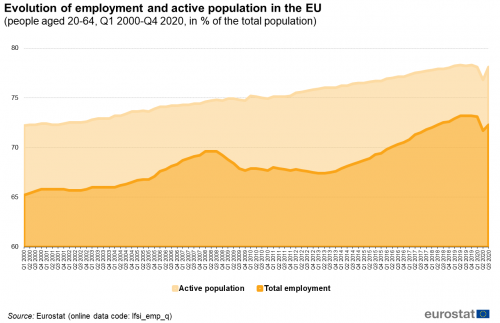
(people aged 20-64, Q1 2000 - Q4 2020, in % of the total population)
Source: Eurostat (lfsi_emp_q)
Lower employment rate in Q4 2020 compared to Q4 2019 in 23 out of 27 EU Member States
In order to provide an accurate picture of what happened in 2020 in terms of employment, Figure 2 presents the employment rate of people aged 20 to 64 in each quarter from the fourth quarter 2019 to the fourth quarter of 2020. This figure clearly shows that most countries were steeply affected during the second quarter of 2020. The employment rate in Spain, Ireland and Estonia fell by more than 3p.p. between the first and the second quarter of 2020, respectively by 4.2p.p., 4.0p.p. and 3.5p.p. which were the biggest quarter-on-quarter drops recorded in 2020. From Q2 to Q3 2020, the employment rate increased only in Luxembourg (+0.2p.p.).
Although the upturn recorded at the EU level between the second and the third quarter, the employment rate continued decreasing in 10 countries but to a lesser extent than seen in the previous quarter (all decreases were between -0.5p.p. and -0.1p.p.). This also means that at that time, the employment rate was stable or increased in the majority of countries. The most significant rebounds compared to the second quarter were found in Bulgaria and Spain (+1.6p.p.), Austria (+1.5p.p.), Ireland (+1.4p.p.) and France Metropolitan and France with respectively +1.1p.p. and +1.0p.p.
From the third to the fourth quarter of 2020, the employment rate increased in 18 out of 27 EU Member States, Luxembourg and Estonia registered the largest increases (+2.1p.p.) and (+1.2p.p.). The employment rate remained stable in four countries and slightly decreased in five, namely Hungary, Cyprus, Austria, Belgium and Slovakia with drops between -0.3p.p. and -0.1p.p.
In the fourth quarter of 2020, there were only four EU Member States that retrieved or even exceeded the level of the fourth quarter of 2019. This is actually the case of Poland (+0.9p.p. in Q4 2020 compared to Q4 2019), Luxembourg (+0.6p.p.), Malta (+0.5p.p.) and Greece (+0.1p.p.).
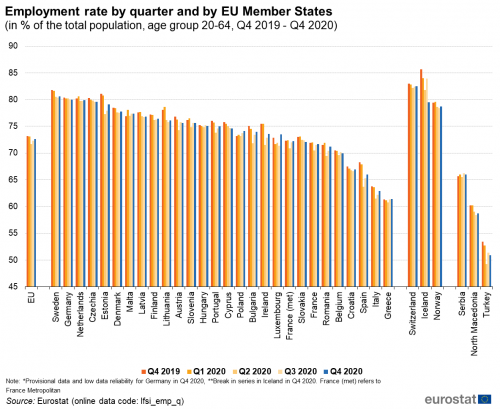
(in % of the total population, age group 20-64, Q4 2019 - Q4 2020)
Source: Eurostat (lfsi_emp_q)
The highest employment rates of people aged 20-64 in Q4 2020 were recorded in Sweden (80.6 %) and Germany (80.0 %) (see Figure 2). Please refer to the methodological note on German data related to all quarters of 2020 in the section "Data sources". By contrast, the lowest employment rates were reported in Greece (61.4 %), Italy (62.9 %), Spain (66.0 %), Croatia (66.9 %) and Belgium (69.9 %) where fewer than seven out of ten persons were employed in the fourth quarter of 2020. The employment gender gap amounted to 11.2p.p. in the EU in the last quarter of 2020: 78.2% of men were employed against 67.0% of women. Largest differences were reported by Italy (19.5p.p.), Romania (19.4 p.p.), Greece (18.5 p.p.) and Malta (18.0 p.p.). Among EU Member States, there was a strong contrast in the employment by gender as the gap was lower than 5p.p. in Lithuania, Finland, Latvia and Estonia.
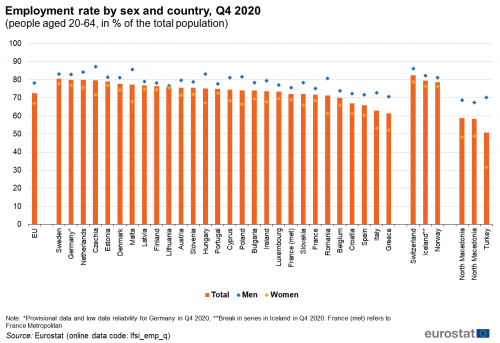
(people aged 20-64, in % of the total population)
Source: Eurostat (lfsi_emp_q)
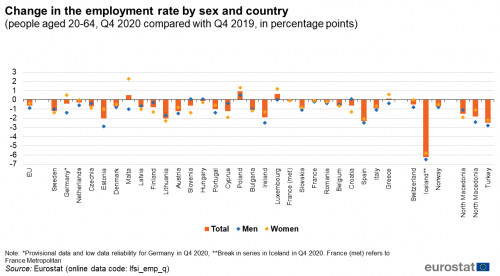
(people aged 20-64, Q3 2020 compared with Q4 2019, in percentage points)
Source: Eurostat (lfsi_emp_q)
Differences in the development of the employment rates of men and women between Q4 2019 and Q4 2020 are more or less pronounced across countries, and not systematically in favour of men or women, as displayed in Figure 4. Malta, Germany and Estonia reported the largest differences between men and women. In Malta, the employment rate of men decreased by 1p.p; while those of women went up by 2.3 p.p (gap of 3.3 p.p.). In Germany, the share of employed men fell by 1.4p.p. and increased by 0.5p.p. for women (gap of 1.9 p.p.) and in Estonia, the share of employed men decreased by 2.9 p.p. while it decreased by 1.0 p.p. for women (gap of 1.9 p.p.).
In Q4 2020 young people still far from their level of employment in Q4 2019
Employment rate of young people (aged 15-24) went down in all EU Member States between Q4 2019 and Q3 2020, except in Romania
In the European Union, employed people aged 15-24 accounted for 14.3 million people in the fourth quarter of 2020, which corresponds to 7.5 % of the total employed people aged 15-64. This proportion was 7.9 % a year earlier, in Q4 2019.
The employment rate in the EU among young people was 31.1% in Q4 2020 against 33.5% in Q4 2019 (-2.4p.p.). Among EU Member states, more than half young people were employed in the Netherlands (62.5%), Denmark (53.0%) and Austria (50.3%) but less than 20% in Bulgaria, Spain, Italy and Greece. In Ireland, Poland, Portugal and Malta, the employment rate of people aged 15 to 24 fell by more than 5p.p. respectively 6.3p.p. in Ireland and 5.4p.p. in the other three countries.
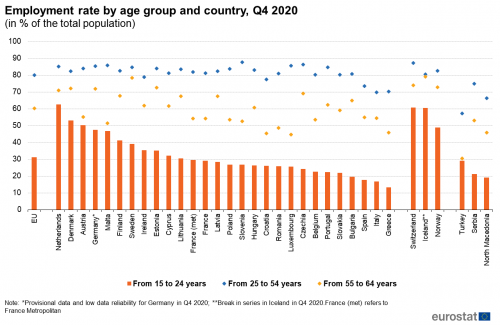
(in % of the total population)
Source: Eurostat (lfsi_emp_q)
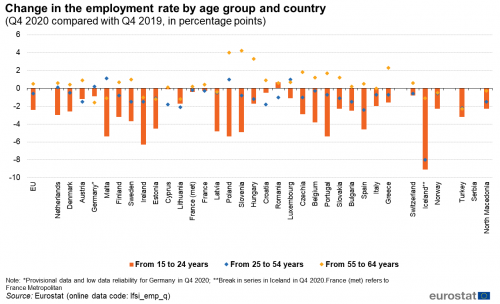
(Q4 2020 compared with Q4 2019, in percentage points)
Source: Eurostat (lfsi_emp_q)
Moreover, in the EU, eight out of ten persons aged between 25 and 54 (80.1 %) were employed in the fourth quarter of 2020 against 80.7% in the fourth quarter of 2019. This age category stood for 141.2 million people in Q4 2020. In Spain and Lithuania, the employment was more than 2p.p. lower in Q4 2020 compared to Q4 2019 as shown in Figure 6.
Employed people aged 55-64 stood for 36.2 million people in Q4 2020 in the EU. From Q4 2019 to Q4 2020, the share of employed people aged 55-64 increased by +0.5 p.p., reaching 60.2 % in Q4 2020. Among EU countries, the share of employed people increased 20 countries, remained stable in one and decreased in 6 countries. This share increased the most, by more than 2p.p. between the two quarters, in Slovenia (+4.2p.p.), Poland (+4.0p.p.), Hungary (+3.3p.p.) and Greece (2.3p.p.).
Disparate employment rates for men and women with low, medium and high educational attainment level
The employment evolution by sex and educational attainment level over the period Q1 2005 - Q4 2020 shows noticeable differences, both for men and women (aged 20-64), according to their level of educational attainment (see Figure 7). First, the employment rate of men with a high educational level (i.e. tertiary education) is always higher than the employment rate of men with a medium (i.e. at most upper secondary or post-secondary non-tertiary education) or low educational level (i.e. less than primary, primary or lower secondary education, at most). This was also the case for women. In the same way, people with a medium educational level are proportionately more employed than people with a low educational level. Finally, the lower the educational attainment level, the wider the gap between the employment rates of men and women.
Men and women with a high educational level follow roughly the same developments over time, and maintain a permanent gap between their respective employment rates. Nevertheless, the gender employment gap for people with a high educational level slightly narrowed over time: from 7.7 p.p. in Q1 2005, to 6.0 p.p. in Q4 2020.
In the fourth quarter of 2020, 87.4 % of men and 81.4 % of women with a high educational level were employed. Women with a high educational level were the ones for which the employment rate decreased the least between Q4 2019 and Q4 2020 (i.e. -0.6 p.p.), compared with men with high educational level (-1.0 p.p.) but also with men and women with medium and low educational level (see below).
Focusing on men and women with a medium level of educational attainment, the employment rate followed the same trend for men and women over the period Q1 2005 - Q4 2020, although fluctuations were sometimes slightly more pronounced for one gender than for the other. However, the employment rate of women with a medium educational level was never above or equal to the one of men. A gender employment gap was present over the whole period Q1 2005 - Q4 2020. It corresponded to 13.4 p.p. in Q1 2005, and reached 11.8 p.p. in Q4 2020. Almost eight out of ten men with a medium educational level (78.1 %) were employed against less than two thirds of women (66.3 %) in Q4 2020. For women, the drop between Q4 2019 and Q4 2020 was less sharp than for men (-1.0 for women against -1.3 p.p. for men).
With respect to people with a low level of educational attainment in employment, the employment rate of men with a low educational level corresponded to 65.8 % in Q4 2020. In other words, slightly less than two out of three men with a low level of educational attainment were employed in the fourth quarter of 2020. For women, the employment rate was 43.6 %, meaning that less than half of women with a low educational attainment level were employed. The gap between men and women was 25.9 p.p. in Q1 2005 but still amounted to 22.2 p.p. in Q4 2020.
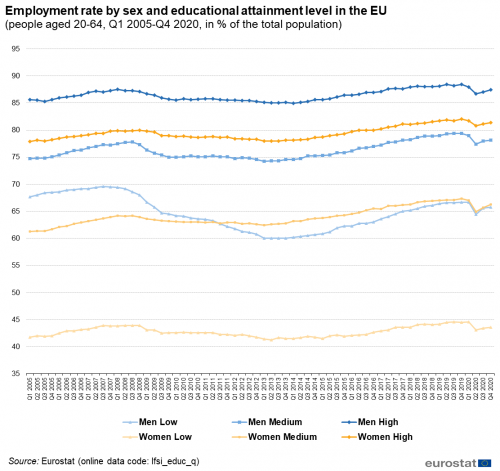
(people aged 20-64, Q1 2005 - Q4 2020, in % of the total population)
Source: Eurostat (lfsi_educ_q)
Temporary contracts and part-time employment lag behind
Cut of more than one temporary contract out of ten
Slightly more than one out of 10 employed persons in the EU-27 were employed under temporary contracts in Q3 2020, precisely 10.4 %, against 11.6 % in Q4 2019. From Q2 2013 to Q2 2017, temporary contracts had a slight positive trend, reaching 23.4 million people and accounting for 12.5 % of the total employment in Q2 2017. It remained stable between Q2 2017 and Q4 2017, but since then the temporary contracts in the total employment showed a slight downward trend and went down to 11.3 % in Q1 2020. Finally, the proportion of temporary contracts sharply fell to 10.3 % of the total employment in Q2 2020, to reach 10.4 % in Q3 2020, corresponding to 19.6 million persons (see Figure 9).
In the European Union, the number of employed people dropped by 3.0 million from the last quarter of 2019 to the third quarter of 2020. Specifically, the number of employed people with temporary contracts shrank by 2.6 million, falling from 22.2 to 19.6 million. This corresponds to a decrease of -11.8 %. The fall in temporary contracts accounted for 87.0 % of the total decrease in employment. This also contributed to emphasize the decline in youth employment. Indeed, in the third quarter of 2020, young people aged 15-24 accounted for 28.8 % of the total temporary contracts but for 7.5 % of the total employment among people aged 15-64. Reciprocally, 46.2 % in Q4 2019 and 42.9 % in Q3 2020 of employed young people had temporary contracts. This phenomenon, in addition to the expected decrease in hiring, might have strongly affected the youth employment (see detailed figures in the ![]() here also available under the section "Source data for tables and graphs" below).
here also available under the section "Source data for tables and graphs" below).
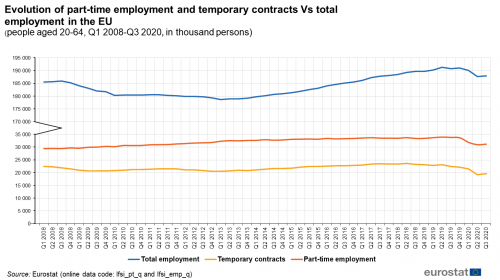
(people aged 20-64, Q1 2008 - Q3 2020, in thousand persons)
Source: Eurostat (lfsi_pt_q)
Among EU Member States for which data is available (all except Germany), Spain (19.7 %), Portugal (14.4 %) and Poland (14.1 %) registered the highest shares of temporary contracts in Q3 2020, each exceeding 14 % of the total employment (see Figure 10).
Between the last quarter of 2019 and the third quarter of 2020, 24 out of the 26 EU countries with available data registered a decrease in the share of temporary contracts in the total employment. At EU level, it decreased by -1.2 p.p. The proportion of temporary contracts faintly grew in Denmark (from 8.5 % to 8.7 %, +0.2 p.p.) as well as in Lithuania (from 0.9 % to 1.0 %, +0.1 p.p.). By contrast, the sharpest decreases were reported in Portugal (-2.8 p.p.), Poland (-2.1 p.p.) and Greece (-2.0 p.p.).
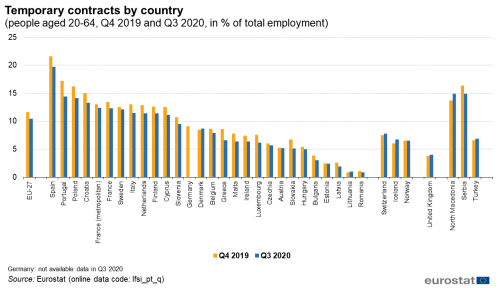
(people aged 20-64, Q4 2019 and Q3 2020, in % of total employment)
Source: Eurostat (lfsi_pt_q)
Fewer part-time workers in a majority of EU Member States
In the EU-27, 31.3 million people reported part-time employment in the third quarter of 2020, corresponding to 16.6 % of the total employment (see Figure 11). From Q1 2008 to Q1 2015, the overall upward trend of part-time employment is relatively smooth and continued: part-time employment accounted for 29.5 million people, corresponding to 15.9 % of the total employment, in the first quarter of 2008, and reached 33.2 million, corresponding to 18.3 % of the total employment, in the first quarter of 2015. From Q2 2015 onward, the proportion of part-time workers slightly decreased although the number of these workers itself might have increased.
Based on the 26 EU Member States for which data is available, the proportion of part-time workers in the total employment grew in eight countries, was stable in two and dropped in 16 countries between Q4 2019 and Q3 2020. The sharpest decreases were observed in Malta (-1.7 p.p.), Ireland (-1.3 p.p.) and Latvia (-1.1 p.p.). By contrast, the proportion of part-time workers in the total employment registered an increase of around 1 p.p. in Luxembourg (+1.3 p.p.), the Netherlands (0.9 p.p.) and Slovenia (+0.8 p.p.).
Another relevant aspect related to part-time employment is the underemployed part-time workers; these are persons working part-time, wishing to work additional hours and are available to do so. At EU level, underemployed part-time workers accounted for 3.1 % of the total employment in Q4 2019 and for 3.3 % in Q3 2020. Nevertheless, at country level, the share of underemployed part-time workers decreased by -0.5 p.p. or more in Malta and Greece, reaching 1.2 % and 5.4 % of the total employment respectively. By contrast, rises higher than +0.5 p.p. in the proportion of underemployed part-time workers in the total employment were observed in Slovenia (+0.7 p.p.) and in Austria, Italy and Sweden (all three, +0.6 p.p.).
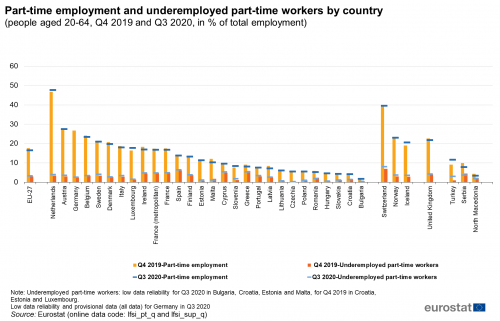
(people aged 20-64, Q4 2019 and Q3 2020, in % of total employment)
Source: Eurostat (lfsi_pt_q) and (lfsi_sup_q)
Source data for tables and graphs
Data sources
All figures in this article are based on seasonally adjusted quarterly results from the European Union Labour Force Survey (EU-LFS).
Source: The European Union Labour Force Survey (EU-LFS) is the largest European household sample survey providing quarterly and annual results on labour participation of people aged 15 and over as well as on persons outside the labour force. It covers residents in private households. Conscripts in military or community service are not included in the results. The EU-LFS is based on the same target populations and uses the same definitions in all countries, which means that the results are comparable between countries.
European aggregates: EU refers to the sum of the 27 EU Member States.
Country note: In Germany, from the first quarter of 2020 onwards, the Labour Force Survey (LFS) is part of a new system of integrated household surveys. Unfortunately, technical issues and the COVID-19 crisis has had a large impact on data collection processes, resulting in low response rates and a biased sample. For this reason, additional data from other integrated household surveys has been used in addition to the LFS subsample, to estimate a restricted set of indicators for the first three quarters of 2020, for the production of LFS Main Indicators. These estimates have been used for the publication of German results, but also in the calculation of EU and EA aggregates. By contrast, EU and EA aggregates published in the Detailed quarterly results (showing more and different breakdowns than the LFS Main Indicators) have been computed using only available data from the LFS subsample. As a consequence, small differences in the EU and EA aggregates in tables from both collections may be observed. For more information, see here.
Definitions: The concepts and definitions used in the Labour Force Survey follow the guidelines of the International Labour Organisation.
Five different articles on detailed technical and methodological information are linked from the overview page of the online publication EU Labour Force Survey.
Context
The COVID-19 health crisis hit Europe in January and February 2020, with the first cases confirmed in Spain, France and Italy. COVID-19 infections have now been diagnosed in all European Union (EU) Member States. To fight the pandemic, EU Member States have taken a wide variety of measures. From the second week of March, most countries closed retail shops apart from supermarkets, pharmacies and banks. Bars, restaurants and hotels have also been closed. In Italy and Spain, non-essential production was stopped and several countries imposed regional or even national lock-down measures which further stifled the economic activities in many areas. In addition, schools were closed, public events were cancelled and private gatherings (with numbers of persons varying from 2 to 50) were banned in most Member States.
The large majority of the prevention measures were taken during mid-March 2020 and most of the prevention measures and restrictions were kept for the whole of April and May 2020. The second quarter of 2020 is consequently the quarter in which the labour market across the EU has been strongly affected by COVID-19 measures taken by the Member States.
Employment and unemployment as defined by the ILO concept are, in this particular situation, not sufficient to describe the developments taking place in the labour market. In this first phase of the crisis, active measures to contain employment losses led to absences from work rather than dismissals, and individuals could not search for work or were not available due to the containment measures, thus not counting as unemployed.
The quarterly data on employment will allow along the quarters to report on the impact of the crisis due to the COVID-19 pandemic on employment. This specific article focuses on the age and the level of education attainment of employed people in order to determine potential categories more or less affected by the economic downturn. It also shows the evolution of part-time employment and temporary contracts. Another article on the evolution of employment by activity and professional status is also available in the context of the publication Labour market in the light of the COVID-19 pandemic.
Direct access to
- All articles on employment
- Labour market in the light of the COVID 19 pandemic - quarterly statistics
- Employment rates – annual statistics
- Job vacancy statistics
- Labour market statistics at regional level
- People outside the labour force
- The EU in the world - labour market
- Labour market slack – annual statistics on unmet needs for employment
- LFS main indicators (t_lfsi)
- Population, activity and inactivity - LFS adjusted series (t_lfsi_act)
- Employment - LFS adjusted series (t_lfsi_emp)
- Unemployment - LFS adjusted series (t_une)
- LFS series - Detailed annual survey results (t_lfsa)
- LFS series - Specific topics (t_lfst)
- LFS main indicators (lfsi)
- Employment and activity - LFS adjusted series (lfsi_emp)
- Unemployment - LFS adjusted series (une)
- Labour market transitions - LFS longitudinal data (lfsi_long)
- LFS series - Detailed quarterly survey results (from 1998 onwards) (lfsq)
- LFS series - Detailed annual survey results (lfsa)
- LFS series - Specific topics (lfst)
- LFS ad-hoc modules (lfso)
Publications
- EU labour force survey — online publication
- Labour Force Survey in the EU, candidate and EFTA countries — Main characteristics of national surveys, 2017, 2018 edition
- Quality Report of the European Union Labour Force Survey 2017, 2019 edition
ESMS metadata files and EU-LFS methodology
- Employment and unemployment (Labour Force Survey) (ESMS metadata file — employ_esms)
- Employment growth and activity branches - annual averages (ESMS metadata file — lfsi_grt_a_esms)
- LFS ad-hoc modules (ESMS metadata file — lfso_esms)
- LFS main indicators (ESMS metadata file — lfsi_esms)
- LFS series - Detailed annual survey results (ESMS metadata file — lfsa_esms)
- LFS series - detailed quarterly survey results (from 1998 onwards) (ESMS metadata file — lfsq_esms)
