Archive:Extra-EU trade in primary goods
Data from April 20201
Planned update April 2022Highlights
Due to the Covid-19 pandemic, exports of primary goods fell by EUR 37 billion and imports by EUR 146 billion in 2020.
EU trade in primary goods, 2002 - 2020
This article focuses on the structure and evolution of the European Union (EU) international trade in primary goods: imports and exports at EU level. Primary goods, also called commodities, are goods sold for production or consumption just as they were found in nature; they include crude oil, coal, iron, and agricultural products like wheat or cotton.
This article is part of an online publication providing recent statistics on international trade in goods, covering information on the EU's main partners, main products traded, specific characteristics of trade as well as background information.
Full article
EU is a net importer of primary goods
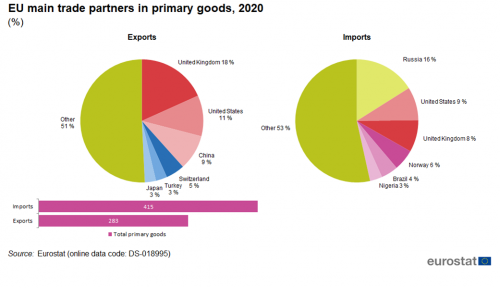
In 2020 the main partner for EU exports of primary goods was the United Kingdom (18 %) followed by the United States (11 %) and China (9 %), see Figure 1. Russia (16 %) was the largest origin of EU imports of primary goods followed at some distance by the United States (9 %) and the United Kingdom (8 %).
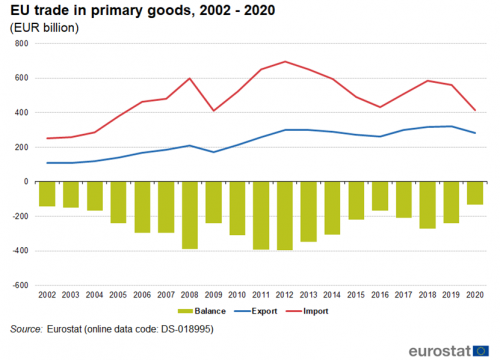
In 2020 the EU exported EUR 283 billion of primary goods to, and imported EUR 415 billion of primary goods from countries outside the EU (see Figure 2). Due to a combination of declining prices and the Covid-19 pandemic this was much lower than the year before. Compared with 2019, exports decreased by EUR 37 billion and imports decreased by EUR 146 billion. Thus the trade deficit was reduced by EUR 109 billion from EUR 241 billion in 2019 to EUR 132 billion in 2020.
The share of primary products in total extra EU exports was 14 % in 2009 and peaked at 17 % in 2012 and 2013. Between 2017 to 2020 it was stable at 15 % (see Figure 3). In contrast, there was more fluctuation of the share of primary products in total extra EU imports. It was 27 % in 2002, peaking at 41 % in 2012 and had a minimum of 24 % in 2020. These fluctuations are partly related to changing prices of primary goods.
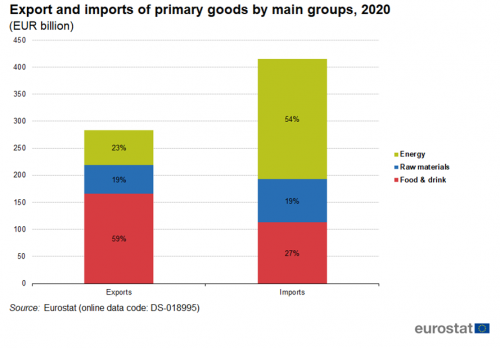
Exports of primary products consisted of 59 % of food & drink, followed by 23 % of energy and 19 % of raw materials (see Figure 4) in 2020. In imports of primary products the share for energy was 54 %, followed by 27 % for food & drink and 19 % for raw materials.
The remainder of the article will look at the development and the top trading partners of the EU in the three groups distinguished in primary goods: food & drink, raw materials and energy products.
Food and drink: the United Kingdom main partner for EU trade
Product group ‘food and drink’ (SITC Sections 0 and 1) includes agricultural products such as food and live animals, beverages and tobacco.
Trade in food & drink grew rapidly since 2002, especially between 2009 and 2012, with exports growing stronger than imports (see Figure 5). The Covid-19 pandemic had little influence on trade in food & drink in 2020. Imports fell by only EUR 5 billion while exports increased by EUR 3 billion. Consequently the trade balance increased by EUR 8 billion from EUR 45 billion in 2019 to EUR 53 billion in 2020.
The United Kingdom (23 %) was the main destination for EU exports of food & drink in 2020. Its share for exports was more than twice as much as that of the United States (11 %) and China (10 %). The United Kingdom (14 %) was also the largest origin for imports of food & drink, well ahead of Brazil (7 %) the United States and Norway (both 6 %).
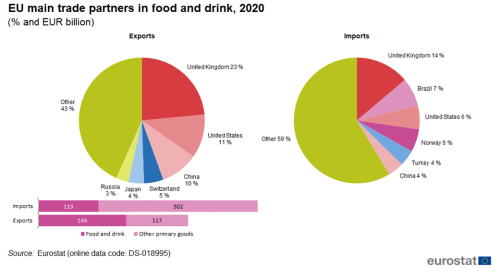
(% and EUR billion)
Source: Eurostat (TET00034)
More details on trade in food & drink can be found in this article on agricultural goods.
Raw materials: EU imports most from the United States and Brazil
Raw materials (SITC Sections 2 and 4) include non-manufactured goods like oilseeds, cork, wood, pulp, textile fibres, ores and other minerals as well as animal and vegetable oils.
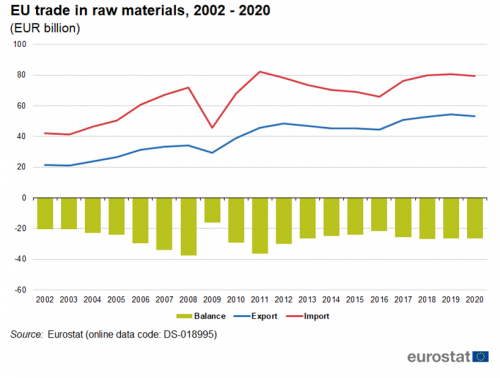
The EU had an ongoing trade deficit in raw materials (see Figure 7). Both imports (EUR 46 billion) and exports (EUR 30 billion) were at a low in 2009 and after an initial recovery started to decline until 2016. After that they increased again and both exports (EUR 54 billion) and imports (EUR 81 billion) peaked in 2019. Both fell by EUR 1 billion in 2020, leaving the trade deficit at EUR 26 billion. Similar to food & drink the Covid-19 pandemic had little influence on trade in raw materials.
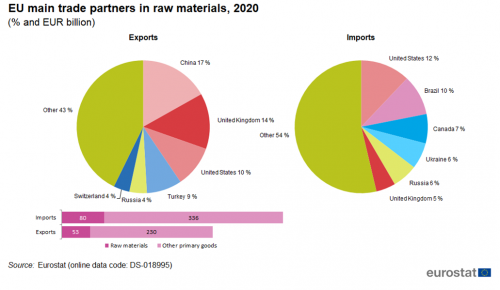
China, with 17 %, was the largest export destination of raw materials from the EU, followed by the United Kingdom with 14 % (see Figure 8). EU imports of raw materials came mainly from the United States and Brazil with 12 % and 10 % respectively.
More details on trade in raw materials can be found in this article on raw materials.
Energy products: Russia main partner for EU imports of energy
The main goods of energy products (SITC Section 3) are crude oil, refined petroleum products, coal, gas and electric current.
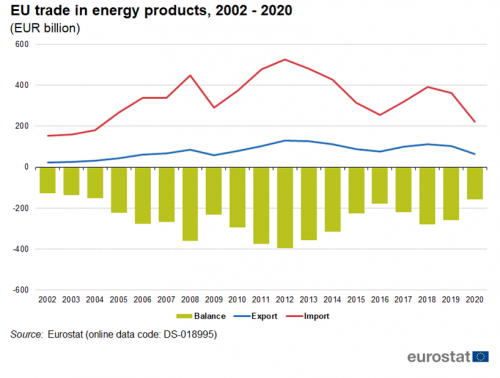
The EU is dependent on imports of energy products. This has led to a structural trade deficit, which reached a record level of EUR 395 billion in 2012 (see Figure 9). The value of imports closely followed the price of crude oil which explains the decline of the trade deficit between 2012 and 2016 when it reached EUR 179 billion. Due to the Covid-19 pandemic both imports and exports of energy products fell drastically. Between 2019 and 2020, imports dropped from EUR 103 billion to EUR 64 billion and exports dropped from EUR 363 billion to EUR 223 billion. This reduced the trade deficit from EUR 260 billion in 2019 to EUR 159 billion in 2020.
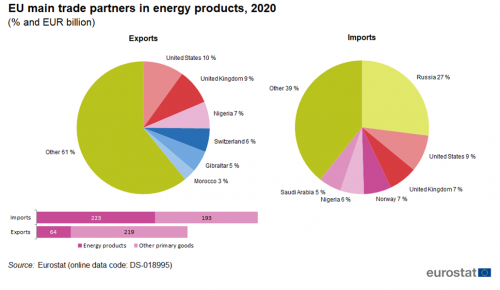
In 2020, the major provider for EU imports of energy was Russia (27 % of the imports in 2020) followed by the United States (9 %). The United States (10 %) and the United Kingdom (9 %) were the main destinations of EU exports of energy.
More details on trade in energy can be found in this article on EU imports of energy products.
Source data for tables and graphs
Data sources
The Standard international trade classification (SITC) distinguishes five main categories (sections) of primary goods:
- food and live animals (SITC 0 );
- beverages and tobacco (SITC 1);
- crude materials, excluding fuels (SITC 2);
- mineral fuels (SITC 3);
- animal and vegetable oils, fats and waxes (SITC 4).
Sections 0 and 1 are often grouped together as 'food and drink', 2 and 4 as 'raw materials'.
Data sources
EU data come from Eurostat’s COMEXT database. COMEXT is the Eurostat reference database for international trade. It provides access not only to both recent and historical data from the EU Member States but also to statistics of a significant number of third countries. International trade aggregated and detailed statistics disseminated from Eurostat website are compiled from COMEXT data according to a monthly process. Because COMEXT is updated on a daily basis, data published on the website may differ from data stored in COMEXT in case of recent revisions.
EU data are compiled according to community guidelines and may, therefore, differ from national data published by Member States. Statistics on extra-EU trade are calculated as the sum of trade of each of the 27 Member States with countries outside the EU. In other words, the EU is considered as a single trading entity and trade flows are measured into and out of the area, but not among Member States within it the EU.
The United Kingdom is considered as an extra-EU partner country for the EU for the whole period covered by this article. However, the United Kingdom was still part of the internal market until the end of the transitory period (31 December 2020), meaning that data on trade with the United Kingdom are still based on statistical concepts applicable to trade between the EU Member States. Consequently, while imports from any other extra-EU trade partner are grouped by country of origin, the United Kingdom data reflect the country of consignment. In practice this means that the goods imported by the EU from the United Kingdom were physically transported from the United Kingdom but part of these goods could have been of other origin than the United Kingdom. For this reason, data on trade with the United Kingdom are not fully comparable with data on trade with other extra-EU trade partners.
Unit of measure
Trade values are expressed in billions (109) of euros. They correspond to the statistical value, i.e. to the amount which would be invoiced in case of sale or purchase at the national border of the reporting country. It is called a FOB value (free on board) for exports and a CIF value (cost, insurance, freight) for imports.
Context
Primary goods belong to three categories of products: agricultural products, raw materials and energy. The EU is the world’s foremost trader in agricultural products. Europe imports mostly basic agricultural commodities, but its exports are based on high-quality farm products and other processed agricultural products. Recognising the crucial role that agriculture plays in many developing countries, the EU has granted extensive market access to agricultural imports from developing countries. The European Union, due to the characteristics of the European industrial base, is highly dependent on imports of raw materials for its competitiveness and for its economic development. An increase in worldwide demand in raw materials in the future is expected; this increase will be largely due to economic growth in emerging economies. The European Union is also dependent on imports of energy from other countries. One of the key priorities is therefore to run a strategic international energy policy which leads to stable and secure supply routes.
Direct access to
- International trade data (t_ext)
- International trade long-term indicators (t_ext_lti)
- International trade short-term indicators (t_ext_sti)
- International trade data (ext)
- International trade long-term indicators (ext_lti)
- International trade short-term indicators (ext_sti)
- International trade detailed data (detail)
- International trade in goods statistics - background
- International trade in goods (ESMS metadata file — ext_go_agg_esms)
- User guide on European statistics on international trade in goods
- Regulation (EC) No 471/2009 of 6 May 2009 on Community statistics relating to external trade with non-member countries
- Summaries of EU Legislation: Extrastat: statistics relating to trade with non-EU countries
- Regulation (EU) No 92/2010 of 2 February 2010 implementing Regulation (EC) No 471/2009, as regards data exchange between customs authorities and national statistical authorities, compilation of statistics and quality assessment
- Regulation (EU) No 113/2010 of 9 February 2010 implementing Regulation (EC) No 471/2009 , as regards trade coverage, definition of the data, compilation of statistics on trade by business characteristics and by invoicing currency, and specific goods or movements.
