Archive:Impact of COVID-19 on international trade by Member State
Data extracted in March 2021.
Planned article update: March 2022.
Highlights
For EU Imports and exports of goods, the second quarter in 2020 was the quarter most affected by the COVID-19 crisis, compared with 2019.
EU imports and exports of goods in the third and fourth quarter of 2020 increased compared with the previous quarter.

To help prevent the spread of the COVID-19 pandemic, countries around the world have taken a variety of restrictive measures which have negatively affected international trade in goods. This article is part of an online publication containing articles on the Impact of COVID-19 on international trade in goods statistics. In this article, the impact by Member State is presented. To ensure comparability over time, seasonally and working-day adjusted data are used.
Full article
Comparison with the previous year
Figure 1 shows the decline in extra EU trade due to restrictive measures taken relating to the COVID-19 virus. The drop in exports between February and April 2020 was larger than the drop in imports, leading to a trade deficit in April 2020. Exports recovered somewhat stronger than imports, creating an increasing surplus in the following months. However, neither imports nor exports had reached pre-crisis levels in December 2020.
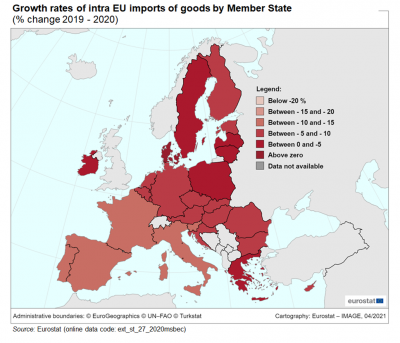
Maps 1 to 4 show the growth rates of both intra-EU and extra-EU imports and exports, comparing 2020 with 2019. With very few exceptions, imports and exports decreased between 0 and 20 %.
There were 21 Member States whose extra EU imports fell between 0 and 20 %. The most frequent range was between -10 % and - 15 % (8 Member States). In four Member States imports decreased more than 20 %. These were Luxembourg (- 43 %), Malta (- 33 %), Greece (- 23 %) and Lithuania (- 21 %). Imports increased only in Slovenia (+1 %) and Croatia (+ 2 %).
There were 23 Member States whose extra EU exports fell between 0 and 20 %. The most frequent range was between -5 % and - 10 % (9 Member States). In three Member States exports decreased more than 15 %. These were France, Luxembourg (both - 20 %) and Greece (- 19 %). Exports increased only in Slovenia (+ 12 %) , Estonia (+ 6 %) and very slightly in Latvia (+ 0.05 %).
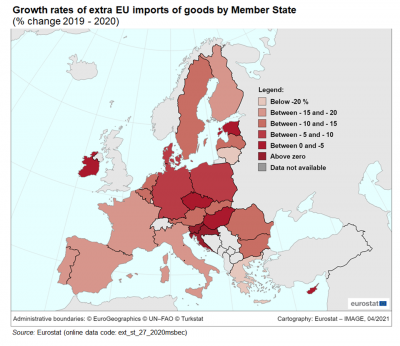
Map 1: Growth rates of extra EU imports of goods by Member State
(% change 2019 - 2020)
Source: Eurostat (ext_st_27_2020msbec)
Map 2: Growth rates of extra EU exports of goods by Member State
(% change 2019 - 2020)
Source: Eurostat (ext_st_27_2020msbec)


There were 25 Member States whose intra EU imports fell between 0 and 20 %. The most frequent range was between -5 % and - 10 % (14 Member States). Only in Malta did imports decrease more than 20 %. Denmark was the only Member State with a small increase of intra EU imports (+ 0.12 %).
There were 24 Member States whose intra EU exports fell between 0 and 20 %. The most frequent range was between -5 % and - 10 % (13 Member States). In Cyprus (-30 %) and Malta (- 21 %) exports decreased more than 15 %. Exports increased only in Ireland (+ 13 %) and very slightly in Latvia (+ 0.38 %).
Map 3: Growth rates of extra EU imports of goods by Member State
(% change 2019 - 2020)
Source: Eurostat (ext_st_27_2020msbec)
Map 4: Growth rates of extra EU exports of goods by Member State
(% change 2019 - 2020)
Source: Eurostat (ext_st_27_2020msbec)


Comparison with the same quarter previous year
Tables 1 and 2 compare the total (meaning intra and extra EU) imports and exports by quarter in 2020 to the same quarter in 2019.
With the exception of Malta, for all Member States the second quarter had the largest decrease of imports when comparing 2020 to 2019. The third quarter also saw the imports of all Member States decrease. In the fourth quarter of 2020 the imports of nine Member States increased compared to 2019. Of the remaining 18, ten had decreases of more than 5 %, most notably in Malta (-24 %).

(% change compared to the same quarter previous year)
Source: Eurostat (ext_st_27_2020msbec)
With the exception of Cyprus and Luxembourg, for all Member States the second quarter had the largest decrease of exports when comparing 2020 to 2019. The third quarter saw decreases for 22 Member States. The exceptions were Ireland, Slovakia, Poland, Latvia and Estonia. In the fourth quarter of 2020 the imports of eleven Member States increased compared to 2019, most notably in Estonia (+ 13 %). Of the remaining 16, four had decreases of more than 5 %, These were Bulgaria (- 6 %), Denmark (-7 %), France (- 9 %) and Cyprus (- 15 %).

(% change compared to the same quarter previous year)
Source: Eurostat (ext_st_27_2020msbec)
Comparison with the previous quarter
With the exception of Malta, for all Member States the second quarter of 2020 had the largest decrease of imports compared to the previous quarter. The third quarter of 2020 saw the imports of all Member States increase as did the fourth quarter of 2020 except in Finland, Luxembourg and Malta.

Source: Eurostat (ext_st_27_2020msbec)
With the exception of Cyprus and Luxembourg, for all Member States the second quarter of 2020 had the largest decrease of exports compared to the previous quarter. The third quarter of 2020 saw the exports of all Member States increase except in Cyprus. In the fourth quarter of 2020 exports increased for all Member States except Luxembourg and Ireland. In Romania, Czechia and Estonia there were double digit increases in both the third and fourth quarter of 2020.
Source: Eurostat (ext_st_27_2020msbec)
Source data for tables and graphs
Data sources
EU data is taken from Eurostat's COMEXT database. COMEXT is the reference database for international trade in goods. It provides access not only to both recent and historical data from the EU Member States but also to statistics of a significant number of third countries. International trade aggregated and detailed statistics disseminated via the Eurostat website are compiled from COMEXT data according to a monthly process.
Data are collected by the competent national authorities of the Member States and compiled according to a harmonised methodology established by EU regulations before transmission to Eurostat. For extra-EU trade, the statistical information is mainly provided by the traders on the basis of customs declarations.
EU data are compiled according to Community guidelines and may, therefore, differ from national data published by the Member States. Statistics on extra-EU trade are calculated as the sum of trade of each of the 27 EU Member States with countries outside the EU. In other words, the EU is considered as a single trading entity and trade flows are measured into and out of the area, but not within it.
The EU-27 data reflect the political change in the EU composition. Therefore, the United Kingdom is considered as an extra-EU partner country for the EU-27. However, the United Kingdom is still part of the internal market until the end of the transitory period, meaning that data on trade with the United Kingdom are still based on statistical concepts applicable to trade between the EU Member States. As a consequence, while imports from any other extra-EU-27 trade partner are grouped by country of origin, the United Kingdom data reflect country of consignment. In practice this means that the goods imported by the EU-27 from the United Kingdom were physically transported from the United Kingdom but part of these goods could have been of other origin than the United Kingdom. For this reason data on trade with the United Kingdom are not fully comparable with data on trade with other extra-EU-27 trade partners.
Methodology
In this article some products are classified as COVID-19 related products. They are compared over time and across countries, and also with products in the same chapter of the Harmonised System (HS) product classification, i.e. they are compared with other similar products that are however not directly used in response to the COVID-19 pandemic. It should be noted that most COVID-19 related products cannot be precisely identified and they are grouped together with products not specific to COVID-19. Nevertheless, some trends can be observed.
According to the EU concepts and definitions, extra-EU trade statistics (trade between EU Member States and non-EU countries) do not record exchanges involving goods in transit, placed in a customs warehouse or given temporary admission (for trade fairs, temporary exhibitions, tests, etc.). This is known as ‘special trade’. The partner is the country of final destination of the goods for exports and the country of origin for imports.
Unit of measure
Trade values are expressed in millions or billions (109) of euros. They correspond to the statistical value, i.e. to the amount which would be invoiced in the event of sale or purchase at the national border of the reporting country. It is called a FOB value (free on board) for exports and a CIF value (cost, insurance, freight) for imports.
Context
Trade is an important indicator of Europe’s prosperity and place in the world. The bloc is deeply integrated into global markets both for the products it sources and the exports it sells. The EU trade policy is an important element of the external dimension of the ‘Europe 2020 strategy for smart, sustainable and inclusive growth’ and is one of the main pillars of the EU’s relations with the rest of the world.
Because the 27 EU Member States share a single market and a single external border, they also have a single trade policy. EU Member States speak and negotiate collectively, both in the World Trade Organization, where the rules of international trade are agreed and enforced, and with individual trading partners. This common policy enables them to speak with one voice in trade negotiations, maximising their impact in such negotiations. This is even more important in a globalised world in which economies tend to cluster together in regional groups.
The openness of the EU’s trade regime has meant that the EU is the biggest player on the global trading scene and remains a good region to do business with. Thanks to the ease of modern transport and communications, it is now easier to produce, buy and sell goods around the world which gives European companies of every size the potential to trade outside Europe.
Direct access to
- International trade in goods (t_ext_go), see:
- International trade in goods - long-term indicators (t_ext_go_lti)
- International trade in goods - short-term indicators (t_ext_go_sti)
- International trade in goods (ext_go), see:
- International trade in goods - aggregated data (ext_go_agg)
- International trade in goods - long-term indicators (ext_go_lti)
- International trade in goods - short-term indicators (ext_go_sti)
- International trade in goods - detailed data (detail)
- EU trade since 1988 by SITC (DS-018995)
- International trade in goods statistics - background
- International trade in goods (ESMS metadata file — ext_go_esms)
- User guide on European statistics on international trade in goods