Archive:Statistics on regional population projections
Data from March 2021
No planned update date
<highlight>
The EU population is projected to decrease by 1.3 % between 2019 and 2050.

(%)
Source: Eurostat (proj_19np) and (proj_19rp3)
This article describes the results of the latest population projections of regional demographic patterns across 31 countries (27 European Union (EU) and four European Free Trade Association (EFTA) Member States). It presents a concise summary of the results for regions NUTS level 3 used on the latest European Population Projections 2019-based — EUROPOP2019.
These regional population projections cover a time horizon that reaches the end of the century, the results here presented refer to the year 2050; the projections were based on population and vital events data up to 2018 and used the NUTS-2016 classification, according which the territories of the 31 countries are divided in 1 216 geographical units NUTS level 3. For sake of simplicity, unless otherwise specified, by “EU+” it is here meant the entire set of 31 countries, thus including the four EFTA Member States (Iceland, Liechtenstein, Norway, and Switzerland). For a presentation of the EUROPOP2019 data at national level, please refer to the article on Population projections in the EU.
All the results here presented should be understood as one of the possible outcomes of a hypothetical scenario of partial convergence across regions. Therefore, each result should ideally be read as preceded by the sentence “according to a scenario of convergence,…”.
Full article
Projected changes in regional populations
Compared with the 508.5 million population of the EU-28 on 1 January 2015, Europop2013 population projections indicate that the EU-28’s population would grow slowly (by 3.4 % overall) to reach a peak of 525.6 million in 2048, with the number of inhabitants increasing by 17.1 million persons. The EU-28’s population is then projected to fall slightly to 525.5 million by 2050, which is the end of the period studied in this article.
The size of a population changes in a dynamic fashion over time, as a function of three demographic factors: births, deaths and migratory flows, each of which shapes the population’s structure over time. The main outcome of the current low levels of fertility and mortality in the EU is a progressive ageing of the population.
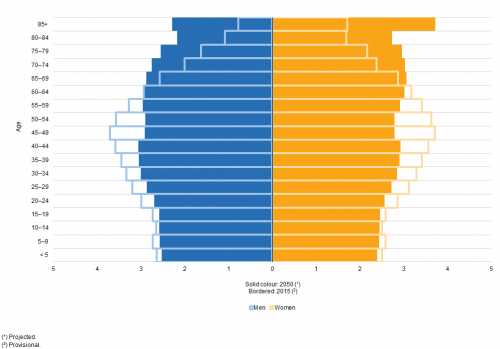
Projected changes in the EU-28’s population structure can be seen in Figure 1, which superimposes the 2015 population pyramid on the projected one for 2050. The differences between these pyramids show the projected changes in the composition of the EU-28’s population, namely, that:
- the already low number of births is projected to continue, as the base of the pyramid will remain relatively unchanged, indicating that there will be little or no natural population growth;
- the working-age population is projected to shrink considerably between 2015 and 2050, thus further increasing the burden on those of working-age to sustain the dependent population;
- the proportion of elderly persons is projected to grow much larger — as shown by the broadening at the top of the pyramid — reflecting the ageing of the EU’s population as a result of reduced mortality rates;
- the number of women aged 85 and over is projected to be considerably higher than the number of men in the same age range.
The 2015 population pyramid bulges in the middle years, with this most noticeable in the age group 45–49, a cohort who were born in the second half of the 1960s. These people will, in the coming years, gradually move into retirement, while there are fewer persons of working-age in the generations that follow.
(% of the total population)
Source: Eurostat (demo_pjangroup) and (proj_13npms)
A few demographic indicators illustrate this projected ageing of the population. The median age of the EU-28’s population was 42.4 years on 1 January 2015; this means that half of the EU-28’s population were older than 42.4 years, while half were younger. The median age is projected to increase by 3.8 years to 46.2 years in 2050. While 15.6 % of the population were aged less than 15 in 2015, this share is projected to fall slightly to 15.0 % by 2050. By contrast, the share of people aged 65 and over is projected to increase from 18.9 % in 2015 to 28.1 % by 2050, with the share of people aged 85 and over more than doubling from 2.5 % in 2015 to 6.0 % by 2050.
Projections for the demographic factors that will drive the change in the overall population are presented in Figure 2. Natural change — the difference between the number of births and the number of deaths — is projected to turn negative in the EU-28 from 2016 onwards, with deaths exceeding births by 1.3 million by 2050. Net migration — the difference between the number of immigrants and the number of emigrants — is projected to increase in the EU-28 from 891 thousand in 2015 to a peak of 1.37 million in 2036, after which it is projected to fall every year (except in 2039) to reach 1.19 million by 2050.

(thousands)
Source: Eurostat (proj_13ndbims)
Initially, the combined impact of the natural population change and net migration is projected to be a series of progressively smaller annual increases in the overall population, from an increase of 941 thousand in 2015 to an increase of 533 thousand in 2028. Thereafter, the population change is projected to stabilise through to 2035 as the increases in net migration are balanced out by a growing level of negative natural population change, with population growth projected to be within the range of 516–535 thousand per year. From 2036, overall population growth is projected to slow again as a falling level of net migration compounds the increasingly negative natural population change. By 2048, the levels of net migration and the negative population change are projected to be almost balanced and for the last two years of the period analysed the projections indicate that net migration will no longer be larger than the negative natural population change leading to a projected decline in overall population numbers for 2049 and 2050. </sesection>
Projected changes in regional populations
A small majority of EU regions are projected to have higher population in 2050 than in 2015
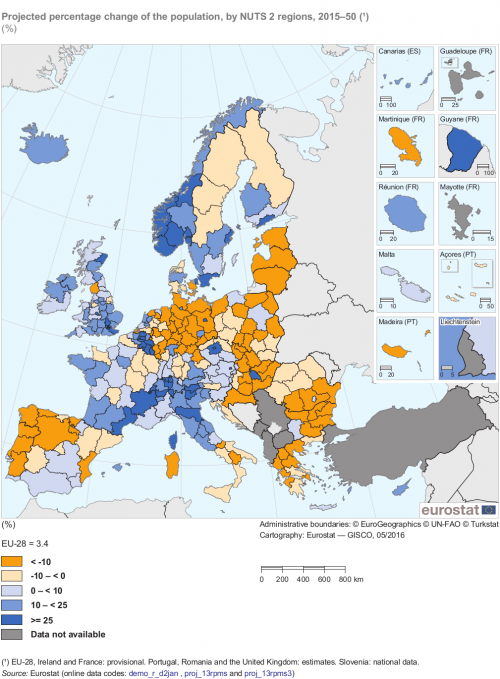
As noted above, the EU-28’s population is projected to increase by 3.4 % between 2015 and 2050. Among the 273 NUTS level 2 regions for which data are shown in Map 1, 132 are projected to have a lower population in 2050 than in 2015 (as shown by the two orange shades), while a slightly larger number, 141 regions, are projected to have a higher population (as shown by the three shades of blue).
Between 2015 and 2050 the population of the Spanish region of Ciudad Autónoma de Melilla is projected to more than double, with the population of the French overseas region of Guyane projected to increase by 94.6 %. For three other regions growth in excess of 80 % is projected: Luxembourg (one region at this level of detail), the Belgian capital city region, and the Spanish Ciudad Autónoma de Ceuta. As well as these five regions, there are another 31 regions across the EU where the projected increase in population is at least 25 % (as shown by the dark blue shade in Map 1): nine regions in the United Kingdom, 6 more of the 11 Belgian regions, three other French regions, three Italian regions, two regions in each of the Czech Republic, Finland and Sweden, and one region from each of Denmark, Germany, Hungary and Austria. As such, among these 36 regions with the highest projected population growth, nearly two thirds (23 regions) are located in western EU Member States, while there are five regions from northern and five regions from southern Member States, as well as three regions from eastern Member States.
SPOTLIGHT ON THE REGIONS
Severozapaden, Bulgaria
Eurostat’s population projections suggest that the six regions with the largest projected falls in population include Severozapaden and Severen tsentralen from northern Bulgaria and Mecklenburg-Vorpommern, Thüringen, Chemnitz and Sachsen-Anhalt from the eastern part of Germany. The population of Severozapaden is projected to almost halve (-48.9 %) during the period 2015–50, the biggest decline among any of the NUTS level 2 regions.
©: Stefankarakashev at Bulgarian Wikipedia
The six regions with the largest projected falls in population include Severozapaden and Severen tsentralen in northern Bulgaria and Mecklenburg-Vorpommern, Thüringen, Chemnitz and Sachsen-Anhalt in eastern Germany, all with projected falls in excess of 36 %. The darker orange shade in Map 1 shows all 78 regions where the projected fall in population is greater than 10 %. A total of 22 of the 38 German regions are projected to have falls of this magnitude, along with nine Polish regions, six Greek and Spanish regions, five Bulgarian and Hungarian regions, four Dutch and Portuguese regions, three Italian and Romanian regions, two Czech and Slovakian regions, a single region in each of Denmark, France, Croatia and the United Kingdom, as well as the Baltic Member States (each one region at this level of detail). As such, most of these regions are in the eastern and western Member States, with a somewhat smaller number in southern Member States and only a few in northern parts of the EU.
There are relatively high population increases projected for the three EFTA countries included in the Europop2013 round of population projections. The population of Iceland (one region at this level of detail) is projected to grow by 24.2 % between 2015 and 2050. There were five regions in Norway (out of seven) and five regions in Switzerland (again out of seven) where the population is projected to grow by more than 25 % during the period 2015–50. Among these, the highest projected increase (74.9 %) is foreseen for the Norwegian capital city region of Oslo og Akershus.
(%)
Source: Eurostat (demo_r_d2jan), (proj_13rpms) and (proj_13rpms3)
Figure 3 provides a summary of the direction of projected population change in the NUTS level 2 regions, again between 2015 and 2050. The population is projected to decrease in the Baltic Member States (all of which are mono-regional) and in both regions of Croatia. By contrast, increases are projected in Cyprus, Luxembourg and Malta (all of which are also mono-regional), Slovenia (for which only national data are available), both Irish regions and all Belgian regions. The majority of regions are projected to have an increase in population in the United Kingdom, France, Italy, Austria, Finland and Sweden, while the Czech Republic is split between four projected increases and four decreases. In the remaining EU Member States the majority of regions are projected to see their populations decrease, with a particularly large number of contractions (relative to increases) in the regions of Germany and Poland.
These latest projections suggest that for Iceland, Norway and Switzerland the population of each level 2 region is likely to increase during the period 2015–50.
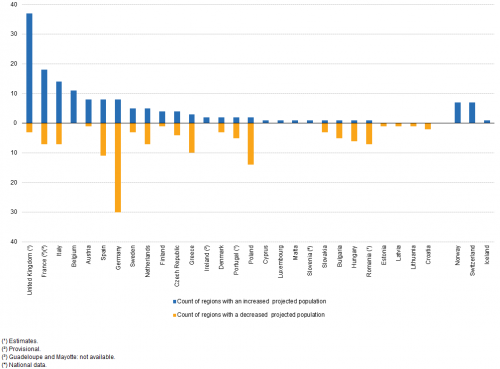
(number)
Source: Eurostat (demo_r_d2jan), (proj_13rpms) and (proj_13rpms3)
Capital city regions nearly always have a projected population change that is higher than the national average
A similar but more detailed analysis is presented in Figure 4. As well as distinguishing between the regions with projected increases and decreases between 2015 and 2050, this figure highlights the projected change in the populations of capital city regions, and also illustrates the diversity of the projected population changes within each country.
In 12 of the 21 multi-regional EU Member States for which data are available and in Norway, the capital city region has the highest projected population change between 2015 and 2050; note that at NUTS level 2, Inner London in the United Kingdom is composed of two regions, one of which has the highest projected population change, while the other has the fifth highest change. Among the remaining nine multi-regional Member States, the projected change in the population of the capital city region is below the national average only in Ireland, Greece and Croatia; this is also the case for Switzerland.
In terms of the simple range from highest to lowest, the least diverse projected population changes are in Ireland, Croatia (which both have only two regions), Poland and Slovakia, while the most diverse projected regional population changes between 2015 and 2050 are in Spain and France (although their large ranges are caused by a small number of exceptionally high values). A number of the other EU Member States have quite diverse projected changes across many of their regions, as is the case for Bulgaria, Hungary, Germany and the Czech Republic. There was also quite a large range for the highest to the lowest projected population changes in Norway.

(%)
Source: Eurostat (demo_r_d2jan), (proj_13rpms) and (proj_13rpms3)
Map 2 shows the same information as Map 1, but at a more detailed level, namely for NUTS level 3. At this level of detail the five regions with the largest projected increases in population are the same as those for NUTS level 2 regions, namely: the Belgian capital city region, Luxembourg (one region at this level of detail), and three overseas regions — the Ciudades Autónomas de Ceuta y Melilla (both Spain) and Guyane (France).
Eight NUTS level 3 regions are projected to have decreases in their population numbers in excess of 55 %: Vidin in Bulgaria, Siauliu apskritis in Lithuania and six eastern German regions, namely, Suhl Kreisfreie Stadt, Mansfeld-Südharz, Oberspreewald-Lausitz, Elbe-Elster, Anhalt-Bitterfeld and Spree-Neiße.
While the EU regions with the highest projected increases are the same for NUTS levels 2 and 3 and those with the highest projected decreases include several eastern German regions for NUTS levels 2 and 3, there are some interesting differences between the two maps. There are many NUTS level 2 regions where the projections for the more detailed NUTS level 3 regions vary greatly as can be seen from a few examples. In the Spanish island region of Canarias, the population of Fuerteventura is projected to grow by 33.4 %, while the population of La Gomera is projected to fall by a slightly larger amount, 35.4 %. In the north-western German region of Münster, seven of the NUTS level 3 regions have projected population decreases of at least 13.9 % while Münster Kreisfreie Stadt has a projected increase of 46.5 %. In the Danish NUTS level 2 capital city region of Hovedstaden, the island region of Bornholm has a projected fall in population of 7.4 %, while the NUTS level 3 capital city region of Byen København has a projected increase of 57.2 %. Other NUTS level 2 regions that have a particularly high range of values among their NUTS level 3 regions include: the Romanian capital city region of Bucuresti - Ilfov and the German regions of Thüringen, Leipzig, Freiburg, Brandenburg, Dresden and Darmstadt. In most of these examples, there is a projected shift in populations from more isolated, rural regions towards more densely-populated, urban regions.
In the EFTA countries, the relatively high projected population increases tend to be quite evenly spread across regions when analysing at a more detailed level. For example, in the Norwegian capital city region of Oslo og Akershus (level 2 region) the population is projected to increase by 74.9 % during the period 2015–50, distributed quite evenly between the two level 3 regions of Oslo (80.2 %) and Akershus (69.0 %). In a similar vein, in the northern region of Nord-Norge (level 2), the projected population increase is 19.9 %, with increases among its level 3 regions ranging from 17.7 % in Nordland to 22.5 % for Troms.
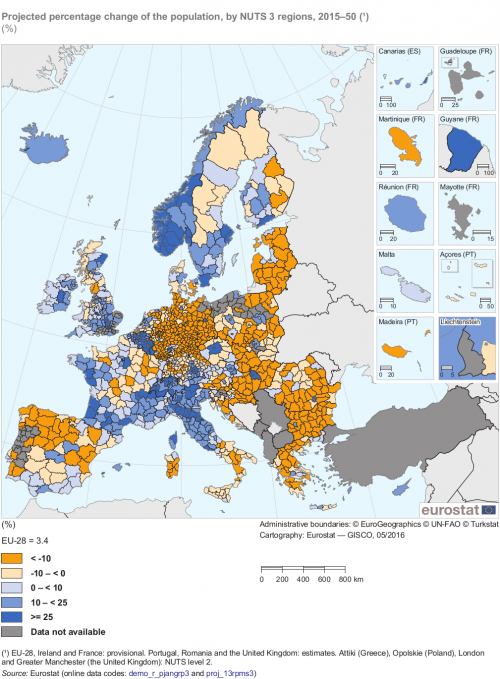
(%)
Source: Eurostat (demo_r_pjangrp3) and (proj_13rpms3)
Demographic factors for projected changes in regional populations
As noted earlier for the EU-28, the overall change in population stems from the relative importance of natural population change (the net effect of births and deaths) and net migration (the balance between immigration and emigration). These two components of population change are presented separately for NUTS level 2 regions in Maps 3 and 4, using the same colours and class boundaries as used for the overall population changes shown in Map 1. Some regions have projected positive change for both of these components over the period 2015 to 2050, leading to an overall increase in population; others have projected negative change for both components leading to an overall decrease; the remainder have a balance of one negative and one positive component, with the overall direction of population change determined by whichever is greater.
High population increases from natural population change are projected mainly in the regions of western EU Member States
For the EU-28 as a whole, natural population change is projected to reduce the overall population by 4.8 % between 2015 and 2050. It is therefore not unsurprising to find a larger number of NUTS level 2 regions with a projected decrease (202) in population due to natural change than with a projected increase (67). Only seven regions have a projected natural population increase of 25 % or more (the darkest shade of blue in Map 3): the capital city regions of Belgium, France, Sweden and the United Kingdom (NUTS level 1), as well as the two Spanish regions of Ciudades Autónomas de Ceuta y Melilla and the French overseas region of Guyane. The other regions for which a positive natural population change is projected (shown with the two lighter shades of blue in Map 3) are concentrated mainly in the western EU Member States — the United Kingdom (21 regions), France (10 regions), Belgium (eight regions), the Netherlands (four regions), Germany, Ireland (two regions each), Austria (one region) and Luxembourg (which is one region at this level of detail) — with only a few regions elsewhere: three Swedish regions, two Danish regions and one Finnish region in the north; two Czech regions in the east; and two Italian regions and Cyprus (which is one region at this level of detail) in the south. Two Norwegian regions — Oslo og Akershus and Agder og Rogaland — are also projected to have population increases of more than 25 % due to natural population change.
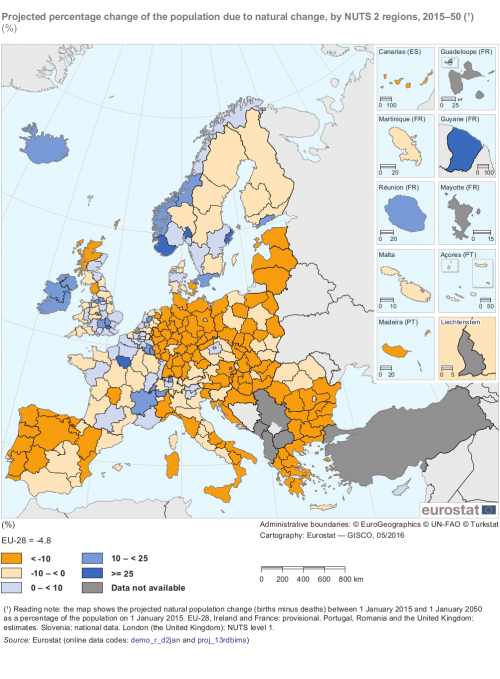
(%)
Source: Eurostat (demo_r_d2jan) and (proj_13rdbims)
Highest population decreases from natural population change are projected mainly in eastern regions of Germany
A total of 119 NUTS level 2 regions are projected to have a decrease in population of more than 10 % due to natural population change between 2015 and 2050 and these are shown in Map 3 with the darkest shade of orange. Among these are nine regions where the decrease in population due to natural population change is projected to be greater than 25 %: Severozapaden and Severen tsentralen in Bulgaria, Principado de Asturias in Spain, and the regions of Chemnitz, Sachsen-Anhalt, Brandenburg, Mecklenburg-Vorpommern and Thüringen in eastern Germany and Saarland in south-western Germany.
By contrast, the EU-28’s population is projected to increase due to net migration by 8.2 % between 2015 and 2050. A total of 210 regions are projected to have an increase in population due to net migration during this period (as shown by the different shades of blue in Map 4), with 23 of them projected to have increases of 25 % or more, including eight capital city regions. These 23 regions are mainly located in western and southern EU Member States, with three in the east and two in the north.
Among the 59 NUTS level 2 regions in the EU where a population decrease due to net migration is projected between 2015 and 2050, there were 10 regions where the population is projected to decrease by more than 10 %. These were spread across seven different EU Member States: Latvia and Lithuania (each one region at this level of detail); two Greek regions including the capital city region of Attiki; the two northern Bulgarian regions of Severozapaden and Severen tsentralen; the north-eastern Hungarian region of Észak-Magyarország; Sachsen-Anhalt in Germany, and; the French overseas regions of Martinique and La Réunion.
It can be noted that there are three regions which are common to the lists of regions with projected decreases of more than 25 % due to natural population change and more than 10 % due to net migration: Severen tsentralen, Severozapaden and Sachsen-Anhalt. These three regions, along with Chemnitz in Germany, are the four NUTS level 2 regions in the EU with the largest overall projected decreases in their respective populations.
A similar analysis shows that natural population change is projected to increase in the majority of EFTA level 2 regions during the period 2015–50, while every one of the EFTA regions in Iceland, Norway and Switzerland is projected to see its population increase as a result of net migration. There are five Norwegian regions where the population is projected to increase by at least 25 % as a result of net migration, including the capital city region (Oslo og Akershus) which has the highest projected rate of increase, at 41.6 %. The projected increases in population numbers as a result of net migration range from 22.7 % to 34.8 % for the seven level 2 regions in Switzerland, with the highest projected increase for the Région lémanique (the region around Lake Geneva).
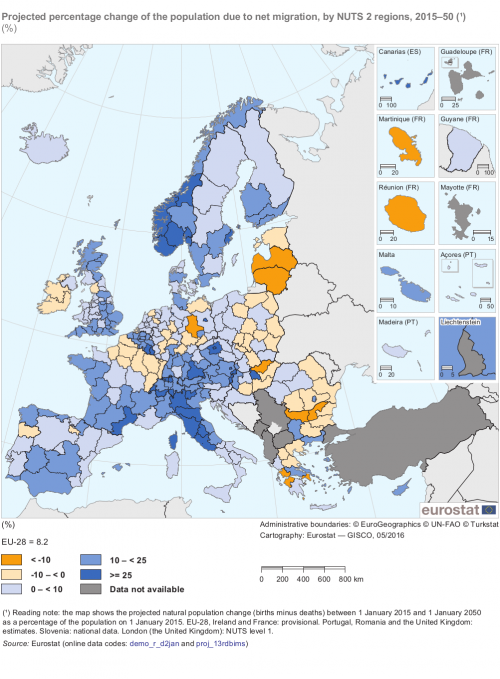
(%)
Source: Eurostat (demo_r_d2jan) and (proj_13rdbims)
Combining the information presented in Maps 1, 3 and 4, the 269 NUTS level 2 regions in the EU for which data are available [1] can be grouped concerning their projected population changes between 2015 and 2050. There were:
- 50 regions where both natural change and net migration are projected to decrease;
- 83 regions where natural change is projected to decrease and net migration to increase leading to an overall population decrease;
- 9 regions (both Irish regions and seven French ones) where natural change is projected to increase and net migration to decrease leading to an overall population increase;
- 69 regions where natural change is projected to decrease and net migration to increase leading to an overall population increase;
- 58 regions where both natural change and net migration are projected to increase.
Ageing regional populations
Only nine regions in the EU are projected to have a lower median age in 2050 than in 2015
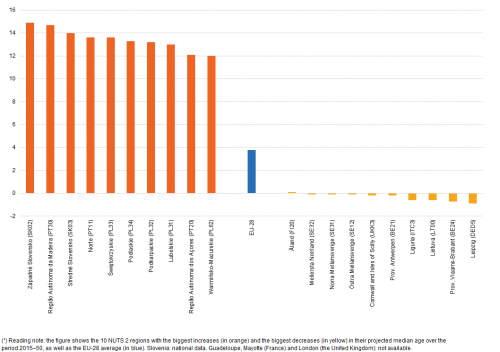
As noted earlier, the median age of the EU-28’s population was 42.4 years on 1 January 2015 and is projected to increase by 3.8 years to 46.2 years by 2050. The 10 fastest ageing NUTS level 2 regions in the EU as well as the 10 slowest ageing regions (which include nine regions where the median age is projected to actually fall between 2015 and 2050) are shown in Figure 5. One of the nine regions where the population is projected to be younger in 2050 than in 2015 is the north-western Italian region of Liguria while the other eight are split between northern and western EU Member States: Sweden and Lithuania in the north; Belgium, Germany and the United Kingdom in the west. By contrast, the regions projected to age the fastest are concentrated in just three of the Member States, from the south and the east: three Portuguese regions, five Polish regions, and two Slovakian regions.
SPOTLIGHT ON THE REGIONS
Západné Slovensko, Slovakia
The median age of the EU-28 was 42.4 years in 2015: in other words, half of the EU-28’s population was older than 42.4 years, while half was younger. The effects of population ageing are already apparent and the median age of the EU-28 population is projected to rise by 3.8 additional years between 2015 and 2050. During the same period (2015–50), the median age of the populations in two Slovakian regions — Západné Slovensko and Stredné Slovensko — and the Portuguese Região Autónoma da Madeira are projected to increase by 14–15 years, such that the median age attains 55.4 years in Západné Slovensko by 2050, the highest value among any of the NUTS level 2 regions.
©: Paul Cosmin
The magnitude of the projected change in median age is quite small for all nine regions where a fall is projected, all less than one year of difference. By contrast, three regions — Západné Slovensko and Stredné Slovensko (both Slovakia) and the Região Autónoma da Madeira (Portugal) — are projected to have increases of at least 14 years for their median ages between 2015 and 2050.
Among the 268 NUTS level 2 regions of the EU (including only national data for Slovenia) for which data are available, a total of 26 are projected to have increases of at least ten years. These include 11 of the 16 Polish regions, four of the seven Portuguese regions, three of the four Slovakian regions, as well as five regions from eastern Germany, and a single Hungarian, Italian and French overseas region.
Across the 15 level 2 regions in the EFTA countries, the projected increase in the median age between 2015 and 2050 was generally quite small in magnitude, ranging from 1.3 years in the Swiss region of Ticino to 4.1 years in Zentralschweiz (also Switzerland).
(years)
Source: Eurostat (proj_13rdbims)
Other signs of projected ageing can be seen by looking at the share of particular age groups in the total population or at age dependency ratios. The share of people aged 65 and over in the EU-28 is projected to increase from 18.9 % in 2015 to 28.1 % by 2050. At the same time, the share of people aged 15–64 (a broad definition of the working-age population), is projected to fall from 65.5 % in 2015 to 56.9 % by 2050.
Age dependency ratios may be used to study the level of support given to younger and/or older persons by the working-age population; these ratios are expressed in terms of the relative size of younger and/or older populations compared with the working-age population. The old-age dependency ratio, shown in Map 5, is calculated as the ratio between the number of people aged 65 and over and the number aged 15–64, expressed as a percentage. As the share of the older age group is projected to rise while that of the working-age group is projected to decline, the old-age dependency ratio is projected to increase, from 28.8 % in 2015 to 49.4 %. In other words, in 2015 the ratio of people of working-age to people aged 65 and over was 3.5 : 1 and this is projected to fall to almost 2 : 1 by 2050.
By 2050, four eastern German regions are projected to have more people aged 65 and over than of working-age
There were four eastern German regions — Chemnitz, Sachsen-Anhalt, Mecklenburg-Vorpommern and Brandenburg — where the old-age dependency ratio is projected to reach or exceed 100 %; in other words, there will be as many or even more people aged 65 and over as there will be aged 15–64. A total of 47 of the 273 NUTS level 2 regions of the EU (including only national data for Slovenia) for which data are available (as shown in Map 5) have a projected old-age dependency ratio of 62 % or higher in 2050 (the darkest shade of orange in the map). Most of these regions are in Germany (18 regions) or one of the southern EU Member States: Spain (nine), Greece (six), Portugal (four) or Italy (three). In addition, there are a few such regions in other western Member States (France, the Netherlands, Austria and the United Kingdom) or eastern Member States (Bulgaria and Slovakia). The only capital city regions where the old-age dependency ratio is projected to reach or surpass 62 % by 2050 are Attiki in Greece and the Comunidad de Madrid in Spain.
By contrast, the capital city regions of 11 EU Member States figure among the 38 regions where the projected old-age dependency ratio by 2050 is below 40 % (as shown by the lightest shade of orange in Map 5). The other regions projected to have relatively low old-age dependency ratios were mainly in Belgium, the United Kingdom and Sweden, with a small number of regions in Denmark, Germany, Spain, France and the Netherlands.
Projected old-age dependency ratios are generally quite low for the EFTA level 2 regions, and the following rates are projected for their capital city regions: 45.3 % for the Espace Mittelland (Switzerland), falling to 37.5 % in Iceland (one region at this level of detail) and 29.9 % for Oslo og Akershus (Norway).

(%)
Source: Eurostat (proj_13rdbims) and (proj_13rpms3)
Source data for tables and graphs
Data sources
Europop2013, the latest population projections released by Eurostat, provide a main scenario and four variants for population developments from 2013 to 2080 across 31 European countries: all of the EU Member States, as well as Iceland, Norway and Switzerland. These population projections were produced using data for 1 January 2013 as a starting point and therefore include any modifications made to demographic statistics resulting from the 2011 population census exercise.
Europop2013 projections result from the application of a set of assumptions on future developments for fertility, mortality and net migration. The projections should not be considered as forecasts, as they show what would happen to the resulting population structure if the set of assumptions are held constant over the entire time horizon under consideration; in other words, the projections are ‘what-if’ scenarios that track population developments under a set of assumptions. As these population projections are made over a relatively long time horizon, statements about the likely future developments for the EU’s population should be taken with caution, and interpreted as only one of a range of possible demographic developments.
The Europop2013 population projections at regional level were produced using the NUTS 2010 classification and these data have been reclassified to NUTS 2013 for the purpose of this article. The consequences of this are that: data are not available at any NUTS level for the French regions of Guadeloupe and Mayotte; for data presented at NUTS level 2, only national data are available for Slovenia, and in most cases data for London (the United Kingdom) are only available at NUTS level 1; for data presented at NUTS level 3, data are not available for some German, Polish, Portuguese, Slovenian and British regions, while data for London are presented at NUTS level 2.
NUTS
The data presented in this article are based exclusively on the 2013 version of NUTS. For the vast majority of regions there is no difference between the 2010 and 2013 versions of NUTS. Whereas the latest population data (generally for 1 January 2015) used in many figures and maps in this article were available in the 2013 version of NUTS, the regional population projections were produced using the 2010 version of NUTS. All of the data for the regional population projections used in this article have been converted to NUTS 2013. The countries affected by changes to the 2013 version of the NUTS classification were Germany, Greece, France, Poland, Portugal, Slovenia and the United Kingdom. The conversion of the data has had the following consequences for presenting data at NUTS level 2: data for the French region of Guadeloupe are not available, only national data are available for Slovenia, and in some cases data for London are shown at NUTS level 1. The conversion of the data has had the following consequences at NUTS level 3: data for a number of regions are not available, while data for Attiki (Greece), Opolskie (Poland), London and Greater Manchester (the United Kingdom) are shown at NUTS level 2.
Context
Demographic changes in the EU are likely be of considerable importance in the coming decades as the vast majority of models concerning future population trends suggest that the EU’s population will continue to age, due to consistently low fertility levels and extended longevity. Although migration plays an important role in the population dynamics of European countries, migration alone will almost certainly not reverse the ongoing trend of population ageing experienced in many parts of the EU. The social and economic consequences associated with population ageing are likely to have profound implications across Europe, both nationally and regionally. For example, low fertility rates will lead to a reduction in the number of students in education, there will be fewer working-age persons to support the remainder of the population, and a higher proportion of elderly persons (some of whom will require additional infrastructure, healthcare services and adapted housing). These structural demographic changes could impact on the capacity of governments to raise tax revenue, balance their own finances, or provide adequate pensions and healthcare services.
Direct access to
- EUROPOP2013 - Population projections at regional level (proj_13r)
- Projected population (proj_rp)
- Main scenario - Population on 1st January by age, sex and NUTS 2 regions (proj_13rpms)
- Main scenario - Population on 1st January by age, sex and NUTS 3 regions (proj_13rpms3)
- Assumptions (proj_13ra)
- Projected demographic balances and indicators (proj_13rdbi)
- Main scenario - Projected demographic balances and indicators by NUTS 2 regions (proj_13rdbims)
- Main scenario - Projected demographic balances and indicators by NUTS 3 regions (proj_13rdbims3)
- Projected population (proj_rp)
- Population projections (ESMS metadata file — proj_esms)
Notes
- ↑ The only difference in the data availability across these three maps concerns London: NUTS level 2 data for London are only available for Map 1, so this joint analysis of Maps 1, 3 and 4 uses NUTS level 1 data for this region.
