Archive:Extra-EU trade in manufactured goods
- Data from November 2010, most recent data: Further Eurostat information, Main tables and Database.
This article focuses on the structure and evolution of the European Union external trade in manufactured goods: imports and exports at EU level.
The Standard international trade classification distinguishes four main categories (sections) of manufactured goods:
- Chemicals (SITC 5);
- Manufactured goods classified chiefly by material (SITC 6);
- Machinery and vehicles (SITC 7);
- Miscellaneous manufactured articles (SITC 8);
Sections 6 and 8 are often grouped together as 'Other manufactured goods'.
Main statistical findings
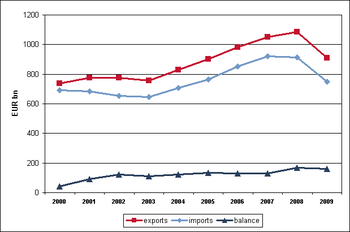
The EU exports consist mainly of manufactured products: their share has annually been around 85 % of total EU exports. In 2009, exports of 'machinery and vehicles' and 'other manufactured goods' fell by about a fifth, while exports of chemical products reduced only by 2 %.
About two thirds of EU imports are manufactured goods. The breakdown diverges from exports: 'machinery and vehicles' and chemical products account for a smaller share while the share of 'other manufactured goods' is similar to that for exports. The surplus in trade of manufactured goods reached a peak of EUR 170 billion in 2008, then decreased to EUR 159 billion in 2009.
Chemicals
The chemicals sector (SITC Section 5) contains various chemical goods such as organic chemicals, inorganic chemicals, plastics and pharmaceutical products.
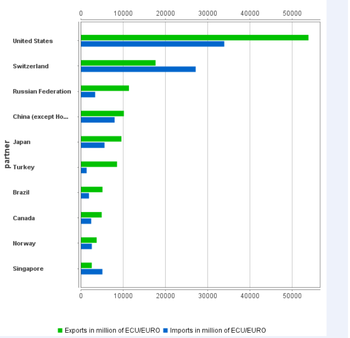
Trade in chemicals has grown steadily every year from 2003 to 2008 but its share of the total EU trade has remained quite stable: in 2009 chemicals accounted for 18% of exports and 9% of imports.Besides machinery and vehicles, the chemicals sector is the only product group where the EU posts a trade surplus. The surplus reached EUR 83.1 billion in 2009.
The most important products within the group, both for exports and imports, are pharmaceutical products and organic chemicals.
Majority of imports come from a small number of countries: in 2009 the seven biggest suppliers accounted for over three quarters of total EU imports. The USA was the main source, with a proportion of 31%, followed by Switzerland with 24%.
The USA (28% in 2009) and Switzerland (9%) were also the main partner countries for exports.
Machinery and vehicles
‘Machinery and vehicles’ (SITC Section 7) includes power generating and industrial machinery, computers, electric and electronic parts and equipment, road vehicles and parts, ships, airplanes and railway equipment.
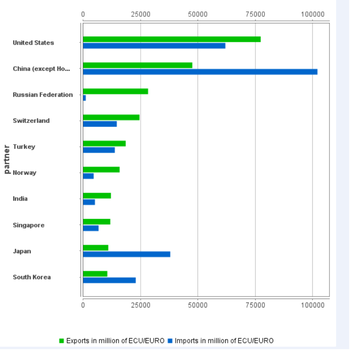
‘Machinery and vehicles’ is the most important individual product group in the external trade of the EU, accounting for 41% of the total EU exports and 29% of imports in 2009. The group records also the largest surplus in EU trade: EUR 112.6 billion in 2009.
The main exported products within the group are road vehicles, industrial machinery and electrical machinery, while the imports are dominated by electrical machinery, telecommunications equipment and IT products.
The USA is by far the biggest destination country of EU exports, although its proportion diminished from 24% to 18% between 2004 and 2009. Concerning the other main partner countries, exports to China increased strongly during the same period while Russia replaced Switzerland as the third main partner.
The USA and Japan are still two of the top three source countries for imports although their importance has decreased. In 2004 they covered 39% of EU imports but only 29% in 2009. During the same period China’s share increased from 18% to 30%.
Other manufactured goods
‘Other manufactured goods’ (SITC Sections 6 and 8) is a heterogeneous group consisting of manufactured goods which range from basic semi-manufactured goods such as leather, rubber, wood, paper, textiles, metals, building fixtures and fittings to more labour-intensive products like clothes, shoes and accessories, scientific instruments, clocks, watches and cameras.
The structure of exports and imports, in terms of products, differs to some extent. The EU exports more semi-manufactured goods such as metals and metal products while for imports manufactured goods are more relevant, in particular clothing.
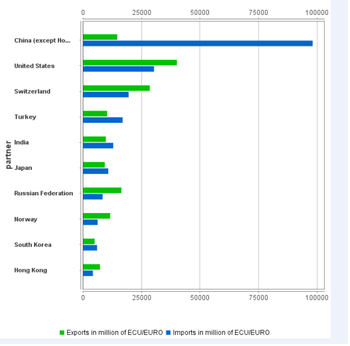
After a fall in 2003, the value of both imports and exports rose continuously from 2004 to 2008, then dropped again in 2009. The EU trade deficit reached its maximum in 2007, but reduced by a half in the two following years.
Since overtaking the USA in 2001, China has been the biggest supplier to the EU in this product group, reaching a share of 33% in 2009. Other important suppliers include the USA, Switzerland and Turkey. The main destinations for exports are the USA, Switzerland, Russia and China.
Data sources and availability
EU data come from Eurostat’s COMEXT database. COMEXT is the Eurostat reference database for external trade. It provides access not only to both recent and historical data from the EU Member States but also to statistics of a significant number of third countries. External trade aggregated and detailed statistics disseminated from Eurostat website are compiled from COMEXT data according to a monthly process. Because COMEXT is updated on a daily basis, data published on the website may differ from data stored in COMEXT in case of recent revisions.
EU data are compiled according to EU guidelines and may, therefore, differ from national data published by Member States. Statistics on extra-EU trade are calculated as the sum of trade of each of the 27 Member States with countries outside the EU (including the new Member States when they had not yet joined). In other words, the EU is considered as a single trading entity and trade flows are measured into and out of the area, but not within it.
Context
The EU is the world's biggest exporter of manufactured goods, and is a global market leader for high-quality products. Thanks to some of its key assets such as chemicals, pharmacy products, motor vehicles and non-electrical machinery, the European Union's trade balance for manufactured products is improving greatly, partially offsetting the rise in the energy deficit.
Further Eurostat information
Publications
- Extra EU 27 trade falls by 20 per cent in 2009 - Issue number 28/2010
- EU-27 imports of telecom products increased by 61% over 2000 – 2008
- EU-27 trade in chemical products in 2007
- EU-27 trade in motor cars in 2007
- Monthly bulletin on external and intra-European Union trade
Main tables
- External Trade, see:
- External trade aggregated data (t_ext)
Database
- External trade aggregated data (ext)
- External trade detailed data (detail)
Dedicated section
Methodology/Metadata
- External trade data (ESMS metadata file - ext_esms)


