Archive:Land cover and land use (LUCAS) statistics
This article has been archived. For more information on 'Agriculture' and 'Environment' please see Agriculture and Environment
This article provides information on Eurostat’s land use/cover area frame survey (LUCAS), which provides harmonised and comparable statistics on land cover and land use across the whole of the European Union’s (EU’s) territory (other than Croatia). Statistics from LUCAS can be used to monitor a range of socio-environmental challenges, among others, the degree of landscape fragmentation, soil degradation or the environmental impact of agriculture.
One of the underlying characteristics of European landscapes is the rapid changes that occur when moving within relatively small areas, for example, from sub-Arctic tundra environments to semi-arid surroundings or from lowlands and plains to relatively high mountain chains such as the Alps, Pyrenees or Carpathians. As such, the EU is home to a diverse range of habitats, flora and fauna. Land cover and land use play an integral role in these varied ecosystems which are indispensable for biodiversity within the EU.
- What is land cover?

Land cover is the bio-physical coverage of land (for example, crops, forests, buildings or lakes). Land cover in LUCAS is specified according to a classification with as many as 76 subclasses — at its most basic level the main types of land cover are: artificial land; cropland; woodland; shrubland; grassland; bare land and lichens / moss; water areas; wetlands.

Landscape diversity
Landscape refers to an area of land whose character and functions are defined by the complex and regionally-specific interaction of natural processes (relief, soil type, water availability, climate, biological diversity) and cultural features (human intervention through agriculture, forestry, rural policies, construction and economic pressures).
While some countries have large continuous areas of the same land cover, others have a mosaic of small areas of different land covers. The presence of grass verges, hedges, dry stone walls, ditches and other semi-natural linear elements is considered to be of fundamental importance to help promote biodiversity, providing ecosystem services such as pollination or pest control. On the other hand, the gradual moulding of landscapes by human activity has modified landscapes, for example, through urbanisation, changes in agricultural practices, or the increased use of transport. The density of man-made linear elements, which have a dissecting nature (such as roads, railways and aerial cables) is closely linked to population and infrastructure developments, and these elements may impede biodiversity — for example, a motorway that cuts through a natural area may restrict the free movement of wild animals.
Eurostat produces a range of indicators that may be used to evaluate the links between landscape patterns and biodiversity. Landscapes can be evaluated as LUCAS surveyors walk along a 250m transect recording land cover transitions and the presence of linear features. The structure of EU landscapes is analysed by taking into account the following elements: richness (the number of different types of land cover), diversity (the relative abundance of land cover types — in other words, whether they recur within the transect) and fragmentation (the presence of structural and dissection elements), to provide information on the spatial organisation, presence and arrangement of landscape features.
- What is land use?
Land use is the socioeconomic use made of land (for example, agriculture, business, residential use or recreation); at any one place, there may be multiple and alternate land uses. Land use in LUCAS is specified according to 33 distinct classes that cover the primary sector (for example, agriculture and forestry); the secondary sector (industry); the tertiary sector (services); and other uses (for example, residential use and abandoned areas).

From the data collected on the transect, the Shannon evenness index can be calculated which provides one measure of landscape diversity.
- Shannon evenness index
When the LUCAS surveyors walk a 250m transect, they are requested to register all the land cover changes they observe. The degree of homogeneity or heterogeneity of land cover can be analysed by measuring the number of different land cover types in each transect and their relative abundance (in other words, whether the same type of land cover reoccurs in the transect).The Shannon evenness index (SEI) can be used to evaluate landscape diversity and takes into consideration both the number of different land cover types observed and their relative abundance; the index is based on values within the range of 0–1, with zero representing a landscape with no diversity (only one land cover type) and a value of one representing the maximum diversity (in other words, featuring all types of land cover in equal amounts). If a landscape is characterised by all different types of land cover being found in equal abundance then the Shannon evenness index will tend towards the value of one; conversely, if there is only one dominant type of land cover then the index will tend towards zero.
Shannon evenness index =
where the relative abundance of land cover types is denoted by Pi and the different types of land cover are denoted by m.
A case study for the use of LUCAS — monitoring soil across the EU
The remainder of this article provides some background information in relation to the possible uses that can be made of the LUCAS data set; it concentrates on one particular area, soil. A more detailed list of areas where LUCAS data are currently being used to help analyse and contribute to the development of various EU policy areas is provided in the Context section.
The formation of soil is an extremely slow process and soil is therefore sometimes considered as a non-renewable resource. Demand for data and information that may be used to assess the state of European soils has been covered, among others, by the 6th Environment Action Programme, which outlined the EU’s soil thematic strategy (see box), the sustainable use of soil to preserve its functions, and plans to restore degraded or polluted soils. These principles were confirmed in the 7th Environment Action Programme which restates the EU’s commitment to: reduce soil erosion; increase organic matter in soil; limit the effects of man-made pressures on soil; manage land in a sustainable fashion; and remedy sites with contaminated soils.
- The EU’s soil thematic strategy
In 2006, the European Commission’s communication titled ‘Thematic strategy for soil protection’ (COM(2006) 231) laid out plans to ensure that the EU is committed to a high level of soil protection, with the objective of protecting soil functions and preventing further soil degradation. Within this framework, the EU Member States decide how best to protect the sustainable development of their own soils, while the European Commission provided an impact assessment of the economic, social and environmental impacts of different policy measures.In February 2012, the European Commission published a policy report on the implementation of the strategy (COM(2012) 46). This provided an overview of the actions undertaken within the EU’s soil thematic strategy, namely in relation to raising awareness, research, integration and legislation. It showed that the strategy has helped raise the profile of soil issues, for instance by integrating them into other policies. It also presented soil degradation trends both in Europe and globally, as well as future challenges to ensure soil protection.
For more information: Joint Research Centre, The state of soil in Europe
Soil degradation in Europe
Within the agricultural domain, land management practices such as organic and integrated farming can maintain and enhance organic matter in soil. However, there is an on-going pattern of soil degradation in the EU, despite policies to encourage soil protection. Soil degradation processes may be exacerbated by human activity, such as, agricultural and forestry practices, industrial activities, tourism, urban and industrial sprawl or construction works. As a result, soil degradation may impact directly upon water and air quality, biodiversity and climate change, and is therefore of interest to a range of policymakers.
Some of the main factors that cause soil degradation in the EU include soil erosion (by water or by wind), and a decline in the proportion of organic matter contained within soils: almost half the soil in the EU is considered to have a low content of organic matter and this is particularly evident in the southern Member States. Other forms of soil degradation include salinisation (the accumulation of soluble salts in soils), flooding, landslides or soil contamination from industrial activities (the use and presence of dangerous substances in production processes). Fully functioning soil reduces the risk of floods and protects underground water supplies by neutralising or filtering out potential pollutants.
Another form of soil degradation is that of soil sealing, when soil is replaced by an impermeable material, for example, due to the covering of land for housing, roads or other construction work. A roadmap to a resource-efficient Europe COM(2011) 571 — one of the flagship initiatives of the Europe 2020 strategy — has called for EU policies, by 2020, to ‘take into account their direct and indirect impact on land use in the EU and globally’, such that the rate of land take (land taken for urban and other artificial land development) is maintained on a path which aims to achieve no net land take by 2050.
LUCAS soil database
In 2009, the European Commission extended the LUCAS exercise to include an additional module in relation to soil. This survey was the first attempt to construct a pan-European topsoil database, which could serve as a baseline for EU-wide soil monitoring.
A total of nearly 20 000 topsoil samples were collected from approximately 10 % of the LUCAS 2009 data points in 23 of the EU Member States; Bulgaria, Croatia, Cyprus, Malta and Romania were initially excluded. Subsequently, Cyprus and Malta provided soil samples even though LUCAS was not carried out on their territories in 2009, while 664 and 1 427 topsoil samples were collected in Bulgaria and Romania in 2012.
Each sample was equivalent to around 0.5 kg of topsoil (0–20 cm in depth). All samples were registered and visually checked; mineral soils were air-dried and repacked, before being sent to a central laboratory for physical and chemical analyses to measure, among others: particle size (clay, silt and sand content), pH (acidity and alkalinity), organic carbon, carbonate content, phosphorus content, total nitrogen content and extractable potassium content.
LUCAS data — its application to monitor the soil thematic strategy
LUCAS is based on a uniform methodology, has flexibility in its design to allow European Commission services to specify particular survey modules (such as the soil survey in 2009), and can provide soil monitoring data within two or three years.
LUCAS data have been used to make an initial analysis of land take, soil sealing, and more generally land cover and land use, while specific information from the soil module has been used to monitor the chemical and physical properties of soil across the EU. The latter has allowed a wide range of policy assessments to be made, for example, a better evaluation of carbon stocks in European soils, considered important within the context of climate change policy and for food production (as organic matter maintains soil fertility).
While the soil thematic strategy (COM(2006) 231) has helped raise the profile of these issues, there is still no systematic monitoring and protection of soil quality across Europe. In its progress report on the implementation of the strategy (COM(2012) 46) — published in 2012 — the European Commission noted that results from LUCAS could be a starting point for a harmonised system of monitoring. At the time of writing, the European Commission is drafting a Communication which highlights the importance of good land management and aims to raise awareness about the value of land as a resource; this Communication is likely to be adopted in 2015.
LUCAS data — its application to monitor agro-environmental indicators
The EU’s agricultural policy post-2013 contains commitments to incorporate a range of environmental concerns, for example, in a Communication entitled ‘Development of agri-environmental indicators for monitoring the integration of environmental concerns into the common agricultural policy’ (COM(2006) 508), the European Commission proposed a set of 28 agri-environmental indicators, including indicators for soil quality and soil erosion.
Soil quality
The LUCAS soil module includes the evaluation of the organic carbon content of soils (as derived from residual plant and animal material decomposed under the influence of temperature, moisture and ambient soil conditions); this indicator is named the organic carbon concentration of soil. A high level of organic carbon content may be linked with good soil conditions from an agro-environmental point of view and is likely to promote limited soil erosion, a high filtration capacity, a rich habitat for soil organisms, and provide a sink for atmospheric carbon dioxide. The annual loss of organic matter can vary greatly in soils, depending on natural factors (for example, climate, soil material, drainage status, land cover and topography), and human-induced factors (for example, type of plant / crop cover, land use, land management practices).
At present the LUCAS data are available only for 2009: this information provides a useful baseline against which the impact of the CAP post-2013 could be measured, especially in relation to the sustainable management of natural resources and climate action. If the LUCAS soil module is repeated at a later point in time, then organic carbon loss could be evaluated, a key indicator for measuring the pace of soil degradation.
Soil erosion
Soil’s vulnerability to erosion depends on a range of environmental conditions and human activities. By removing the most fertile topsoil, erosion reduces soil productivity and, where soils are shallow, may lead to an irreversible loss of farmland. Severe erosion is commonly associated with the development of temporary or permanently eroded channels or gullies that can fragment farmland.
Soil erosion is defined as the area exposed to the risk of erosion (in hectares and as a percentage of the total area). LUCAS data has been used in a modelling exercise (RUSLE) conducted by the European Commission’s Joint Research Centre (JRC) which evaluated soil erosion rates. The work carried out by the JRC suggests that the following types of data will be needed, in the future, to produce reliable indicators for soil erosion:
- soil data — texture, organic carbon content, structure, permeability;
- climate data — precipitation and temperature;
- land cover;
- topography;
- management — human and agricultural practices.
Data sources and availability
How is LUCAS conducted?
LUCAS is a harmonised in situ land cover and land use survey, implying that data are gathered through direct observations made by surveyors on the ground. The use of an area frame survey reduces the statistical burden on farmers and other land owners as they do not need to respond to a questionnaire.
The latest LUCAS field work took place between March and September 2012 for the EU-27 Member States (no information was collected for Croatia as the survey was conducted before Croatian membership of the EU).
- How is LUCAS conducted?
To conduct LUCAS, the EU’ territory was divided up using a 2*2 km² grid whose nodes constituted around 1.1 million points. From this, a sample of some 270 000 points were selected on the basis of stratification information — each of these points was visited by one of the 750 field surveyors (mostly agrarian and forestry engineers).
At each survey point, the surveyor: observes the land cover; observes the land use; notes other environmental parameters on the ground (for example, irrigation, grazing, burned areas, fire breaks); takes a series of photographs (of the reference point, as well as pictures to the north, south, east and west); walks 250 metres in an eastward direction (a ‘transect’) recording the different land cover and linear elements, such as walls, hedges, roads, railway lines, irrigation channels or electricity power lines. This information collected for each transect can be used to analyse the fragmentation, richness and diversity of landscapes — for example, the Shannon evenness index.


What type of information is available?
There are two main types of information derived from LUCAS that may be presented to users: aggregated statistical data and elementary data (for individual survey points). The aggregated results show land cover and land use for the EU-27 and national averages for the EU Member States, and can also be shown at a more detailed level, for example, for more than 250 NUTS 2 regions. These statistics can be supplemented by indices relating to landscape composition, richness, structure, dissection and diversity which may be aggregated to a national or a regional level from the information collected at individual survey points.
- Access LUCAS data — Eurostat’s statistical atlas
This application is an interactive viewer that allows users to study layers of statistical data in combination with geographical information. The statistical atlas can be used for viewing maps composed of LUCAS data and provides users with the opportunity to see all of the information collected at each of the surveyed points, including the coordinates of the location, the classification of land cover and land use and the photographs that were taken.
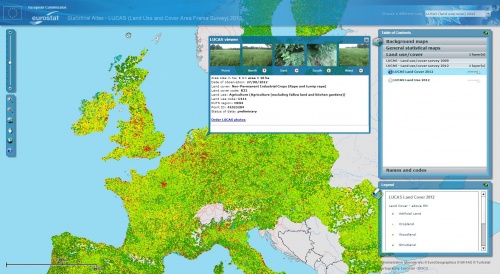 LUCAS online viewer (select LUCAS data from the drop-down list — top right corner of the application)


The elementary data is in situ micro-data for each of the surveyed points. It provides a rich source of information for further, detailed analyses. The data are presented in a tabular format in country-specific files.
Since the 2006 reference period, Eurostat has also made available a photograph archive from LUCAS. Photographs can be requested by using an online form.
Context
Most changes to landscapes are not visible on a day-to-day basis and the natural features that form landscapes (for example, valleys, plateaus and plains) are, by and large, the result of geographical processes that have taken place over a very long period of time. Alongside these natural processes, human intervention has increasingly left an imprint on environments where people live and work. Indeed, land has become a natural and economic resource that is used for multiple purposes: agriculture and forestry; mining, manufacturing and construction; distributive trades, transport and other services, as well as for residential and leisure use.
The onset of the industrial revolution led to a lengthy period during which forested areas across Europe were cleared (deforestation). Nevertheless, this pattern has been reversed during the last couple of decades, in part as a result of international climate change commitments made by the EU and its Member States — and as a result the EU is currently one of only a few regions in the world where forest cover is currently on the increase.
Historically, there have been a range of different developments that have impacted upon local ecosystems and biodiversity in the EU, including: a decline in agriculture’s share of land use; an increase in soil erosion and soil degradation; an increase in (sub)urban sprawl arising from demographic and economic growth; and the continued development of infrastructure (such as new roads, railways and other manifestations of economic development). When combined, these developments have often resulted in increasingly fragmented habitats, potentially impacting upon biodiversity.
Statistics from LUCAS can be used to help analyse and contribute to the development of various EU policy areas, for example: to protect soil, as detailed in the soil thematic strategy; to integrate environmental concerns into the Common Agricultural Policy (CAP) post-2013; to promote biodiversity and conservation, through the EU’s biodiversity strategy; to encourage the efficient use of resources for sustainable growth, as in the resource-efficient Europe initiative; to tackle climate change, through monitoring conducted by the European Environment Agency, as well as actions under the European climate change programme; or for land monitoring, spatial planning and resource management, as carried out by the Copernicus earth observation programme.
See also
Further Eurostat information
Data visualisation
Publications
- Diversified landscape structure in the EU Member States
- New insight into land cover and land use in Europe
Database
- Land cover (lan_lcv)
Dedicated section
Methodology / Metadata
- Land cover and land use, landscape (LUCAS) (ESMS metadata file — lan_esms)
Source data for tables, figures and maps (MS Excel)
Other information
External links
- European Commission — Directorate-General for Agriculture and Rural Development
- European Commission — Directorate-General for Climate Action
- European Commission — Directorate-General for the Environment
- European Commission — Joint Research Centre
- European Environment Agency