Stock of vehicles at regional level
Data from April 2024
Planned article update: 2 May 2025
Highlights
In the EU, there was an average rate of 0.56 passenger cars per inhabitant in 2022. At regional level, apart from two extreme values, the highest regional rate of passenger cars per inhabitant (1.4) was about seven times the lowest one (0.2).
In the EU, the highest shares of electric passenger cars in 2022 were often registered in northern European regions, such as Flevoland (Netherlands) which registered 12.8 % of electric passenger cars and Utrecht (Netherlands) with 6.6 %.
Fifteen German urbanised regions were in 2022 among the top EU regions with the lowest shares of utility vehicles in total number of vehicles, with values ranging between 6.1 % and 7.3 %.
(passenger cars per thousand inhabitants)
Source: Eurostat (tran_r_vehst)
This article presents recent statistics on the number of passenger cars, utility vehicles (lorries, road tractors and special vehicles excluding trailers and semi-trailers), and road public transport (motor coaches, buses and trolleybuses) in the European Union (EU), as well as in the EFTA and candidate countries, down to the level of regions (NUTS 2).
Full article
Stock of passenger cars at regional level
High motorisation rate in regions of northern Italy
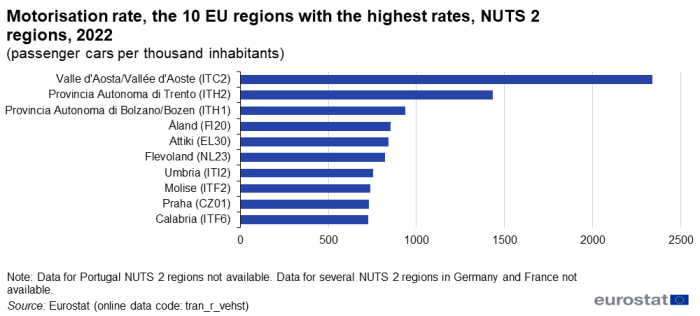
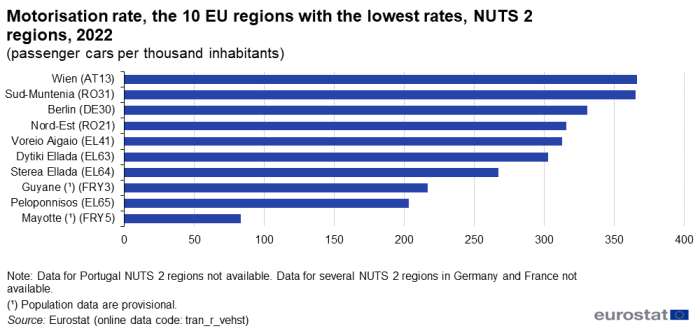
Figure 1 indicates that, in 2022, 6 out of the 10 EU regions with the highest motorisation rates (number of passenger cars per thousand inhabitants) were located in Italy. The other regions present in the top 10 are capital regions or regions close to major urbanised areas, such as Flevoland, Attiki or Praha. A particular case is the Finnish Åland islands group in the Baltic Sea, also with a particularly high motorisation rate. At the other end, 4 regions out of the 10 with the lowest motorisation rates in 2022 were located in Greece, 2 were located in Romania, 2 in France, 1 in Germany, and 1 in Austria. The value for the French overseas region Mayotte was exceptionally low, with 83 passenger cars per thousand inhabitants (see Figure 2).
(passenger cars per thousand inhabitants)
Source: Eurostat (tran_r_vehst)
(passenger cars per thousand inhabitants)
Source: Eurostat (tran_r_vehst)
Over the period 2002-2022, at national level, almost all countries recorded a linear increase of the motorisation rate. Romania registered the highest average annual growth rate of passenger cars among the EU Member States (+5.7 %), followed by Estonia (+3.9 %) and Poland (+3.6 %). Türkiye displayed a similar high increase with an average annual growth rate of +4.5 %. At the opposite end of the scale, the Netherlands (+0.8 %), France, Italy, Malta and Austria (+0.7 %), Belgium (+0.5 %), Germany (+0.4 %), and Luxembourg and Sweden (+0.2 %) were the only Member States recording average annual growth rates of less than 1 %. In general, the Baltic, eastern and central EU Member States have registered stronger growths over the 2002-2022 period than western European countries (see Figure 3).

(passenger cars per thousand inhabitants)
Source: Eurostat (tran_r_vehst)
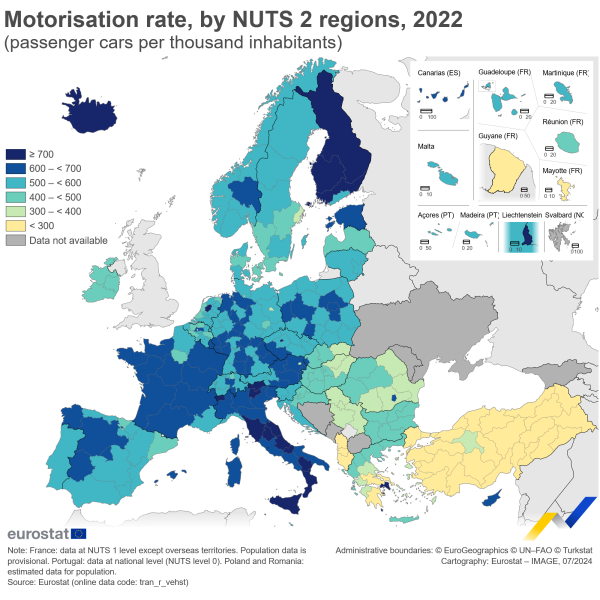
The motorisation rate registered in the various regions of the European Union is often linked to economic issues. A special case was the Italian region of Valle d'Aosta with a lower taxation on new vehicle registration. Several regions close to larger cities also had high motorisation rates, suggesting a larger number of commuters. Examples of such regions were Flevoland in the Netherlands and Attiki in Greece. Map 1 highlights the significant differences observed between western and eastern EU Member States when considering the number of passenger cars per thousand inhabitants in 2022. At national level, eastern European countries registered the lowest numbers of passenger cars per thousand inhabitants. In comparison, western and northern European countries recorded higher rates, but with various countries presenting marked regional disparities.

(passenger cars per thousand inhabitants)
Source: Eurostat (tran_r_vehst)
Noticeable disparities are clearly observable for some countries on Map 1. In Greece, for example, strong regional differences could be observed between the highest rate registered in the capital region (843 passenger cars per thousand inhabitants in the Attiki region) and the lower rates observed for the other regions in the country (369 passenger cars per thousand inhabitants on average).
Stock of electric passenger cars
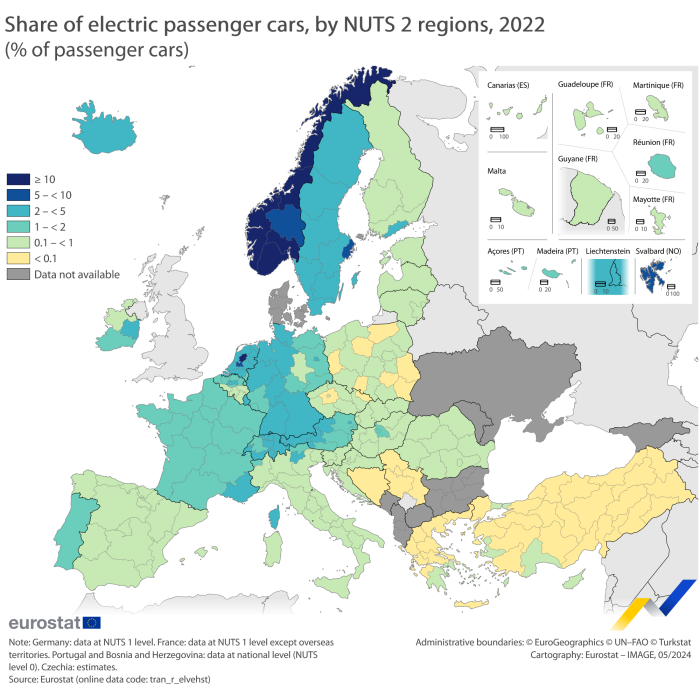
The northern regions adopt electric passenger cars faster than other regions. The share of electric passenger cars can be linked to different factors such as governmental incentives (like tax reductions or subsidies), the availability and access to recharging stations, as well as the offer of electric passenger cars and their cost. In the EU, the regions from the Netherlands and Sweden were in 2022 among the regions with the highest share of electric passenger cars, with shares of 12.8 % in Flevoland, 6.6 % in Utrecht and 6.6 % in Stockholm (Map 2). Two other regions from the Netherlands and three other regions from Sweden, as well as Luxembourg recorded shares of electric passenger cars above 3 % in 2022. Norway regions had shares of electric passenger cars in 2022 higher than the EU Member States, with an average of 15.7 % of electric passengers cars, and peaks at 26.5 % in Oslo og Viken and 22.1 % in Vestlandet regions. South-eastern European regions, such as in Greece and Czechia, have a share of electric passenger cars close to zero. The same can be observed for regions in Türkiye.
(% share in total passenger cars)
Source: Eurostat (tran_r_elvehst)
Stock of utility vehicles (lorries, road tractors and special vehicles)
The economic importance of the regions influences the stock of utility vehicles
The picture is quite different when looking at utility vehicles (lorries, road tractors and special vehicles excluding trailers and semi-trailers), where no systematic difference could be observed between western and eastern or northern and southern European regions. The share of utility vehicles in the total number of road vehicles (excluding trailers, semi-trailers and motorcycles) in a region depends on several factors. Among these are the regional transport systems and related infrastructure for different modes of freight transport, such as the capacity of motorways, railway lines, ports and airports. The economic characteristics of a region also play a role, i.e. whether the regional economy is dominated by manufacturing industries or services, and whether the region is located on key European freight corridors. The top 15 EU regions with the lowest shares of utility vehicles in total number of vehicles for which all data are available (excluding trailers, semi-trailers and motorcycles) were in German urbanised areas (ranging between 6.1 % and 7.3 %) (Figure 4).
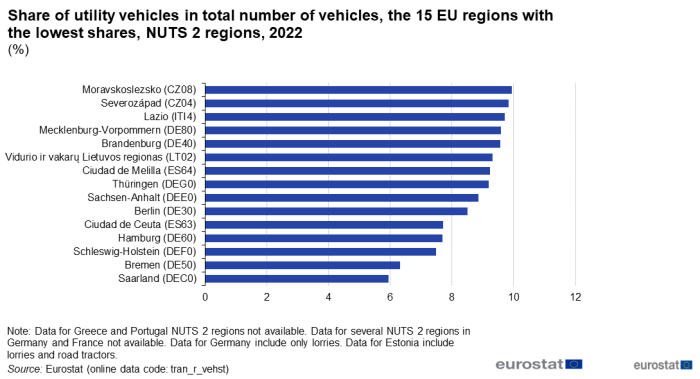
(%)
Source: (tran_r_vehst)
Figure 5 indicates that five of the 15 EU regions with the highest shares of utility vehicles in the total stock of vehicles in 2022 were located in Poland, ranging between 17.7 % (Łódzkie) and 20.9 % (Świętokrzyskie).
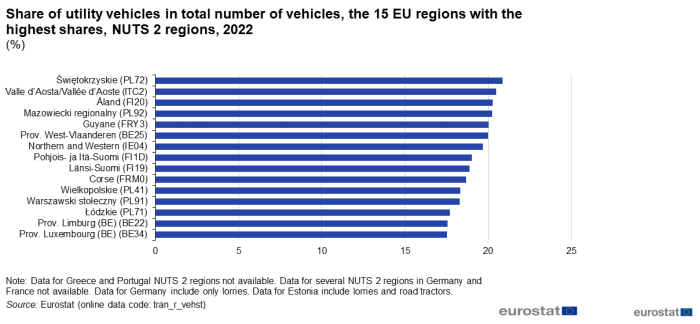
(%)
Source: Eurostat (tran_r_vehst)
Stock of road public transport
The eastern regions favour public road transport compared to western regions
On Map 3, we observe that the stock of road public transport (including motor coaches, buses and trolleybuses) per thousand inhabitants was higher in the eastern European regions, in contrast with the motorisation rate (i.e. stock of passenger cars) being higher in western European regions. This underlines that road public transport was used more in the eastern regions compared with the western regions where passenger cars were used the most. In 2022, among the EU Member States, the Province of Namur in Belgium recorded the highest stock of road public transport, with 5.0 motor coaches, buses and trolleybuses per thousand inhabitants, followed by Bucuresti - Ilfov in Romania with 4.8 motor coaches, buses and trolleybuses per thousand inhabitants. On the other hand, the regions in the Netherlands are the regions with the lowest stock of road public transport by having on average 0.4 motor coaches, buses and trolleybuses per thousand inhabitants. Türkiye recorded the highest stock of road public transport with numbers ranging from 14.0 to 4.4 motor coaches, buses and trolleybuses per thousand inhabitants in 2022.
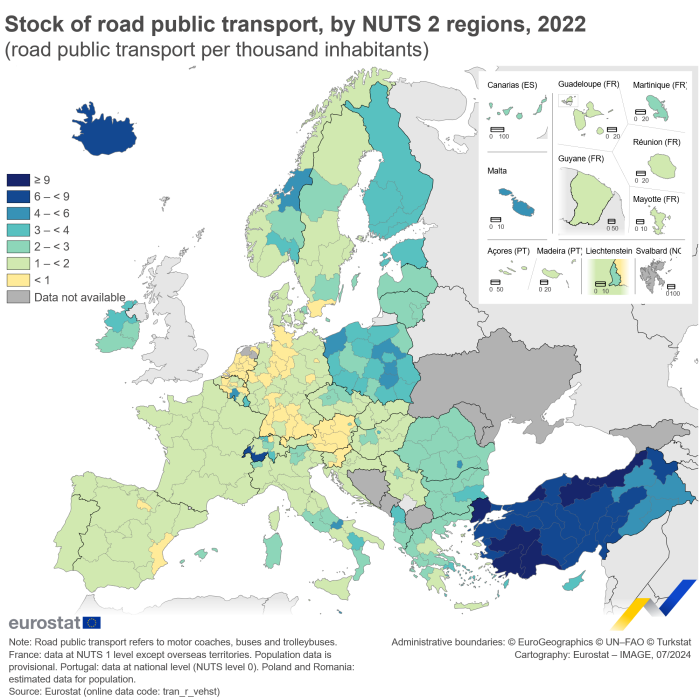
(road public transport per thousand inhabitants)
Source: Eurostat (tran_r_vehst)
Source data for tables and graphs
Data sources
Eurostat collects regional statistics on the infrastructure of road, railways and inland waterways, as well as vehicle stocks and road accidents. The data are provided by the EU Member States, the candidate countries and EFTA countries on a voluntary basis. The data are collected at NUTS 2 level.
Country-specific notes
The major events affecting comparability over time and possible discrepancies in the data are described in the Country Specific Notes.
Passenger cars
Road motor vehicle, other than a moped or a motor cycle, intended for the carriage of passengers and designed to seat no more than nine persons (including the driver). Included are:
- Passenger cars
- Vans designed and used primarily for transport of passengers
- Taxis
- Hire cars
- Ambulances
- Motor homes
- Micro-cars (needing no permit to be driven)
Excluded are light goods road vehicles, as well as motor-coaches and buses, and mini-buses/mini-coaches.
Number of passenger cars per inhabitants
For a given year, this indicator is calculated on the basis of the stock of vehicles as of 31st December and the population figures as of 1st January of the following year.
Electric vehicles
Electric vehicles refer to 'pure' electric vehicles (battery-electric vehicles - BEVs). Trolley buses, as electric vehicles per se, are included.
Excluded are the hybrid electric vehicles (HEVs), including plug-in hybrid electric vehicles (PHEVs) and the hydrogen-powered vehicles, the majority of which use a fuel-cell to generate electricity.
Utility vehicles
Utility vehicles correspond to the sum of lorries, road tractors and special vehicles. Trailers and semi-trailers are excluded. A lorry corresponds to a rigid road motor vehicle designed, exclusively or primarily, to carry goods. Road tractors are road motor vehicles designed, exclusively or primarily, to haul other road vehicles which are not power-driven (mainly semi-trailers). Agricultural tractors are excluded. Special purpose road motor vehicles are defined as road motor vehicles designed for purposes other than the carriage of passengers or goods. This category includes:
- Fire brigade vehicles
- Mobile cranes
- Self-propelled rollers
- Bulldozers with metallic wheels or track
- Vehicles for recording film, radio and TV broadcasting
- Mobile library vehicles
- Towing vehicles for vehicles in need of repair
- Other special purpose road motor vehicles.
Road public transport
Road public transport corresponds to motor-coaches, buses and trolley-buses which are passenger road motor vehicles designed to seat more than nine persons (including the driver). Included are mini-buses and mini-coaches designed to seat more than 9 persons (including the driver). This category includes:
- Motor coaches: passenger road motor vehicles designed to seat 24 or more persons (including the driver) and constructed exclusively for the carriage of seated passengers.
- Buses: passenger road motor vehicles designed to carry more than 24 persons (including the driver), and with provision to carry seated as well as standing passengers. The vehicles may be constructed with areas for standing passengers, to allow frequent passenger movement, or designed to allow the carriage of standing passengers in the gangway.
- Mini-buses / mini-coaches: passenger road motor vehicles designed to carry 10–23 seated or standing persons (including the driver). The vehicles may be constructed exclusively to carry seated passengers or to carry both seated and standing passengers.
- Trolleybuses: passenger road vehicles designed to seat more than nine persons (including the driver), which is connected to electric conductors and which is not rail-borne. This term covers vehicles which may be used either as trolleybuses or as buses, if they have a motor independent of the main electric power supply.
Regional breakdown
The Nomenclature of Territorial Units for Statistics (NUTS) was established by Eurostat more than 30 years ago in order to provide a single uniform breakdown of territorial units for the production of regional statistics for the European Union. From 1 May 2004, the regions in the 10 new EU Member States were added and from 1 January 2007 the regions of Bulgaria and Romania.
Data used are figures at different levels of NUTS 2021 as defined in the following legal acts:
- Regulation (EC) No 1059/2003 of the European Parliament and of the Council of 26 May 2003 on the establishment of a common classification of territorial units for statistics (NUTS);
- Regulation (EC) No 1888/2005 of the European Parliament and of the Council of 26 October 2005 amending Regulation (EC) No 1059/2003 on the establishment of a common classification of territorial units for statistics (NUTS) by reason of the accession of the Czech Republic, Estonia, Cyprus, Latvia, Lithuania, Hungary, Malta, Poland, Slovenia and Slovakia to the European Union;
- Commission Regulation (EC) No 105/2007 of 1 February 2007 amending the annexes to Regulation (EC) No 1059/2003 of the European Parliament and of the Council on the establishment of a common classification of territorial units for statistics (NUTS)
- Regulation (EC) No 176/2008 of the European Parliament and of the Council of 20 February 2008 amending Regulation (EC) No 1059/2003 on the establishment of a common classification of territorial units for statistics (NUTS) by reason of the accession of Bulgaria and Romania to the European Union.
- Commission Regulation (EU) No 31/2011 of 17 January 2011 amending annexes to Regulation (EC) No 1059/2003 of the European Parliament and of the Council on the establishment of a common classification of territorial units for statistics (NUTS).
- Commission Regulation (EU) No 1319/2013 of 9 December 2013 amending annexes to Regulation (EC) No 1059/2003 of the European Parliament and of the Council on the establishment of a common classification of territorial units for statistics (NUTS).
- Commission Regulation (EU) No 868/2014 of 8 August 2014 amending the annexes to Regulation (EC) No 1059/2003 of the European Parliament and of the Council on the establishment of a common classification of territorial units for statistics (NUTS).
- Commission Regulation (EU) 2016/2066 of 21 November 2016 amending the annexes to Regulation (EC) No 1059/2003 of the European Parliament and of the Council on the establishment of a common classification of territorial units for statistics (NUTS).
- Commission Delegated Regulation 2019/1755 of 8 August 2019 amending the Annexes to Regulation (EC) No 1059/2003 of the European Parliament and of the Council on the establishment of a common classification of territorial units for statistics (NUTS).
Certain smaller countries are not sub-divided in NUTS regions. This is the case for Estonia (EE), Cyprus (CY), Latvia (LV), Luxembourg (LU), Malta (MT), Liechtenstein (LI) and Iceland (IS).
For country codes see here.
Context
This article provides basic figures on the regional distribution of the stock of passenger cars, electric passenger cars, road utility vehicles and road public transport. However, these data are only part of the wider set of regional transport statistics available in Eurostat's databases. Regional transport statistics show patterns of variation across regions, where transport-related variables are often closely related to levels of economic activity. Transport policies are at the very heart of efforts to reduce regional inequality and improve regional cohesion. One of Eurostat's long-term objectives is to expand the current regional transport indicators in order to provide a better understanding of the impact of transport policies on economic growth, transport needs and the environment.
Direct access to
- Regional yearbook 2021 - Chapter 11, Transport
- Glossary for transport statistics (5th edition, 2019)
- Transport, see selected datasets:
- Multimodal data (tran)
- Regional transport statistics (tran_r)
- Transport, see detailed datasets:
- Multimodal data (tran)
- Regional transport statistics (tran_r)
- Stock of vehicles by category and NUTS 2 regions (tran_r_vehst)
- Regional transport statistics (tran_r)
- Regulation (EC) No 1059/2003 of the European Parliament and of the Council of 26 May 2003 on the establishment of a common classification of territorial units for statistics (NUTS);
- Summaries of EU legislation: Common classification of territorial units for statistical purposes (NUTS)
- Regulation (EC) No 1888/2005 of the European Parliament and of the Council of 26 October 2005 amending Regulation (EC) No 1059/2003 on the establishment of a common classification of territorial units for statistics (NUTS) by reason of the accession of the Czech Republic, Estonia, Cyprus, Latvia, Lithuania, Hungary, Malta, Poland, Slovenia and Slovakia to the European Union;
- Commission Regulation (EC) No 105/2007 of 1 February 2007 amending the annexes to Regulation (EC) No 1059/2003 of the European Parliament and of the Council on the establishment of a common classification of territorial units for statistics (NUTS)
- Regulation (EC) No 176/2008 of the European Parliament and of the Council of 20 February 2008 amending Regulation (EC) No 1059/2003 on the establishment of a common classification of territorial units for statistics (NUTS) by reason of the accession of Bulgaria and Romania to the European Union.
- Commission Regulation (EU) No 31/2011 of 17 January 2011 amending annexes to Regulation (EC) No 1059/2003 of the European Parliament and of the Council on the establishment of a common classification of territorial units for statistics (NUTS).
- Commission Regulation (EU) No 1319/2013 of 9 December 2013 amending annexes to Regulation (EC) No 1059/2003 of the European Parliament and of the Council on the establishment of a common classification of territorial units for statistics (NUTS).
- Commission Regulation (EU) No 868/2014 of 8 August 2014 amending the annexes to Regulation (EC) No 1059/2003 of the European Parliament and of the Council on the establishment of a common classification of territorial units for statistics (NUTS).
- Commission Regulation (EU) 2016/2066 of 21 November 2016 amending the annexes to Regulation (EC) No 1059/2003 of the European Parliament and of the Council on the establishment of a common classification of territorial units for statistics (NUTS).
- Commission Delegated Regulation 2019/1755 of 8 August 2019 amending the Annexes to Regulation (EC) No 1059/2003 of the European Parliament and of the Council on the establishment of a common classification of territorial units for statistics (NUTS).