Ensure availability and sustainable management of water and sanitation for all (statistical annex)
- Data extracted in October 2017. Most recent data: Further Eurostat information, Main tables. Planned article update: September 2018.
This article provides an overview of statistical data on SDG 6 ‘clean water and sanitation’ in the European Union (EU). It is based on the set of EU SDG indicators for monitoring of progress towards the UN Sustainable Development Goals (SDGs) in an EU context.
This article is part of a set of statistical articles, which are based on the Eurostat publication ’ Sustainable development in the European Union — Monitoring report on progress towards the SDGs in an EU context (2017 edition)’. This report is the first edition of Eurostat’s future series of monitoring reports on sustainable development, which provide a quantitative assessment of progress of the EU towards the SDGs in an EU context.
Population having neither a bath, nor a shower, nor indoor flushing toilet in their household
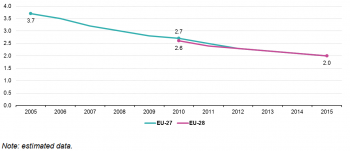
The share of the EU population having neither a bath, nor a shower, nor indoor flushing toilet in their household is already very low and has fallen noticeably since 2005.
(% of population)
Source: Eurostat online data code (sdg_06_10)
(% of population)
Source: Eurostat online data code (sdg_06_10)
The indicator shows the share of the total population having neither a bath, nor a shower, nor an indoor flushing toilet in their household. The data are collected through the EU Statistics on Income and Living Conditions (EU SILC). A bath, shower and indoor flushing toilet are basic household facilities. Their availability is important for healthy livelihoods and people’s well-being. Households without them are considered to be deprived [1]. Furthermore, accessibility to these facilities, specifically within one’s household, contributes to the end of open defecation, promoting a healthy environment and reducing human health risks.
On average 2.0 % of the EU population did not have access to a bath, a shower, nor an indoor flushing toilet in 2015 (see Figure 1), equalling around 10 million citizens, predominantly from a few eastern European countries. In most Member States these facilities were present in almost every household.
Poor people are more likely to lack basic sanitation facilities. Across the EU, 6.2 % of people earning less than 60 % of the median equivalised national income (the so-called poverty threshold) did not have a bath, a shower or an indoor flushing toilet in their household in 2015. For people with an income above the poverty threshold the rate was only 1.1 %.
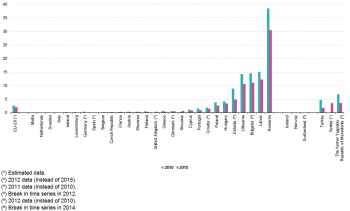
Despite the low EU average, a handful of countries had a considerably high share of people without a bath, shower or indoor flushing toilet (see Figure 2). Romania stands out as the most extreme case, with 30.5 % of the population lacking access to such basic facilities. Latvia, Bulgaria and Lithuania each reported figures above 10 %. Estonia, Hungary, Poland and Croatia made up a third group, with levels between 1 % and 5 %. For all other Member States, the rate was less than 1 %.
Particularly high shares were reported from poor people in the four countries at the bottom end of the spectrum. In Bulgaria, Latvia and Lithuania almost one-third of people living below the poverty threshold did not have access to basic sanitation facilities in 2015. The situation was worst in Romania, with almost two-thirds (64.7 %) of the poor population facing this situation. Notably, in this country almost 20 % of the wealthier people also lacked such access.
Population connected to at least secondary wastewater treatment
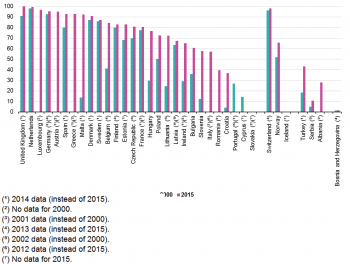
Since 2000, the share of the population connected to at least secondary wastewater treatment has increased in all Member States.
(% of population)
Source: Eurostat online data code (sdg_06_20)
This indicator shows the percentage of the population connected to wastewater treatment systems with at least secondary treatment. Secondary wastewater treatment generally involves biological treatment with a secondary settlement or other process to remove organic material. This reduces the wastewater’s biochemical oxygen demand (BOD) by at least 70 % and its chemical oxygen demand (COD) by at least 75 %. In comparison, primary treatment involves solely physical or chemical processes (such as sedimentation), which reduce BOD and suspended solids by only 20 % and 50 % respectively.
Rates of wastewater connection in the EU range from below 40 % in Croatia to 100 % in the United Kingdom. From 2013-2015, nine Member States reported that more than 90 % of the population were connected to at least secondary wastewater treatment plants, while 15 reported that this was the case for more than 80 %. Across the EU, the highest connection rates are generally observable in the ‘old’ (EU-15) Member States, which started to implement secondary treatment earliest across the EU after stricter wastewater policies were put in place.
European legislation recognises that it may not be suitable to connect 100 % of the population to a sewerage collecting system, either because it would produce no environmental benefit or would be too costly. In these cases, individual solutions or other appropriate systems which achieve the same level of environmental protection should be used. For example, in countries such as those in Scandinavia or the Alpine region, where settlements are small and scattered, secondary treatment may not be required. Therefore in Austria, Denmark, Finland or Sweden, for example, no further connection rates may be expected [2]. In contrast, in some ‘old’ EU Member States such as Ireland and France there is still room for improvement.
Biochemical oxygen demand in rivers
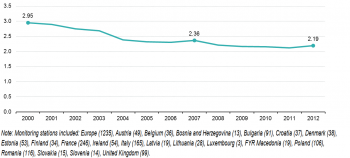
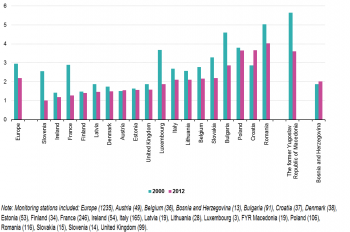
Since 2000, the biochemical oxygen demand (BOD) in European rivers has shown an average long-term decline of 2.5 % per year for reporting countries due to improved wastewater treatment.
(mg O2 per litre)
Source: Eurostat online data code (sdg_06_30)
(mg O2 per litre)
Source: Eurostat online data code (sdg_06_30)
Biochemical oxygen demand (BOD) is used to measure water quality and this indicator is defined as the annual mean of BOD5 in monitored European rivers. BOD5 is a measure of the amount of oxygen aerobic microorganisms use to decompose organic substances in a water sample over five days in the dark at 20 °C. High levels are usually a sign of organic pollution, which affects water quality. The cleanest rivers have a five-day BOD of less than 1 milligram per litre. Moderately and heavily polluted rivers show values ranging from 2 to 8 mg/L. Since 2000, BOD values have been measured at 1 235 river monitoring stations in 20 countries, of which 18 are EU Member States. The data presented in this section are collected by the European Environment Agency (EEA).
BOD in European rivers fell between 2000 and 2012, indicating improvement in water quality. The average yearly decrease in BOD from 2000 to 2012 was 2.5 % and 1.5 % from 2007 to 2012, indicating a slowing down of the improvement over time. Based on a statistical assessment by the EEA, from 1992 to 2012 the majority of river stations report a negative trend in BOD, while only a small share reported increases [3].
More than half of the reporting Member States had low BOD levels below 2.0 mg O2/L in 2012. Particularly low BOD concentrations of less than 1.4 mg/L were reported in Slovenia, Ireland and France. However, no country, even Slovenia which had the lowest concentration (1.02 mg/L), met the threshold for the cleanest river category of less than 1.0 mg/L BOD. On the other hand, eight countries had BOD levels greater than 2.0 mg/L and therefore have moderately to heavily polluted rivers; however, none exceeded the 8.0 mg/L upper limit for this category. Romanian rivers exhibited the highest levels of BOD concentration of 4.03 mg/L.
Some of the year-to-year variation in values measured at river stations can be explained by variation in precipitation and runoff. However, the long-term positive trend in BOD indicates that wastewater treatment (secondary and tertiary) has improved, which is a direct result of the implementation of the Urban Waste Water Treatment Directive. This trend could also indicate a possible reduction in untreated discharges and agricultural emissions (see the article on SDG 2).
Nitrate in groundwater
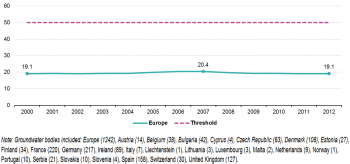
Since 2000, average nitrate concentrations in European groundwater bodies have remained within the EU drinking-water standard of 50 mg/L.
(mg NO3 per litre)
Source: Eurostat online data code (sdg_06_40)
(mg NO3 per litre)
Source: Eurostat online data code (sdg_06_40)
Nitrate can persist in groundwater for a long time. It can accumulate to high levels when inputs from anthropogenic sources (mainly agriculture) are steady and there can be some lag-time before groundwater concentrations reflect changes in input. Nitrate levels in groundwater are measured as milligrams of NO3 per litre (mg NO3/L), taken from well samples and aggregated to annual average values. According to the Drinking Water Directive, nitrate levels must not exceed 50 mg/L in groundwater that is used for drinking water. The Nitrates Directive requires the designation of vulnerable zones based on this threshold for all waters including groundwater. Furthermore, the Nitrates Directive links directly to the Water Framework Directive (Annex VI) and the Groundwater Directive (Annex IV, part B). The data presented in this section are collected by the European Environment Agency (EEA).
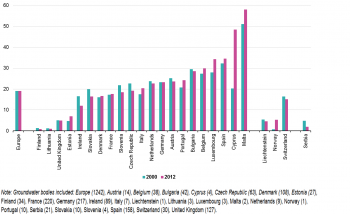
The average concentration of nitrate in European groundwater had been increasingly very slowly up to 2006 and 2007, reaching 20.4 mg/L, before starting to fall again, returning to its 2000 level of 19.1 mg/L in 2012. Despite the 1.3 mg/L reduction in nitrate contamination levels over the past five years, the lack of a longer-term improvement since 2000 suggests nitrates concentrations could still pose serious problems at regional or local level [4] .
In the majority of reporting EU countries, the nitrate concentrations in groundwater were above the European average of 19.1 mg/L but below the 50 mg/L concentration limit. However, nitrate levels are worsening in some Member States.
Malta with its scarce water resources and high population density was the only country with a groundwater nitrate concentration above the maximum limit. For Malta and Cyprus frequent fertiliser and manure application are the main reasons for the high values [5].
Phosphate in rivers
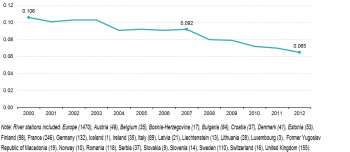
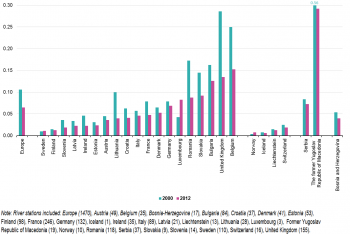
The average concentrations of phosphate in European rivers show a significant decrease over the period 2000 to 2012. This positive trend is a result of improvements in wastewater treatment and the introduction of phosphate-free detergents.
(mg PO4 per litre)
Source: Eurostat online data code (sdg_06_50)
(mg PO4 per litre)
Source: Eurostat online data code (sdg_06_50)
Phosphorus can be a limiting factor in some aquatic ecosystems and especially in freshwaters. Natural waters and wastewaters contain phosphorus predominately as phosphates. The most readily available form of phosphorus for biota is called ‘orthophosphate’ or ‘reactive phosphorus’. It is measured as milligrams of phosphate per litre (mg PO4/L) in the dissolved phase from water samples from river stations and aggregated to annual average values. At high levels it can cause water quality problems, such as eutrophication, by triggering the growth of macrophytes and algae. This process can lead to dangerously low oxygen levels, which, when occurring in lakes, can harm water oxygen dependant organisms such as macroinvertebrates and fish and ultimately reduce the ecological status of the water body. Additionally, high phosphate levels can affect the use of water bodies, whether a river, lake or reservoir, by humans, for example, for consumption or recreation. The main sources of phosphate in rivers are fertilisers, animal waste and wastewater containing phosphate, for example from the use of phosphate detergents. The data presented in this section are collected by the European Environment Agency (EEA).
The implementation of the Urban Waste Water Treatment Directive and the introduction of phosphate-free detergents have strongly contributed to the lower phosphate concentrations found in European rivers over the recent decades [6]. Additionally, the average phosphate concentration in running water in Europe has been decreasing at a higher annual rate over the last five years of measurements, showing an average reduction of 0.005 mg PO4/L per year.
Phosphate concentrations in rivers vary considerably across the EU due to population density and progress made in wastewater treatment with tertiary treatment (retention of phosphate). Concentrations have reduced in most countries since 2000, with values ranging from 0.01 mg PO4/l to 0.15 mg PO4/l in 2012. Phosphate levels are highest in the rivers in parts of central and eastern Europe, which are more exposed to agricultural pressures and population density. Eastern European rivers also show relatively high phosphate levels because not all treatment plants in those countries are equipped with tertiary treatment yet.
Water exploitation index
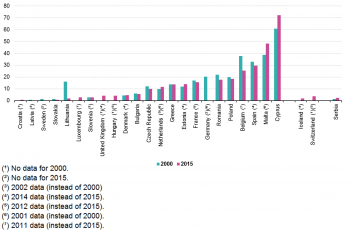
In 2015, water exploitation was at sustainable levels in 16 of the 20 Member States for which data are available. Two countries experienced severe water stress.
(% of long-term average available water (LTAA))
Source: Eurostat online data code (sdg_06_60)
The water exploitation index (WEI) presents the annual total fresh water abstraction in a country as a percentage of its long-term annual average available water (LTAA) from renewable fresh water resources (groundwater and surface water). Lower indicator values are associated with lower pressures on groundwater resources. Total fresh water abstraction includes water removed from any fresh water source, either permanently or temporarily. Mine water and drainage water as well as water abstractions from precipitation are included, whereas water used for hydroelectricity generation (in situ use) is excluded. Generally, the WEI’s information value is limited by the fact it is dependent on the weather and water use in the given year and does not consider returns to the system. The minimum period taken into account for the calculation of long-term annual averages is 20 years. Values above 20 % indicate a region is suffering water stress, with severe scarcity occurring where the WEI exceeds 40 %.
At the annual time scale, water stress in Member States is so far still a rare observation. The water exploitation index values for Cyprus and Malta are above the severe water scarcity threshold of 40 %, and have been worsening since 2000. A further two countries are above the 20 % threshold: Belgium and Spain. Apart from Belgium, all of these countries are located in the water scarce Mediterranean region.
Belgium’s situation can be explained by the fact that a large part (66.2 % in 2011 [7]) of the abstracted water is used for cooling purposes in nuclear energy generation [8]. Because the country has a relatively small amount of available renewable freshwater [9], the share of abstracted water appears disproportionately high. While the cooling water is redirected to rivers after use (returns) in some countries, the indicator sums up all abstracted water shares without this distinction.
Comparing the indices for 2000 and 2015, seven reporting countries (five of them being EU Member States) showed an increasing trend regarding the pressure on water resources from total water demand. Interestingly, the data do not show a clear-cut distinction between the dry and thus water-stressed region of southern Europe and the wetter North. This might be due to the second shortcoming of the indicator, that it does not take into account the temporally and regionally varying precipitation patterns.
To overcome the shortcomings of the water exploitation index, the European Environment Agency is working on an improved indicator, the water exploitation index + (WEI+). By applying the WEI+ indicator, it could be shown that around 13 river basin districts in the Mediterranean region, including Greece, Portugal and Spain, were facing water stress conditions in 2014 [10].
See also
Further Eurostat information
Database
- Socioeconomic Development
Dedicated section
Methodology
More detailed information on EU SDG indicators for monitoring of progress towards the UN Sustainable Development Goals (SDGs), such as indicator relevance, definitions, methodological notes, background and potential linkages, can be found in the introduction of the publication ’ Sustainable development in the European Union — Monitoring report on progress towards the SDGs in an EU context (2017 edition)’.
Notes
- In addition to no bath or shower and no indoor toilet, housing deprivation may also result from other problems such as a leaking roof or a dark dwelling. ↑
- European Commission, 2016, Eighth Report on the Implementation Status and the Programmes for Implementation (as required by Article 17) of Council Directive 91/271/EEC concerning urban waste water treatment, p.4. ↑
- European Environment Agency (2015), Oxygen consuming substances in rivers (CSI 019/WAT 002) — Assessment, published February 2015, accessed on 10 March, 2015. ↑
- More specific information on nitrates from agriculture can be found in the four-yearly report from the Commission to the Council and the European Parliament on the implementation of Council Directive 91/676/EEC (the Nitrates Directive) concerning the protection of waters against pollution caused by nitrates from agricultural sources. ↑
- See: Christophi C., Constantinou C. (2011), Nitrogen sources and denitrification potential of Cyprus aquifers, through isotopic investigation on nitrates. In: Lambrakis N., Stournaras G., Katsanou K. (eds) Advances in the Research of Aquatic Environment, Environmental Earth Sciences. Springer, Berlin, Heidelberg.
Stuart M E, P J Chilton and T H E Heaton (2008), A preliminary study on the nitrate contamination in groundwater in Malta; Conclusions and policy recommendations, British Geological Survey Commissioned Report, CR/08/160. 25pp. ↑ - European Environment Agency (2017), Nutrients in freshwater. ↑
- Eurostat, Statistics Exaplined, Water Use in Industry. ↑
- Share of 38 % on overall energy production in 2014, World Nuclear Association (2017), Nuclear Power in Belgium. ↑
- Eurostat, Statistics Explained, Water statistics ↑
- EEA, 2017: Use of freshwater resources ↑


