Archive:Agriculture and environment - pollution risks
- Data extracted in August 2016 Most recent data: Further Eurostat information, Main tables and Database.
This article is part of a set of statistical articles based on the Eurostat publication Agriculture, forestry and fishery statistics.Agriculture has traditionally been the major land use activity in Europe. Over the years farming had to become more intensive in order to increase food production and land productivity, to meet the needs of society and consumers' expectations of food availability. This profound shift also has environmental impacts, especially through the increased use of nutrients in agricultural production. The nutrient use can be monitored by looking at indicators such as the ‘gross nutrient balance’.

(kg N per ha of utilised agricultural area)
Source: Eurostat (aei_pr_gnb)

(kg P per ha of utilised agricultural area)
Source: Eurostat (aei_pr_gnb)

(kg N per ha of utilised agricultural area)
Source: Eurostat (aei_pr_gnb)

(kg P per ha of utilised agricultural area)
Source: Eurostat (aei_pr_gnb)

(%)
Source: Eurostat (aei_pr_gnb)
(%)
Source: Eurostat (aei_pr_gnb)

(%)
Source: Eurostat (aei_pr_gnb)

(%)
Source: Eurostat (aei_pr_gnb)

(%)
Source: Eurostat (aei_pr_gnb)

(%)
Source: Eurostat (aei_pr_gnb)
(2000 = 100)
Source: Eurostat (aei_pr_gnb)
(2000 = 100)
Source: Eurostat (aei_pr_gnb)
(total nutrient outputs/total nutrient inputs)
Source: Eurostat (aei_pr_gnb)
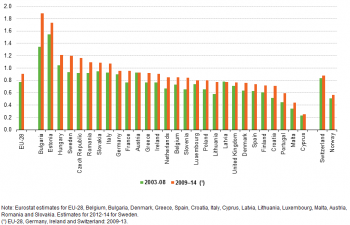
(total nutrient outputs/total nutrient inputs)
Source: Eurostat (aei_pr_gnb)
Main statistical findings
Gross nutrient balance
The gross nutrient balance provides an insight into the links between the use of agricultural nutrients, their losses to the environment, and the sustainable use of soil nutrients resources.
It consists of the gross nitrogen balance and the gross phosphorus balance and is intended to be an indicator of the potential threat of surplus or deficit of two important soil and plant nutrients in agricultural land. It shows the link between agricultural activities and the environmental impact, identifying the factors determining the nutrients surplus or deficit and the trends over time.
Nitrogen (N) and phosphorus (P) are key elements for plants to grow. Their presence or absence in soils can be an indicator of land use intensity and soil quality. Intensive farming is a balancing act: excessive fertiliser application can cause pollution of the environment, whereas insufficient fertiliser to replace nitrogen and phosphorus lost through intensive cropping can lead to soil degradation and loss of fertility. Furthermore, phosphorus is a limited resource of increasing concern in Europe. As a result, the EU is considering strategic action to use phosphorus more sustainably, for example by improving application and sewage treatment techniques, recycling from organic sources such as manure, sewage sludge and compost and introducing the concepts of a circular economy.
A persistent surplus of nutrients indicates potential environmental problems, such as ammonia emissions (contributing to acidification, eutrophication and atmospheric particulate pollution), nitrous oxide emissions (a potent greenhouse gas ), or nitrogen and phosphorus leaching (resulting in pollution of drinking water and eutrophication of surface waters). On the other hand, a persistent deficit in nutrients indicates the risk of a decline in soil fertility.
The gross nutrient balance can only indicate the total potential risk to the environment (air, water and soil), as the actual risk depends on many factors including climate conditions, soil type and soil characteristics, soil saturation, and management practices such as drainage, tillage, irrigation, etc.
The input side of the balance includes all nitrogen and phosphorus supplied to the soil. The output side of the balance presents the nutrient uptake by harvested (and grazed) crops and fodder and crop residues removed from the field, i.e. the agricultural production from the soil. Sustainability could be defined as preserving and/or improving the level of production without degrading the natural resources. The harvest and grazing of crops and fodder means that nitrogen and phosphorus are removed from the soil. In order to sustain soil fertility, this removal of nutrients in principle should be compensated by supplying the same amount of nitrogen and phosphorus. Fertilisers and manure are therefore necessary to supply the crops with the nutrients they need for growing.
However, there are certain complications. Not all of the nutrients in fertilisers and manure reach the plant; part of the nitrogen is lost due to volatilisation in animal housing , storage and with the application to the land. Organic nitrogen in manure needs to first be mineralised before it is available to the plant, which means that part of the nitrogen does not become available to the plant in the year when it is applied. Yield and therefore also the uptake of nutrients by crops is determined not only by inputs but also by uncontrollable factors such as climate. Furthermore, the risk of nutrient leaching and run-off depends not only on the excess nutrients but also on the type of soil, precipitation rates, soil saturation, temperature, etc.
Phosphorus, contrary to nitrogen, is a finite resource (in the sense that phosphate ores are becoming depleted). After being used in agriculture, the mineral ultimately becomes unavailable for reuse due to the sewage treatment techniques widely in use, or is be reused only to a very limited extent. The sludge from sewage treatment plants is largely incinerated or composted but is not used on farm lands due to risk for heavy metals and other chemicals and is thereby removed from the agricultural cycle. Phosphorus builds up in agricultural soils, but is through erosion ending up in the sediments of lakes, coastal seas and the ocean. The natural recycling from ocean sediments takes place during periods of millions of years. The EU is almost entirely dependent on imports of phosphate; very little is mined in the EU. Import takes place in two forms: mineral fertilisers and animal feed. It is important to note that the EU, contrary to what is usually assumed, is not self-sufficient in food production due to this phosphate dependency. A sustainable use of phosphorus is needed to ensure food supply in the future and to reduce negative impacts of waste of natural resources on the environment. These include amongst others appropriate fertilisation practices, reduction of imbalances in phosphorus inputs and outputs to agricultural soils, recovery of phosphorus from sewage for fertilisation.
Table 1 and Table 2 show the gross nutrient balance per hectare of utilised agricultural area (UAA) in EU-28 Member States as well as Norway and Switzerland during the 1995–2014 period. Due to the different methods of calculation used in different countries, the figures are not directly comparable between countries but give an indication of the nutrient balance's relative importance, and can be followed for a given country over time.
In most EU Member States, with the exception of Cyprus, Austria, Latvia, Slovakia, Hungary and Portugal, the average gross nitrogen balance (GNB) per ha of UAA between 2009 and 2014 was lower than between 2003 and 2008 (see Figure 1). In the 2009–14 period, the average GNB per ha was the highest in Cyprus (187.5 kg N/ha), followed by the Malta (156.0 kg N/ha) Netherlands (154.3 kg N/ha), Belgium (137.8 kg N/ha), and Luxembourg (127.7 kg N/ha). By contrast, the nitrogen surplus was the lowest in Romania (4.2 kg N/ha), Bulgaria (19.0 kg N/ha), Latvia (26.5 kg N/ha) and Estonia (26.8 kg N/ha).
Average gross phosphorus balance (GPB) per ha of UAA between 2009 and 2014 decreased compared to the 2005–08 period in all EU Member States except Cyprus, Latvia and Austria. The highest average GPB in 2009–14 was in Cyprus (30.5 kg P/ha), Malta (30.3 kg P/ha), Norway (10.0 kg P/ha) and Denmark (7.3 kg P/ha). The biggest gross phosphorus deficit was estimated for Estonia (with –6.3 kg P/ha) and Bulgaria (–5.7 kg P/ha) (see Figure 2).
The gross nitrogen balance for the EU-28 aggregate decreased between 2000 and 2013 from 63 to 51 kg nitrogen per ha of UAA, whereas the gross phosphorus balance in the same period decreased from 6 to 2 kg phosphorus per ha of UAA.
Nutrient inputs
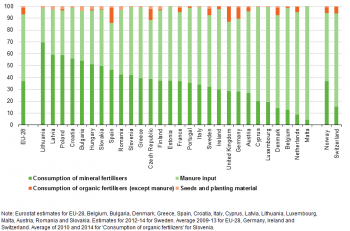
The input side of the gross nitrogen balance consists of nitrogen supplied in mineral fertilisers and manure, other organic fertilisers (excluding manure), seeds and planting material, atmospheric deposition and biological nitrogen fixation (see Figure 3). Mineral fertilisers and manure accounted for over 83.2 % of the average nitrogen input in the EU-28 between 2009 and 2014. The level of atmospheric deposition is dependent on ammonia (NH3) (of which agriculture is the main source) and nitrogen oxides (NO and NO2) emissions (where the contribution of agriculture is not significant) as well as climate conditions (transport through air to other regions). Atmospheric deposition on average accounted for 8.3 %, whereas the biological nitrogen fixation was 6.2 % of total inputs in the EU-28 between 2009 and 2014. The reuse of nitrogen through the use of compost, sewage sludge, industrial waste etc. was insignificant. The nitrogen input with other organic fertilisers (excluding manure) represented only 1.4 % of total inputs in the EU-28 between 2009 and 2014. Seeds and planting material did not have a significant influence on the nitrogen balance either, with a share of less than 0.9 % on the total nitrogen inputs.
Figure 3 also shows the large differences between EU Member States in the use of inputs. The type of fertiliser used (mineral fertilisers, manure, or other organic fertilisers) have different impacts on the environment:
- Nitrogen volatilises from manure in animal housing, storage and with the application to the land. These emissions mainly depend on the type of manure, farm management practices like type of animal housing, manure storage, timing and application techniques.
- Nitrogen emissions from mineral fertilisers during the application to the land depend on type of fertiliser, farm management practices (like application techniques), timing and other factors (such as soil type, and weather conditions).
- Other potential fertilisers like urban wastes often contain health hazards (to both crops and humans), but procedures commonly used to reduce these hazards (such as composting) tend to reduce the fertiliser value (e.g. through leaching/volatilisation).
- Mineral fertilisers are produced using high amounts of energy. The production of these fertilisers therefore contributes to greenhouse gas (GHG) emissions and fossil fuel depletion.
- Some environmental pollution due to the production of P mineral fertilisers are related to the contamination of phosphate rock with heavy metals, uranium and other elements. Once released to the environment or transferred to soils, these may pose a risk to ecosystems and humans.
Figure 4 shows that the vast majority (93.2 %) of phosphorus input in the EU-28 between 2009 and 2014 comes from manure and mineral fertilisers. The rest was supplied with other organic fertilisers (5.4 %) and seeds and planting material (1.4 %).
Manure production is determined by the amount and type of livestock in a country. Figure 5 shows that cattle was the main source of manure nitrogen production with more than 50 % in all countries, except Denmark, Bulgaria, Croatia, Malta, Spain, Hungary and Romania, — where different livestock types were important — and in Greece and Cyprus where sheep and goats had the highest share. A similar situation can be identified throughout the EU Member States regarding the phosphorus in manure production (Figure 6).
Nutrient outputs
The removal of nutrients through harvest and grazing of crops and forage varies between EU Member States as can be seen in Figures 7 and 8. The dominant share of total nutrient output for nitrogen in the EU-28 in the 2009–14 period was the nutrient uptake with fodder (48 %) followed by cereals (35 %) while in the case of phosphorus the shares from cereals and fodder were similar (38 % and 36 %, respectively). Nutrient output is dependent on cropping patterns, yields, farm management practices (tillage, irrigation, etc.), climate etc. There are significant differences between countries. In some (Ireland, Slovenia, the Netherlands, Luxembourg, Latvia, Malta, Portugal, Belgium, the United Kingdom, France and Sweden as well as Norway and Switzerland) harvest and grazing of fodder dominates the nutrient outputs, whereas in Hungary, Croatia, Bulgaria, Slovakia, the Czech Republic and Lithuania cereals are the dominant crops. Permanent crops are significant in the Mediterranean countries.
Nutrient use efficiency ratio
Another way of presenting the results of the gross nutrient balance is the nutrient use efficiency ratio, which is defined as total nutrient outputs divided by total nutrient inputs. It gives an indication of the relative utilization of nutrients applied to agricultural production system.
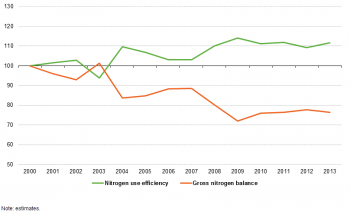
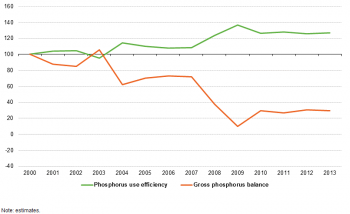
In principle, by decreasing the nutrient surplus over time, the nutrient use efficiency increases. Figures 9 and 10 show that the overall nitrogen use efficiency in EU-28 increased by 12 % between 2000 and 2013, whereas the phosphorus use efficiency in the same period increased by 27 %. This can be interpreted as improved utilisation of nutrients applied to the field in a considerable number of, which was linked mostly to improvements in crop and soil management practices, most importantly the fertilizer application techniques.
The phosphorus use efficiency in the same period increased by 27 %. This can be interpreted that in considerable number of countries the utilization of nutrients applied to the field was improved, which was linked mostly to improvements in crop and soil management practices, most importantly the fertilizer application techniques.
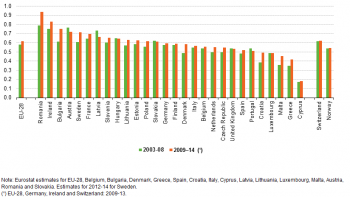
Figures 11 and 12 show that in most countries the average nutrient use efficiency between 2009 and 2014 increased compared to the 2003–08 period. However, the highest value of nutrient use efficiency does not necessarily mean the best and desirable results. Rates which are close to or above 1.0 indicate a risk of soil depletion, as the nutrient uptake by crops exceeds the amount of nutrients applied to the soil. From a longer-term perspective, this trend cannot be considered sustainable. In some countries with very high average nutrient use efficiency in the period 2003–08 and 2009–14, the gross nutrient balance was, in fact, very low. For nitrogen, Romania is an example of this. For phosphorus in some EU Member States with very high nutrient use efficiency the phosphorus surplus was even negative. This was mostly because in the Central and East European countries the use of fertilizers dropped drastically in the late 1980s and early 1990s as a result of political and economic changes.
At the opposite end of the scale were countries with the lowest nutrient use efficiency like Cyprus, Greece, Malta and Croatia, in which the gross nutrient surplus was high. This was a result of the fact that the nutrient input in these countries exceeded considerably the total crop demand of agricultural production. This of course indicates a very high risk of nutrient losses with potential pollution of the environment.
Achieving sustainable agricultural production requires balancing nutrient inputs with the outputs of the system. Reducing the nutrient surplus decreases the potential for adverse effect on the environment. Nonetheless, on average, European agricultural soils are still oversupplied with nutrients, mainly nitrogen.
Data sources and availability
The gross nutrients balance and the gross phosphorus balance are 2 of 28 agro-environmental indicators adopted by European Commission Communication COM(2006) 508 final in 2006 to monitor the integration of environmental concerns into the common agricultural policy.
The methodology of the nutrient balances is described in the Eurostat/OECD Gross Nutrient Balance Handbook. The gross nutrient balance lists all inputs and outputs and calculates the gross nutrient surplus (or deficit) as the difference between total inputs and total outputs. The gross nutrient balance per hectare is derived by dividing the total gross nutrient surplus by utilised agricultural area (UAA).
The inputs of the gross nutrient balance are nutrients supplied in:
- mineral fertilisers;
- manure;
- other organic fertilisers (excluding manure);
- seeds and planting material;
- atmospheric deposition;
- biological nitrogen fixation.
The outputs of the gross nutrient balance are nutrients removed with:
- harvest of crops (cereals, dried pulses, root crops, industrial crops, vegetables, fruit, ornamental plants, other harvested crops);
- harvest and grazing of fodder (fodder from arable land, permanent and temporary pasture consumption);
- crop residues removed from the field.
The nutrient inputs and outputs have been estimated for each item of the balance from basic data by multiplying with coefficients to convert the data into nutrient content. Basic data (fertiliser consumption, livestock numbers, crop production, utilised agricultural area) are mostly derived from agricultural statistics. Coefficients are mainly estimated by research institutes and can be based on models, statistical data, measured data as well as expert judgements. Various other sources, for example FAOSTAT database, national inventory submissions to UNFCCC and to UNECE-CLRTAP , or EMEP modelled data have also been used.
Due to methodological issues or missing data, the estimates of nitrogen and phosphorus balances reported here have been calculated by Eurostat for Belgium, Bulgaria, Denmark, Greece, Spain, Italy, Cyprus, Latvia, Lithuania, Luxembourg, Malta, Austria, Romania, Slovakia and Sweden.
Context
Climatic conditions have a big impact on the nutrient balance through the influence on yield and therefore on output of nutrients. For example, drought that occurs during the most critical stages of plant growth is the most limiting factor to crop growth, in turn negatively affecting the nutrient use efficiency. Climate and weather conditions are beyond the control of the farmer. To diminish the effect of weather conditions on the balance the results presented with regards to the nutrient balance are mostly presented not referring to a particular year but as an average for a certain period.
The quality and accuracy of the estimated gross nutrient balance is depending on the quality and accuracy of underlying data and coefficients used. At present the methodology for calculating the various coefficients vary between countries (expert judgment vs complex models based on statistical data). This is also the case for the updating procedures, as to take into account the effect of mitigation actions, other than reducing the level of production, in the estimations, coefficients need to be updated regularly to reflect changes in farming practices. As methodologies and also the data sources used in countries vary substantially, the balances are only consistent within a country across time. The gross nutrient balances are not consistent across EU Member States which means that caution should be taken when comparing data between them.
A single indicator (especially the gross phosphorus balance indicator) is not enough to capture the complexity of soil balance, which is influenced by historical balance, climate conditions, soil type and soil characteristics, management practices such as drainage, tillage, irrigation. In the future the indicator might be complemented by an additional sub-indicator called ‘Vulnerability to Phosphorus leaching and run-off’ in order to present further elements able to summarise each EU Member State’s situation.
See also
- Agri-environmental indicators (online publication)
Further Eurostat information
Publications
- Agriculture, forestry and fishery statistics — 2015 edition (Statistical book)
- Analysis of methodologies for calculating greenhouse gas and ammonia emissions and nutrient balances (Statistical working papers)
- Environmental statistics and accounts in Europe - 2010 edition
Database
- Pressures and risks (aei_pr)
- Gross Nutrient Balance (aei_pr_gnb)
Dedicated section
Methodology / Metadata
- Eurostat/OECD Gross Nutrient Balance Handbook
- Gross Nutrient Balance (ESMS metadata file — aei_pr_gnb_esms)
Source data for tables and figures (MS Excel)
Other information
- Commission Communication COM(2006) 508 final - Development of agri-environmental indicators for monitoring the integration of environmental concerns into the common agricultural policy
- Commission staff Working Document SEC(2006) 1136 on the development of agri-environmental indicators for monitoring the integration of environmental concerns into the common agricultural policy
External links
- European Centre of the International Nitrogen Initiative
- European Commission - The Common Agricultural Policy CAP
- European Nitrogen Assessment[1]
- FAO - FAOSTAT
- Global Partnership on Nutrient Management
- Global Programme of Action for the Protection of the Marine Environment from Land-based Activities GPA)
- OECD - Agri-environmental Indicators and Policies
- Our Nutrient World[2].
- Too much of a good thing[3]
- United Nations Environment Programme UNEP
Notes
- ↑ Mark A. Sutton, et al (eds). The European Nitrogen Assessment, Cambridge, 2011
- ↑ Sutton M.A. et al. Our Nutrient World. The challenge to produce more food, energy with less pollution. Key Messages for Rio+20. Centre for Ecology; Hydrology, 2012.
- ↑ Mark A. Sutton, Oene Oenema, Jan Willem Erisman, Adrian Leip, Hans van Grinsven; Wilfried Winiwarter. Too much of a good thing. Nature, Volume: 472, Pages: 159–161, 2011