Archive:Income poverty statistics
- Data extracted in May 2015. Most recent data: Further Eurostat information, Main tables and Database. Planned article update: February 2016.
(%)
Source: Eurostat (ilc_li04)
(% of specified population)
Source: Eurostat (ilc_li03)
(%)
Source: Eurostat (ilc_li02) and (ilc_li10)
(income quintile share ratio)
Source: Eurostat (ilc_di11)
(ratio of the median equivalised disposable income of people aged 65 and above to the median equivalised disposable income of those aged below 65)
Source: Eurostat (ilc_pnp2)
This article analyses recent statistics on monetary poverty and income inequalities in the European Union (EU). Comparisons of standards of living between countries are frequently based on gross domestic product (GDP) per capita, which presents in monetary terms how rich one country is compared with another. However, this headline indicator says very little about the distribution of income within a country and also fails to provide information in relation to non-monetary factors that may play a significant role in determining the quality of life of a particular population. On the one hand, inequalities in income distribution may create incentives for people to improve their situation through work, innovation or acquiring new skills. On the other hand, such income inequalities are often viewed as being linked to crime, poverty and social exclusion.
Main statistical findings
At-risk-of-poverty rate and threshold
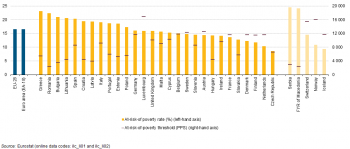
In 2013, 16.6 % of the EU-28 population was assessed to be at-risk-of-poverty after social transfers (see Figure 1). This share, calculated as a weighted average of national results, conceals considerable variations across the EU Member States. In five Member States, namely Greece (23.1 %), Romania (22.4 %), Bulgaria (21.0 %), Lithuania (20.6 %) and Spain (20.4 %), one fifth or more of the population was viewed as being at-risk-of-poverty; this was also the case in Serbia (24.5 %) and the former Yugoslav Republic of Macedonia (24.2 %). The lowest proportions of persons at-risk-of-poverty were observed in the Netherlands (10.4 %) and the Czech Republic (8.6 %). Norway (10.9 %) and Iceland (9.3 %) also reported relatively low shares of their respective populations as being at-risk-of-poverty.
The at-risk-of-poverty threshold (also shown in Figure 1) is set at 60 % of national median equivalised disposable income. It is often expressed in purchasing power standards (PPS) in order to take account of the differences in the cost of living across countries. This threshold varied considerably among the EU Member States in 2013 from PPS 2 361 in Romania, PPS 3 540 in Bulgaria and PPS 3 868 in Latvia to a level between PPS 11 507 and PPS 12 542 in Finland, France, the Netherlands, Denmark, Germany, Belgium, Sweden and Austria, before peaking in Luxembourg at PPS 16 818; the poverty threshold was also relatively low in the former Yugoslav Republic of Macedonia (PPS 2 396) and Serbia (PPS 2 863) and high in Switzerland (PPS 15 439) and Norway (PPS 16 069).
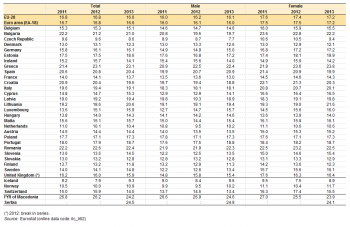
The at-risk-of-poverty rate (after social transfers) in the EU-28 remained almost stable between 2011, 2012 and 2013 (see Table 1). Between 2012 and 2013, the at-risk-of-poverty rate decreased by at least 1.0 percentage points in the Czech Republic, Finland and Ireland. In total, 10 other Member States reported decreases between 2012 and 2013, ranging from -0.9 percentage points in Croatia to -0.1 percentage points in the United Kingdom. Switzerland reported a decrease in the at-risk-of-poverty rate (-1.4 percentage points) in 2013 compared with the previous year, as did the former Yugoslav Republic of Macedonia (-2.0 percentage points). In three Member States, namely, Germany, Greece and Austria, the at-risk-of poverty rate was unchanged. By contrast, the largest increases between 2012 and 2013 occurred in Lithuania (an increase of 2.0 percentage points), Estonia (1.1 percentage points) and Slovenia (1.0 percentage points), while Iceland (1.4 percentage points) also reported a comparably high increase.
Different groups in society are more or less vulnerable to monetary poverty. There was a relatively small difference in the at-risk-of-poverty rate (after social transfers) for the two sexes in the EU-28 in 2013: 16.1 % for males compared with 17.2 % for females. The largest difference (2.7 percentage points) was observed in Sweden and in Estonia. In 2013, Germany, Lithuania, Cyprus and Bulgaria also reported at-risk-of-poverty rates for females that were more than 2.0 percentage points higher than for males, while in Switzerland the difference was 2.1 percentage points. By contrast, there were four EU Member States where the at-risk-of-poverty rate was slightly higher among men than women, namely Portugal, Denmark, Hungary and Spain, and this was also the case in Iceland, the former Yugoslav Republic of Macedonia and Serbia.
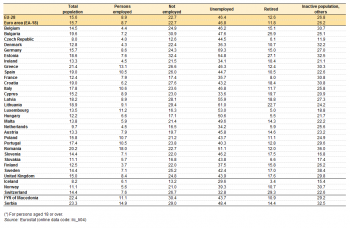
The differences in poverty rates were wider when the population was classified according to activity status (see Table 2). The unemployed are a particularly vulnerable group: almost half (46.4 %) of all unemployed persons in the EU-28 were at-risk-of-poverty in 2013, with by far the highest rate in Germany (69.3 %), while six other Member States (Hungary, Romania, Luxembourg and the three Baltic Member States) reported that more than half of the unemployed were at-risk-of-poverty in 2013. Almost one in seven (12.6 %) retired persons in the EU-28 were at-risk-of-poverty in 2013; rates that were at least twice as high as the EU-28 average were recorded in Estonia (27.1 %) and Bulgaria (25.9 %). Those in employment were far less likely to be at-risk-of-poverty (an average of 8.9 % across the whole of the EU-28). There were relatively high proportions of employed persons at-risk-of-poverty in Romania (18.0 %) and to a lesser extent in Greece (13.1 %) and Luxembourg (11.2 %), while Poland, Italy, Portugal and Spain each reported that in excess of 1 in 10 members of their respective workforces were at-risk-of-poverty in 2013.
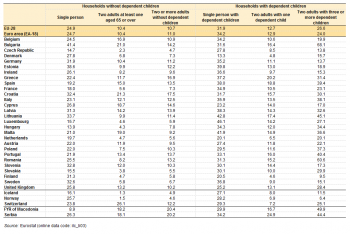
At-risk-of-poverty rates are not uniformly distributed between households with different compositions of adults and dependent children, as can be seen from Table 3. For the EU-28 as a whole, single person households with dependent children were the group most at-risk-of-poverty (31.9 %), followed by households with two adults and three or more dependent children (26.6 %) and single person households (24.9 %). On the other hand, persons living in households with two adults with at least one aged 65 or over (10.4 %) followed by those living in households with two or more adults without dependent children were the least at-risk (10.7 %), as well as households with two adults and one dependent child (12.7 %). In summary, the greater the number of dependent children living in a household (with either two adults or a single person), the greater the risk of poverty. This was more or less the picture in most EU Member States, although there were some exceptions. In Bulgaria, Spain, Italy, Lithuania, Hungary, the Netherlands, Poland, Portugal, Romania and the United Kingdom, the most at risk were those living in households composed of two adults with three or more dependent children; this was also the case in the former Yugoslav Republic of Macedonia and Serbia. Moreover, in Denmark, Finland, Bulgaria, Cyprus, Slovenia, Croatia and the United Kingdom the percentage of the population that was found to be at-risk-of-poverty in single person households without dependent children was higher than the percentage of those found in single person households with dependent children.
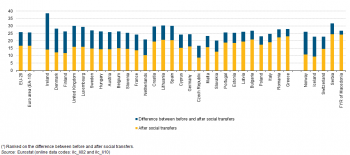
Social protection measures can be used as a means for reducing poverty and social exclusion. This may be achieved, for example, through the distribution of benefits. One way of evaluating the success of social protection measures is to compare at-risk-of-poverty indicators before and after social transfers (see Figure 2). In 2013, social transfers reduced the at-risk-of-poverty rate among the population of the EU-28 from 25.9 % before transfers to 16.6 % after transfers, thereby lifting 9.3 % of persons that would otherwise be at-risk-of-poverty above the poverty threshold. Measured in this way, the relative impact of social benefits was lowest in Greece, Romania, Italy, Poland and Bulgaria, as well as in the former Yugoslav Republic of Macedonia. By contrast, half or more of all persons who were at-risk-of poverty in the Netherlands, Finland, Denmark and Ireland moved above the threshold as a result of social transfers, as was also the case in Iceland and Norway.
Income inequalities
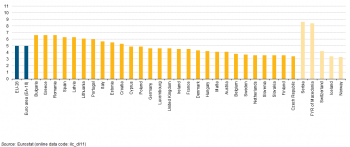
Governments, policymakers and society in general cannot combat poverty and social exclusion without analysing the inequalities within society, whether they are economic or social in nature. Data on economic inequality become particularly important for estimating relative poverty, because the distribution of economic resources may have a direct bearing on the extent and depth of poverty (see Figure 3). There were wide inequalities in the distribution of income in 2013: as a population-weighted average of EU-28 Member States’ national figures the top 20 % (highest equivalised disposable income) of a Member State’s population received 5.0 times as much income as the bottom 20 % (lowest equivalised disposable income) of the Member State’s population. This ratio varied considerably across the EU-28 Member States, from 3.4 in Czech Republic, to at least 6.0 in Portugal, Lithuania, Latvia and Spain, peaking at 6.6 in Romania, Greece and Bulgaria. Among the non-member countries shown in Figure 3, Norway (3.3) and Iceland (3.4) also reported particularly low ratios, while in Serbia (8.6) and the former Yugoslav Republic of Macedonia (8.4) the ratios were considerably higher than in any of the EU Member States.
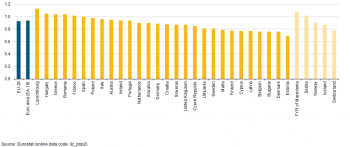
There is policy interest in the inequalities felt by many different groups in society. One group of particular interest is that of the elderly, in part reflecting the growing proportion of the EU’s population that is aged 65 and over. Pension systems can play an important role in addressing poverty among the elderly. In this respect, it is interesting to compare the incomes of the elderly with the rest of the population. Across the EU-28 as a whole, people aged 65 and above had a median income which in 2013 was equal to 93 % of the median income for the population under the age of 65 (see Figure 4). In six Member States (Luxembourg, Hungary, Greece, Romania, France and Spain) the median income of the elderly was equal to or higher than the median income of persons under 65, and this was also the case in the former Yugoslav Republic of Macedonia and Serbia. In Poland, Italy, Austria, Ireland, Portugal, the Netherlands and Slovakia the median income of the elderly was at least 90 % of that recorded for people under 65, and this was also the case in Norway. Ratios below 80 % were recorded in Malta, Finland, Cyprus, Latvia, Belgium, Bulgaria, Denmark and Estonia, as well as in Switzerland; these relatively low ratios may broadly reflect pension entitlements.
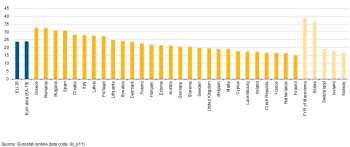
The depth of poverty, which helps to quantify just how poor the poor are, can be measured by the relative median at-risk-of-poverty gap. The median income of persons at-risk-of-poverty in the EU-28 was, on average, 23.8 % below the poverty threshold in 2013; this threshold is set at 60 % of the national median equivalised disposable income of all persons. Among the EU Member States, the relative median at-risk-of-poverty gap was widest in Greece and Romania (32.7 % and 32.6 % respectively), Bulgaria and Spain (both 30.9 %), Croatia (28.1 %) and Italy (28.0 %), followed by Latvia (27.5 %) and Portugal (27.4 %). The gap was even higher in the former Yugoslav Republic of Macedonia (39.0 %) and Serbia (36.6 %). The lowest at-risk-of-poverty gap among the EU Member States was observed in Finland (15.0 %), followed by the Netherlands (16.5 %), France and the Czech Republic (both 16.6 %).
Data sources and availability
EU statistics on income and living conditions (EU-SILC) were launched in 2003 on the basis of a gentlemen’s agreement between Eurostat, six EU Member States (Austria, Belgium, Denmark, Greece, Ireland, Luxembourg) and Norway. EU-SILC was implemented in order to provide underlying data for indicators relating to income and living conditions — the legislative basis for the data collection exercise is Regulation 1177/2003 of the European Parliament and of the Council. The collection of these statistics was formally launched in 2004 in 15 Member States and expanded in 2005 to cover all of the remaining EU-25 Member States, together with Iceland and Norway. Bulgaria and Turkey launched EU-SILC in 2006, Romania in 2007, Switzerland in 2008, while Croatia introduced the survey in 2010 (2009 data for Croatia are based on a different data source — namely the household budget survey (HBS)). Data for the former Yugoslav Republic of Macedonia are available since 2010 and for Serbia from 2013. EU-SILC comprises both a cross-sectional dimension and a longitudinal dimension.
Household disposable income is established by summing up all monetary incomes received from any source by each member of the household (including income from work, investment and social benefits) — plus income received at the household level — and deducting taxes and social contributions paid. In order to reflect differences in household size and composition, this total is divided by the number of ‘equivalent adults’ using a standard (equivalence) scale, the so-called ‘modified OECD’ scale, which attributes a weight of 1.0 to the first adult in the household, a weight of 0.5 to each subsequent member of the household aged 14 and over, and a weight of 0.3 to household members aged less than 14. The resulting figure is called equivalised disposable income and is attributed to each member of the household. For the purpose of poverty indicators, the equivalised disposable income is calculated from the total disposable income of each household divided by the equivalised household size; consequently, each person in the household is considered to have the same equivalised income.
The income reference period is a fixed 12-month period (such as the previous calendar or tax year) for all countries except the United Kingdom for which the income reference period is the current year of the survey and Ireland for which the survey is continuous and income is collected for the 12 months prior to the survey.
The at-risk-of-poverty rate is defined as the share of people with an equivalised disposable income that is below the at-risk-of-poverty threshold (expressed in purchasing power standards — PPS), set at 60 % of the national median equivalised disposable income. In line with decisions of the European Council, the at-risk-of-poverty rate is measured relative to the situation in each EU Member State rather than applying a common threshold. The at-risk-of-poverty rate may be expressed before or after social transfers, with the difference measuring the hypothetical impact of national social transfers in reducing the risk of poverty. Retirement and survivors’ pensions are counted as income before transfers and not as social transfers. Various analyses of this indicator are available, for example: by age, sex, activity status, household type, or education level. It should be noted that the indicator does not measure wealth but is instead a relative measure of low current income (in comparison with other people in the same country), which does not necessarily imply a low standard of living. The EU-28 aggregate is a population-weighted average of individual national figures.
Context
At the Laeken European Council in December 2001, European heads of state and government endorsed a first set of common statistical indicators for social exclusion and poverty that are subject to a continuing process of refinement by the indicators sub-group (ISG) of the social protection committee (SPC). These indicators are an essential element in the open method of coordination to monitor the progress made by the EU’s Member States in alleviating poverty and social exclusion.
EU-SILC is the reference source for EU statistics on income and living conditions and, in particular, for indicators concerning social inclusion. In the context of the Europe 2020 strategy, the European Council adopted in June 2010 a headline target for social inclusion — namely, that by 2020 there should be at least 20 million fewer people in the EU at risk of poverty or social exclusion than there were in 2008. EU-SILC is the source used to monitor progress towards this headline target, which is measured through an indicator that combines the at-risk-of-poverty rate, the severe material deprivation rate, and the proportion of people living in households with very low work intensity — see the article on social inclusion statistics for more information.
See also
- Children at risk of poverty or social exclusion
- European social statistics (online publication)
- Housing conditions
- Housing statistics
- People at risk of poverty or social exclusion
- Social inclusion statistics
Further Eurostat information
Publications
Statistical books
- Living conditions in Europe — 2014 edition
- European social statistics — 2013 edition
- Income and living conditions in Europe — 2010 edition
- Combating poverty and social exclusion. A statistical portrait of the European Union 2010
- The life of women and men in Europe — A statistical portrait
Statistics in focus
- Is the likelihood of poverty inherited? — Statistics in focus 27/2013
- Living standards falling in most Member States — Statistics in focus 8/2013
- Children were the age group at the highest risk of poverty or social exclusion in 2011 — Statistics in focus 4/2013
- In 2009 a 6.5 % rise in per capita social protection expenditure matched a 6.1 % drop in EU-27 GDP — Statistics in focus 14/2012
- 23 % of EU citizens were at risk of poverty or social exclusion in 2010 — Statistics in focus 9/2012
Main tables
Database
- Income and living conditions (ilc), see:
- Income distribution and monetary poverty (ilc_ip)
- Monetary poverty (ilc_li)
- Monetary poverty for elderly people (ilc_pn)
- In-work poverty (ilc_iw)
- Distribution of income (ilc_di)
Dedicated section
Methodology / Metadata
- Income and living conditions (ESMS metadata file — ilc_esms)
- Comparative EU Statistics on Income and Living Conditions: Issues and Challenges (Proceedings of the International Conference on EU Comparative Statistics on Income and Living Conditions, Helsinki, 6–8 November 2006)
- Individual employment, household employment and risk of poverty in the EU - A decomposition analysis — 2013 edition
- Statistical matching of EU-SILC and the Household Budget Survey to compare poverty estimates using income, expenditures and material deprivation — 2013 edition
- Using EUROMOD to nowcast poverty risk in the European Union — 2013 edition
Source data for tables and figures (MS Excel)
Other information
- Regulation 1177/2003 of 16 June 2003 concerning Community statistics on income and living conditions (EU-SILC)
- Regulation 1553/2005 of 7 September 2005 amending Regulation 1177/2003 concerning Community statistics on income and living conditions (EU-SILC)
- Regulation 1791/2006 of 20 November 2006 adapting certain Regulations and Decisions in the fields of ... statistics, ..., by reason of the accession of Bulgaria and Romania
External links
- Employment and Social Developments in Europe (2014)
- Employment and Social Situation Quarterly Review — March 2015
- OECD — Better Life Initiative: Measuring Well-being and Progress
