Archive:Passenger transport statistics
- Data from September 2009, most recent data: Further Eurostat information, Main tables and Database.
This article gives an overview of recent trends in passenger transport in the European Union, for different transport modes: rail, air and maritime transport. A second section takes a look at the evolution of traffic safety on roads and railways.
In the vast majority of EU Member States, GDP grew faster between 1996 and 2006 than the volume of inland passenger transport. Both road and railway safety improved markedly during the same period.
Main statistical findings
In the vast majority of EU Member States between 1996 and 2006 GDP grew faster than the volume of inland passenger transport (see Table 1). The most notable exception was Lithuania where the rate of growth in the volume of inland passenger transport was about one third faster than the rate of growth in GDP, although other exceptions were also recorded for Latvia, Portugal, Poland and Greece. In contrast, the rate of GDP growth in Slovakia and Hungary was about one third faster than the rate of growth in the volume of inland passenger transport between 1997 and 2007.
According to Table 2 the average distance travelled on railways (for national and international travel) per inhabitant, was higher in France, Denmark, Sweden and Austria than elsewhere in the EU in 2007. The average being 1 000 kilometres or more per year per person in each of these four Member States. In terms of international travel, the average distance travelled on railways per inhabitant was highest in Luxembourg and Austria, reflecting, for example, the number of international borders, the importance of international commuters within the workforce, the relative proximity of capitals or other cities to their international borders, the access to high-speed rail links, or their position on major international transport corridors. See also Graph 1.
Almost 800 million passengers were carried by air in 2008 in the EU. The largest number of passengers carried was reported by the United Kingdom, about 214 million, equivalent to 3.5 passengers carried per inhabitant. Relative to the size of the population the largest numbers of air passengers carried were reported by the islands of Cyprus and Malta (equivalent to 9.1 and 7.6 passengers carried per inhabitant).
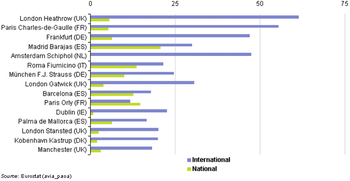
Within the EU, London Heathrow remained the busiest airport in terms of passenger numbers (about 67 million in 2008), followed by Paris’ Charles de Gaulle airport (about 60 million), and then Frankfurt, Madrid’s Barajas airport and Amsterdam’s Schiphol airport (all three with between 53 million and 47 million passengers).
With the exception of Madrid’s Barajas airport, the overwhelming majority (about 90 % or higher) of passengers through the other four largest airports in 2008 were on international flights. Madrid’s Barajas airport stands out in that national (domestic) flights accounted for a high share (40.8 % in 2008) of the passengers carried. There were also relatively high proportions of passengers on national flights to and from Roma’s Fiumicino airport, Barcelona and, in particular, Paris’ Orly airport where they were in the majority (representing 55.8 % of all passengers).
Table 3 also shows maritime passenger volumes. Ports in the EU handled 414 million maritime passengers in 2008, a rise of 1.9 % on numbers for 2007. Greek and Italian ports handled more passengers than those of any other Member State, followed by Danish ports and then, with roughly similar numbers, ports in Sweden, the United Kingdom and Germany. Relative to the size of national populations, the largest numbers of maritime passengers were recorded in Malta (almost 20 passengers per inhabitant), followed by Denmark and Greece (both between 8 and 9 passengers per inhabitant), Estonia and then, some way behind Sweden, Finland and Italy; in the remaining Member States, the number of maritime passengers per inhabitant averaged less than one.
Safety improved
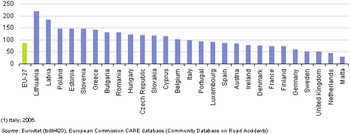
Road fatalities in the EU fell sharply (down 29.9 %) in the decade between 1997 and 2007, from 60 267 deaths to 42 854 deaths. The road fatality rate, expressed as the number of deaths per million inhabitants, averaged 87 across the EU, although there were stark contrasts between Member States. The highest road fatality rates in 2007 were recorded in Lithuania (218 deaths per million inhabitants), Latvia (184), Poland and Estonia (both 146). In contrast, rates were much lower in the United Kingdom and the Netherlands (50 and 43), and particularly in Malta (29).
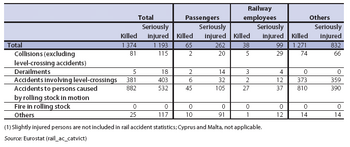
Around 2 900 people were victims (seriously injured or killed) of railway accidents in the EU-27 in 2007, which represented a sharp rise of about 15 % in the number of victims compared with 2006. It should be noted that the number of victims in any particular year can be greatly influenced by a small number of major incidents and that there had been considerable declines in the number of victims in 2005 and 2006 (see Table 4). Of the total number of victims seriously injured or killed in railway accidents in the EU in 2007, a little less than one sixth (16 %) were either train passengers or railway employees. Approximately two thirds (66.5 %) of the lives lost in rail accidents were from incidents involving rolling stock in motion, with almost all others (32.5 %) from incidents at level-crossings. The highest numbers of rail fatalities within the EU in 2007 occurred in Poland (359) and Germany (200).
Data sources and availability
The volume of inland passenger transport is defined as the ratio between passenger-km (inland modes) and GDP (gross domestic product in constant (year 2000) EUR), and within this article is compared to the reference year 2000. It is based on transport movements by passenger cars, buses and coaches, and trains on national territory, regardless of the nationality of the vehicle.
Rail transport statistics are reported on the basis of the ’territoriality principle’. This means that each reporting country reports the loading/embarkation, unloading/disembarkation and movements of goods and passengers that take place in their national territory. For this reason, indicators that use tonne-kilometres and passenger-kilometre as units are generally considered as the best measure for comparisons between transport modes and countries, because the use of tonnes or passengers entails a high risk of double counting, particularly in international transport. A rail passenger is any person, excluding members of the train crew, who makes a journey by rail. A rail passenger-kilometre is a unit of measure representing the transport of one rail passenger by rail over a distance of one kilometre. Rail passenger data are not available for Malta and Cyprus as they do not have railways. Annual passenger transport statistics (international and national breakdown) cover only railway undertakings (usually the larger rail transport enterprises) that are subject to detailed reporting, while total annual passenger statistics may include smaller rail enterprises that operate under simplified reporting as well. Some countries apply detailed reporting to all railway undertakings and in the case of these countries the total passenger transport is equal to the sum of international and national passenger transport.
Maritime transport data are available for most of the period from 2001 onwards, although some Member States have provided data for the period since 1997. Maritime transport data are not transmitted to Eurostat by the Czech Republic, Luxembourg, Hungary, Austria and Slovakia as they have no maritime traffic. A merchant ship is a ship designed for the carriage of goods, transport of passengers or specially fitted out for a specific commercial duty. A sea passenger is any person that makes a sea journey on a merchant ship. Service staff assigned to merchant ships are not regarded as passengers. Non-fare paying crew members travelling but not assigned and infants in arms are also excluded.
The total number of maritime passengers includes passengers who have been double-counted, once when embarking and then when disembarking. The double counting arises when both ports of embarkation and disembarkation report data to Eurostat. This is quite common for the maritime transport of passengers, which is a short distance activity, compared with the seaborne transport of goods. Indeed, there is no significant difference between the number of passengers embarking and disembarking at an aggregated level, as most transport corresponds to main national and intra-EEA ferry connections.
Air transport statistics concern national and international transport. Passenger transport is measured by the number of passengers on board, passengers carried and passenger commercial air flights, in all cases separating arrivals and departures. Statistics on individual routes provide information on seats available, again separating arrivals from departures. The data are presented with monthly, quarterly and annual frequencies. Annual data are available for the EU-27 Member States for most of the period from 2003 onwards. Air passengers carried relate to all passengers on a particular flight (with one flight number) counted once only and not repeatedly on each individual stage of that flight. This includes all revenue and non-revenue passengers whose journey begins or terminates at the reporting airport and transfer passengers joining or leaving the flight at the reporting airport; but excludes direct transit passengers.
Fatalities caused by road accidents include drivers and passengers of motorized vehicles and pedal cycles, as well as pedestrians, who die as a result of injuries sustained in an accident within 30 days from the day of the accident. For Member States not using this definition, corrective factors were applied.
Context
EU transport policies have been designed both for households and the business community, regardless of location, whether urban or rural. The recent mid-term review of the 2001 White paper placed a spotlight on urban travel, reflecting the fact that ’eighty per cent of Europeans live in an urban environment’.
The mid-term review points to picking up on the best-practice initiatives used by a number of cities regarding ’transport infrastructure, norm-setting, congestion and traffic management, public transport services, infrastructure charging, urban planning, safety, security and cooperation with the surrounding region’.
The Commission published a Green paper on a new culture for urban mobility in September 2007 that looks to stimulate the adoption of these best practices.
Intra-urban transport is only one element of passenger transport policy. Enlargement of the EU has opened up further opportunities for inter-urban passenger travel by rail, road or airplane, which has been and continues to be strengthened by improvements to the infrastructure (such as extensions of the high-speed rail links or raising of airport capacity), by more competition and greater co-ordination (such as the ’single sky’ policy). The strengthening of passenger rights has also made passengers more able to enjoy the freedom to travel and work throughout the EU. The recent mid-term review underlined the point that rail and sea passengers should benefit from similar rights. This was achieved for rail passengers with the adoption of the Third railway package in October 2007.
Further Eurostat information
Publications
Main tables
- Transport, see:
- Transport, volume and modal split (t_tran_hv)
- Volume of passenger transport relative to GDP (tsien070)
- Car share of inland passenger transport (tsien090)
- Modal split of passenger transport (tsdtr210)
- Railway transport (t_rail)
- Rail transport of passengers (ttr00015)
- Road transport (t_road)
- People killed in road accidents (tsdtr420)
- Air transport (t_avia)
- Air transport of passengers (ttr00012)
Database
- Transport, see:
- Regional transport statistics (tran_r)
- Victims in road accidents at regional level (tran_r_acci)
- Maritime transport of passengers at regional level (tran_r_mapa_nm)
- Air transport of passengers at regional level (new methodology) (tran_r_avpa_nm)
- Maritime transport of passengers at regional level (old methodology) (tran_r_mapa_om)
- Air transport of passengers at regional level (old methodology) (tran_r_avpa_om)
- Annual national and international railway passenger transport by region of embarkation and region of disembarkation (tran_r_rapa)
- Transport, volume and modal split (tran_hv)
- Volume of passenger transport (tran_hv_pstra)
- Modal split of passenger transport (tran_hv_psmod)
- Railway transport (rail)
- Railway transport measurement - passengers (rail_pa)
- Railway transport - Accidents (rail_ac)
- Road transport (road)
- Road transport measurement - passengers (road_pa)
- Road transport - accidents (road_ac)
- Maritime transport (mar)
- Maritime transport - Passengers (mar_pa)
- Air transport (avia)
- Air transport - Accidents (avia_ac)
- Air transport measurement - passengers (avia_pa)
Dedicated section
Other information
- Common Questionnaire of the United Nations Economic Commission for Europe (UNECE), Eurostat and the European Conference of Ministers of Transport (ECMT; more recently the International Transport Forum – ITF) on rail transport statistics
- Glossary for Transport statistics – Third Edition
- Glossary on air transport statistics in Illustrated Glossary for Transport Statistics
- Manual on air transport statistics methodology
- Methodological notes on maritime transport statistics are published in the annual Maritime transport of goods and passengers - Statistics in focus 09/2006.


