Archive:People in the EU - statistics on origin of residents
- Data extracted in June 2015. Most recent data: Further Eurostat information, Main tables and Database.
This article is part of a set of statistical articles that are based on Eurostat’s flagship publication People in the EU: who are we and how do we live? — selected analyses focusing on the 2011 population and housing census (which also exists as a PDF); it presents a range of statistics that cover the cultural diversity of the population living in the European Union (EU).

(% of marriages)
Source: Eurostat (demo_marcz)
(% of population)
Source: Eurostat (demo_marcz) and (Census hub HC28)
(% of population)
Source: Eurostat (demo_marcz) and (Census hub HC28)

(% of all people born in an EU Member State living in another EU Member State)
Source: Eurostat (demo_marcz) and (Census hub HC28)

Source: Eurostat (demo_marcz) and (Census hub HC28)
(% of population)
Source: Eurostat (demo_marcz) and (Census hub HC34)
(%)
Source: Eurostat (lfsa_argacob)
(% of persons employed)
Source: Eurostat (lfsa_argacob) and (Census hub HC33)
(% of population)
Source: Eurostat (lfsa_argacob) and (Census hub HC33)

(% of persons employed)
Source: Eurostat (lfsa_argacob) and (Census hub HC29)
(% of all managers)
Source: Eurostat (lfsa_argacob) and (Census hub HC29)
(% of persons employed)
Source: Eurostat (lfsa_argacob) and (Census hub HC29)
(% of persons employed)
Source: Eurostat (lfsa_argacob) and (Census hub HC15)
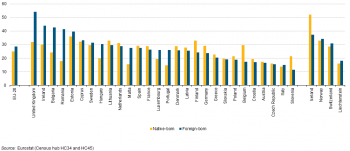
(% of population aged 25 and over)
Source: Eurostat (lfsa_argacob) and (Census hub HC34 and HC45)
Source: Eurostat (lfsa_argacob) and (Census hub HC34 and HC45)
Main statistical findings
Beyond its intrinsic value, cultural diversity has the potential to contribute to economic growth, job creation, innovation and competitiveness. With freedom of movement across the European Union, EU residents have a range of options to expand their horizons and to increase their social and cultural interactions through study, work, travel for business or for leisure, or shopping across borders.
The EU promotes intercultural dialogue, the exchange of views and opinions between different cultures, and diversity across European society, encompassing linguistic, political, religious, ethnic, and sexuality differences. Language provides a good example of the wide range of diversity in the EU, insofar as there are 24 official languages and more than 60 regional and minority languages, together with more than 100 migrant languages.
History provides evidence as to the importance of protecting minorities and allowing different identities to flourish. EU policies promote a pluralistic approach, human rights and equality with the goal of ensuring an open, tolerant and equal society for all.
Within the context of this article, cultural differences are analysed through a comparison of migration statistics, using information broken down by citizenship and by place of birth to provide a more detailed description of a range of socioeconomic measures. Migration is influenced by a combination of economic, political and social factors: either in a migrant’s country of origin (push factors) or in the country of destination (pull factors). Historically, the relative economic prosperity and political stability of the EU are thought to have exerted a considerable pull effect on immigrants. In destination countries, international migration may be used as a tool to solve specific labour market shortages. However, migration alone will almost certainly not reverse the ongoing trend of population ageing currently being experienced in many parts of the EU.
Approximately half of all foreign-born people living in EU Member States were from elsewhere in Europe
According to the population and housing census, there were almost 51 million people resident in the EU-28 in 2011 who had been born outside of the Member State where they were living (excluding stateless persons and those whose place of birth was unknown), representing approximately 10 % of the EU-28 population.
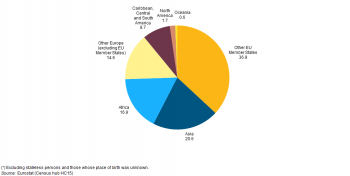
Figure 1 shows that Europeans accounted for approximately half of all the foreign-born people who were resident in an EU Member State. More than one third (36.9 %) of foreign-born residents — some 18.8 million persons — were born in other EU Member States, while 7.4 million (14.6 %) were born in other European countries outside of the EU. Residents in the EU Member States who were born in Asia made up 20.8 % of the foreign-born total, while EU residents born in Africa made up 16.9 % of the total and residents born in the Caribbean, Central and South America made up 8.7 %. There were relatively small shares for those born in North America (1.7 %) and Oceania (0.6 %).
The EU Member States have a long tradition of receiving immigrants from other European countries and considerably further afield. For example, post-war immigration in Belgium saw a flow of migrant workers from Italy, Portugal and Spain to work in the industrial economy, while in the United Kingdom migrants from the Indian sub-continent or the Caribbean contributed to economic regeneration in the 1960s. More recently, there have been substantial migrant flows between EU Member States following successive expansions of the EU, while political instability, wars and human rights abuses have resulted in an increasing flow of migrants from outside the EU many of whom are seeking asylum.
Foreign-born residents from countries outside the EU
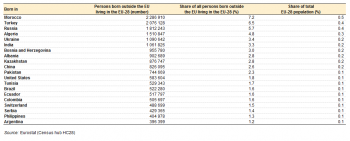
Table 1 provides more information from the population and housing census in relation to the 20 largest foreign-born communities living in EU Member States in 2011. It focuses on EU residents who were born in non-member countries (in other words, those outside the EU). This information covers the stock of foreign-born residents and not the flow of migrants for a single year; for more information on the latter, please refer to an article on Changing places — geographic mobility.
The Moroccan community was the largest foreign-born community in the EU
In 2011, the top 20 foreign-born communities from outside the EU numbered 18.5 million residents in the EU-28, which was equivalent to 3.7 % of the EU-28 population. These 20 communities together accounted for 58.3 % of the foreign-born residents from outside of the EU.
The largest foreign-born community from a country outside of the EU was composed of EU residents born in Morocco. There were 2.3 million people born in Morocco who lived in the EU-28 in 2011, which equated to 7.2 % of all foreign-born residents from non-member countries or 0.5 % of the total EU-28 population. The largest Moroccan community in any of the EU Member States was in France, although Moroccan-born residents in Belgium accounted for a higher share of the total population.
The second and third largest foreign-born communities resident in the EU-28 were composed of people born in Turkey and Russia (2.1 million and 1.8 million persons), while there were in excess of one million residents living in the EU originating from each of Algeria, Ukraine and India. It is interesting to note that there were more Chinese-born residents living in the EU-28 (827 thousand) than American-born residents (584 thousand).
Marriages
This next section analyses one particular aspect of demographic diversity, namely, the proportion of marriages where at least one of the spouses is of a different nationality to the country in which they reside.
Marriages involving at least one foreigner accounted for 11 % of all marriages in the EU
Eurostat’s annual demography data collection provides information on, among others, marriages and divorces. Slightly fewer than 9 out of every 10 (89.0 %) marriages that took place in 2012 in the EU-28 were formed by a bride and groom who were both nationals of the Member State in which they were married, while 5.0 % of marriages involved a foreign bride, 3.7 % a foreign groom, and 2.3 % both a foreign bride and groom. Note that this information is based on data for only 20 of the EU Member States and excludes Germany, France and the United Kingdom (see Figure 2 for coverage).
Luxembourg was the only EU Member State where marriages between a bride and groom who were both nationals accounted for less than half (40.5 %) of all marriages, while such marriages accounted for fewer than four out of every five marriages in Latvia and Slovenia (77.6 % and 78.9 % respectively). By contrast, more than 19 out of every 20 marriages in Romania, Hungary and Poland were formed by spouses who were both nationals of the Member State where the marriage took place.
The proportion of marriages between spouses from different EU Member States may be expected to increase as a result of increased integration, freedom of movement, as well as cross-border labour and education opportunities. A very low proportion of marriages in most of the Member States that joined the EU since 2004 involved two foreign spouses. With the exception of Croatia, the proportion of marriages that involved a foreign groom was higher than the proportion involving a foreign bride in each of the Member States that joined the EU since 2004; this pattern was particularly evident in the Baltic Member States and Slovakia. By contrast, with the exception of Finland, a higher proportion of marriages involved foreign brides in those EU Member States that were already members of the EU before 2004.
Foreign-born residents from another EU Member State
Did you know?
Across level 3 regions in 2011, the highest proportion of foreign-born residents was recorded in the Swiss city of Genève, with a 48.2 % share of the total number of residents. Among the EU Member States, the highest regional share among NUTS level 3 regions was recorded in Inner London - West, at 43.9 %.
For more information: refer to the CENSUS HUB
Almost one third of all residents in Luxembourg were born in another EU Member State
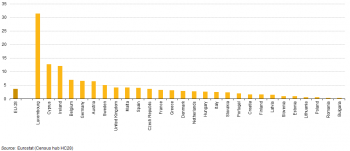
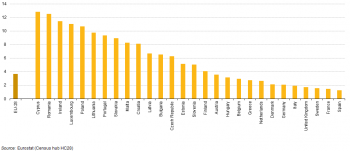
The population and housing census provides information on foreign-born residents living in the EU. In 2011, those residents born in a different EU Member State to the one in which they were residing numbered 18.8 million, or 3.7 % of the EU-28’s population (see Figure 3). Residents born in another EU Member State accounted for more than 1 in 20 residents in Sweden (5.1 %), Austria (6.5 %), Germany (6.6 %) and Belgium (7.0 %), while this share rose to more than 1 in 10 residents in Ireland (12.1 %) and Cyprus (12.7 %). Furthermore, almost one third (31.4 %) of the total population of Luxembourg was born in another EU Member State. By contrast, less than 1 % of the residents in each of Estonia, Lithuania, Poland, Romania and Bulgaria were born in another EU Member State.
More than 10 % of those born in Cyprus, Ireland, Luxembourg, Poland and Romania lived abroad in another EU Member State
Figure 4 (also based on information from the population and housing census) shows the opposing situation, namely, the share of the native-born population who had emigrated to live abroad in another EU Member State. In 2011, this proportion peaked at 12.8 % in Cyprus and 12.5 % in Romania, while double-digit shares were also recorded for those born in Ireland, Luxembourg and Poland. By contrast, the five largest EU Member States in population terms — Germany, France, the United Kingdom, Italy and Spain — recorded some of the lowest shares, as 2.1 % of the native-born population from Germany was living abroad in another EU Member State (the highest share among these five Member States), falling to 1.2 % of those born in Spain. Among the other EU Member States, Sweden (1.6 %) and Denmark (2.1 %) also reported that a relatively low share of their native-born populations were living abroad in other EU Member States.
More than one in five residents living in an EU Member State but born in another Member State originated from Poland
Following the fall of communism in much of Eastern Europe, a new wave of migration into the EU from eastern neighbours began; this became more pronounced following successive enlargements of the EU, as people from the new Member States could progressively circulate freely within the EU.
According to the population and housing census, more than one fifth (22.0 %) of all the residents born in an EU Member State and living in other EU Member States originated from Poland (see Figure 5). This was considerably more than the shares recorded for those born in Romania (13.7 %) or Germany (8.9 %), while France, Portugal, the United Kingdom and Italy each accounted for 5.2 %–6.2 % of the residents born in an EU Member State living in another EU Member State. By contrast, there were eight (relatively small) Member States that accounted for less than 1 % of the total number of residents born in an EU Member State living in another EU Member State: Sweden, Latvia, Denmark, Cyprus, Slovenia, Estonia, Luxembourg and Malta.
There were 2.7 million Polish-born residents living in Germany
Table 2 — also based on information from the population and housing census — provides information on the main communities of people born in an EU Member State living in another EU Member State. In 2011, the 20 largest communities of such residents collectively numbered 10.0 million persons, equivalent to more than half (53.3 %) of the total number of residents born in an EU Member State living in another EU Member State.
By far the largest community, in absolute terms, was the Polish-born community living in Germany (2.7 million persons), while there were an additional 654 thousand Polish-born residents in the United Kingdom (the fourth largest such community).
Several EU Member States that were traditionally countries of emigration have in recent years started to receive immigrants. This is particularly the case in Italy and Spain, in part due to a flow of migrants across the Mediterranean Sea, but also as a result of internal flows of migrants born elsewhere in the EU: the second and third largest communities of people born in an EU Member State and living in another EU Member State were Romanian-born residents living in Italy (769 thousand) and Spain (691 thousand). The only other such community that numbered in excess of half a million residents was the Portuguese-born community living in France (617 thousand).
Three quarters of the residents living in the Czech Republic who were born in another EU Member State originated from Slovakia
The information presented in Table 2 also provides details of the largest such communities in relative terms, in other words, as a share of the total number of residents in the reporting country born in another EU Member State. The ranking is unsurprisingly often characterised by pairs of neighbouring countries. For example, almost three quarters (74.8 %) of all residents in the Czech Republic who were born in another EU Member State were born in Slovakia; this was the highest share among the EU Member States. The next four country pairings were also neighbours: Croatian-born residents living in Slovenia, Czech-born residents living in Slovakia, Romanian-born residents living in Hungary, and Lithuanian-born residents living in Latvia; each accounting for between 65 % and 70 % of all residents living in the reporting country who were born in another EU Member State.
There were, however, some exceptions to the rule, as almost 60 % of the residents living in Malta (a Commonwealth country) who were born in another EU Member State were born in the United Kingdom, many of whom were retirees. In a similar vein: almost half of the residents who were born in another EU Member State who lived in Italy were born in Romania, while the share of Romanians in Spain’s population of residents who were born in another EU Member State was just over one third; almost half of all the residents living in Croatia who were born in another EU Member State were born in Germany as were just over one third of those in Greece; close to half of the residents living in Portugal who were born in another EU Member State were from France; just over one third of residents living in Luxembourg who were born in another EU Member State were from Portugal.
Activity rates by place of birth
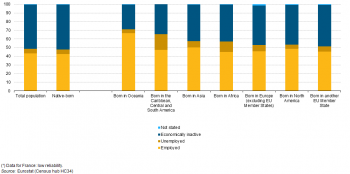
Having established some general patterns of cultural diversity in relation to the distribution of foreign-born and EU-born populations, this article continues by analysing a range of socioeconomic factors according to the place of birth, starting with the economic activity status of the resident population. According to the population and housing census, just over half (51.9 %) of the native-born population of the EU-28 in 2011 was economically inactive (for example studying, retired or not working for some other reason), while 42.7 % were employed and 5.1 % unemployed.
The foreign-born population living in the EU had a higher share of persons in employment
Migration policies within the EU in relation to citizens of non-member countries are increasingly concerned with attracting migrants with particular profiles, often in an attempt to alleviate particular skills shortages. Selection criteria include, for example, language proficiency, work experience or educational qualifications. Alternatively, employers may directly select immigrants, who then migrate with a job available upon arrival.
Across the whole of the EU-28, the share of foreign-born residents who were employed was systematically higher than for native-born residents. In 2011, this proportion reached two thirds (66.7 %) for residents of EU Member States who were born in Oceania, and was also greater than 50 % among residents of EU Member States who were born in Asia. The lowest proportions were recorded for those born in another EU Member State (45.2 %) and those born in Africa (44.8 %); in both cases these shares remained higher than for the native-born population (42.7 %).
Residents born in another EU Member State consistently recorded the highest activity rates
The data presented in Figure 6 relates to the whole of the foreign-born population. It should be borne in mind that many foreign-born migrants decide to move residence when they are relatively young adults (often without a family) and some may decide to return to their country of birth when they are approaching or have reached retirement; the impact of this is to push up the share of economically active people (employed or unemployed) among the foreign-born population. By contrast, some people may decide to move residence in their retirement, and the impact of this is to push down the share of economically active people among the foreign-born population of the destination country.
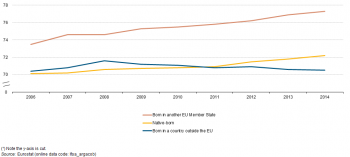
Figure 7 provides an analysis of activity rates for those persons of working age (15–64 years), according to their place of birth; note that this information comes from the EU’s labour force survey (EU-LFS). During the period 2006 to 2014, the activity rate for residents of an EU Member State born in another EU Member State was consistently higher — generally by 4–5 percentage points — than those recorded for either the native-born population or the population born in a country outside the EU. It is interesting to note that during the financial and economic crisis, the activity rate of people born in an EU Member State but living in another EU Member State continued to increase (as did that of native-born residents), while there was a reduction in the activity rate of those born in countries outside of the EU.
Female activity rates
Women and men have a range of rights in the EU, such as: the right to freely and consensually choose a spouse; parental rights to a child irrespective of marital status; or the right to choose a profession / occupation when in work. Despite the considerable progress that has been made, gender inequalities continue to exist, perhaps nowhere more so than in the workplace: for example, women continue to experience a gender pay gap and they often have low levels of representation in positions of power, such as within senior management or in government.
Female activity rates in 2014 were lower than male activity rates, with this gender gap linked to family and care activities, often referred to as the ‘supportive environment’, which tends to affect people’s availability and / or willingness, to participate in the labour force. This is especially the case in those EU Member States where traditional family units continue to thrive and / or where care services are lacking or do not meet the needs of (full-time) working parents, with women tending to decrease their paid working hours when they are parents, while men tend to increase them.
Female activity rates for women born in countries outside the EU were generally low
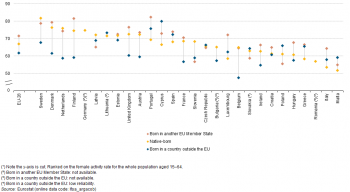
Figure 8 (which is also based on information from the EU-LFS) shows that female activity rates for those aged 15–64 years were highest among women born in another EU Member State (71.4 %), while the activity rates of native-born women (66.8 %) and women born in a country outside the EU (61.6 %) were much lower. Women born in countries outside the EU may face a range of issues that explain their relatively low levels of economic activity, among which: migrating under family reunification provisions (which may involve constraints on employment rights); lower levels of educational attainment and language barriers; different cultural practices that highlight a women’s role at home; higher fertility rates; and various obstacles in accessing information about childcare services that are available and rights to use such services.
The gap in female activity rates between the native-born population and those born outside of the EU was greatest in those EU Member States characterised by some of the highest female activity rates, namely the Netherlands, the Nordic Member States, Austria and the United Kingdom, as well as in Belgium and France. In each of these cases, the female activity rate for the native-born population in 2014 was at least 10 percentage points higher than that for women born outside the EU.
By contrast, in the southern EU Member States — where female activity rates for the native-born population tended to be much lower — it was common to find activity rates for women born outside the EU were higher; this was particularly true in Greece, Malta and Cyprus. In Cyprus, the activity rate for women born outside the EU was 79.9 %, the highest among any of the EU Member States.
Employment status by place of birth
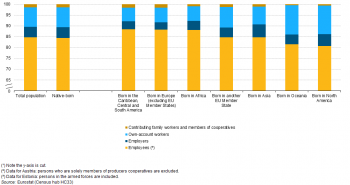
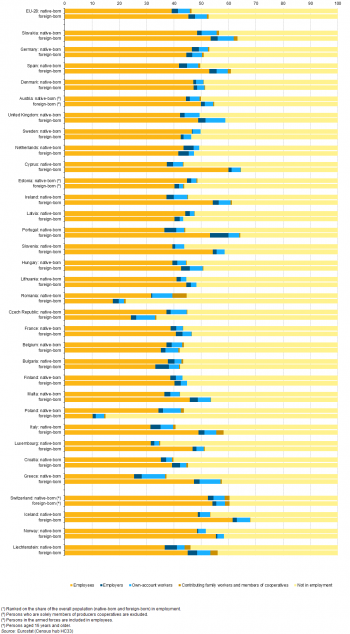
Figure 9 provides an analysis by place of birth of the employment status of working people in the EU-28 in 2011; it is based on data from the population and housing census. It shows the employment status of foreign-born residents varied as a function of where they were born. For each group, employees accounted for the overwhelming majority of the workforce (more than four out of every five persons): their shares were highest among people living in EU Member States but born in the Caribbean, Central and South America (88.5 %), Africa or European countries outside of the EU (both 88.2 %), while employees accounted for an 84.5 % share of the native-born workforce. Residents of EU Member States born in Oceania (13.6 %) and North America (13.1 %) had a higher propensity to be own-account workers than the EU Member States’ native-born workforce (9.1 %), while residents born in Asia (6.0 %) or in North America (5.6 %) were more likely to be employers than the EU Member States’ native-born workforce (4.9 %). The employment status of residents in an EU Member State who were born in another EU Member State closely resembled that of native-born residents.
According to the population and housing census, a higher proportion of foreign-born residents in the EU Member States were in some form of employment (52.6 %) than the native-born population (46.4 %). Given that relatively few persons are employers or working on their own-account, the most striking aspect of the analysis presented in Figure 10 concerns the differences in the proportion of the foreign-born and native-born populations that are employees and those that are not in employment.
On the one hand, there was a group of EU Member States where a higher proportion of the foreign-born population (compared with the native-born population) were employees and a lower proportion was not in employment. This was particularly the case in the southern EU Member States of Spain, Cyprus, Portugal, Malta, Italy, and Greece, as well as in Ireland, Slovenia and Luxembourg.
On the other hand, a second group of EU Member States were characterised by their foreign-born population displaying a relatively high share of people not in employment and a lower proportion of employees. These differences were most pronounced in Poland, Romania and the Czech Republic, and to a lesser degree in Sweden, Estonia, Latvia, Bulgaria, Germany, Belgium and the Netherlands.
Occupation by place of birth
As noted above, migration policies within the EU for citizens of non-member countries are increasingly concerned with attracting migrants with particular profiles; note that while such policies may impact on new migrant arrivals, they are unlikely to affect those migrants already permanently resident within the EU.
Just over one fifth of foreign-born residents had elementary occupations (such as being labourers or cleaners)
Table 3 (also based on data from the population and housing census) provides information on the occupations of native-born and foreign-born residents. In 2011, the most striking difference was recorded in relation to the proportion of foreign-born and native-born residents who were classified as having elementary occupations. Just over one fifth (20.6 %) of all the foreign-born residents living in EU Member States who were in employment carried out elementary occupations such as being a cleaner, agricultural or construction labourer, food preparation assistant, or refuse worker. This could be compared with less than one tenth (9.7 %) of the native-born workforce.
Workers in elementary occupations accounted for a particularly high share of the foreign-born workforce in Italy, Cyprus, Greece, Slovenia, Spain, Luxembourg, Denmark and Germany, as their shares of the foreign-born workforce were at least 10 percentage points higher than within the native-born workforce.
A REGIONAL ANALYSIS OF ELEMENTARY OCCUPATIONS
The population and housing census provides more detailed information at the level of NUTS level 2 regions. This shows (subject to data availability; no information for Belgium or Austria) that there were eight regions in the EU with a higher number of foreign-born residents (compared with native-born residents) who were employed in elementary occupations. These eight regions included: the Swedish capital region of Stockholm; two Greek regions (Peloponnisos and the capital region of Attiki), the French overseas region of Guyane; the capital and neighbouring region of Inner and Outer London in the United Kingdom; as well as Cyprus and Luxembourg (both single regions at this level of detail). In Luxembourg, the number of foreign-born residents with an elementary occupation was almost three times as high as the number of native-born residents with an elementary occupation.
The share of foreign-born residents with an elementary occupation was higher than the corresponding share among native-born residents in 209 out of the 252 NUTS level 2 regions for which data are available (again, no information for Belgium or Austria). The gap between these two shares was highest in three southern regions of the EU, namely, Sterea Ellada (Greece), Lombardia and Emilia-Romagna (both Italy); in all three cases the share of foreign-born residents with an elementary occupation was at least 20 percentage points higher than the corresponding share among native-born residents.
By contrast, some 15.4 % of the EU Member States’ native-born workforce was employed as a technician or associate professional, which was 4.5 percentage points higher than the corresponding share for the foreign-born workforce. Equally, a higher proportion of the native-born workforce was occupied as clerical support workers (3.3 percentage points difference) and professionals (2.7 points). Professional occupations cover, among others, scientists, engineers, health and teaching professionals, business and administration professionals, information and communications technology professionals, legal professionals, journalists and linguists. However, there were a number of EU Member States where a considerably higher proportion of the foreign-born workforce (compared to the native-born workforce) had a professional occupation, principally, Romania (16.5 percentage points difference), Poland (13.2 points), Hungary (6.9 points) and Bulgaria (6.3 points).
Some 17.8 % of the foreign-born workers in Bulgaria were managers
According to the population and housing census, managers accounted for 5.4 % of the foreign-born workforce in the EU-28 in 2011. The relative share of managers in the foreign-born workforce was considerably higher in several of the EU Member States, rising to 17.8 % in Bulgaria, while it was also higher than 10 % in Malta, Romania, Poland, Latvia and the United Kingdom.
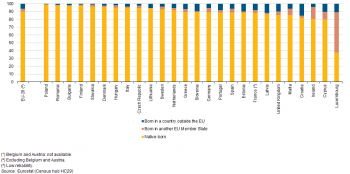
Figure 11 provides a contrasting analysis, showing the relative share of native-born and foreign-born managers in the total number of managers by EU Member State. In 2011, just less than 1 in 10 of all managers in the EU (no information available for Belgium and Austria) were foreign-born, with 6.2 % of the total born in a country outside the EU and 3.6 % born in another EU Member State.
More than half the managers in Luxembourg were born in another EU Member State
The relative share of foreign-born managers (from the EU or from non-member countries) was less than 5 % in Hungary, Denmark, Slovakia, Finland, Bulgaria, Romania and Poland; in the latter, foreign-born managers accounted for just 1.0 % of the total number of managers. The majority of the EU Member States reported that foreign-born managers accounted for between 5 % and 15 % of all managers, although there were somewhat higher shares in Croatia (17.6 %), Ireland (19.0 %) and Cyprus (20.1 %). The pattern in Luxembourg was atypical insofar as a large majority (62.1 %) of managers were foreign-born, with more than half (51.5 %) having been born in another EU Member State.
Luxembourg was one of only eight EU Member States where the share of foreign-born managers from other EU Member States was higher than the corresponding share for foreign-born managers from outside the EU. This difference was also quite large in Ireland, where managers born in another EU Member State accounted for 14.7 % of the total number of managers, compared with 4.3 % among those born in a foreign country outside the EU. The other six Member States that recorded much smaller differences (not greater than 2.1 percentage points) were: Malta, Slovakia, Hungary, the Czech Republic, Finland and Sweden.
Economic activity by place of birth
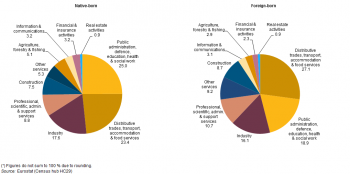
The information presented in Figure 12 and in Table 4 complements that already shown for occupations, insofar as it refers to the economic activities (by NACE) where foreign-born and native-born residents were employed in 2011; it is also derived from the population and housing census.
A lower proportion of the foreign-born workforce was working in the public administrations of most EU Member States
One quarter (25.0 %) of the EU Member States’ native-born population who were in employment in 2011 were working within public administration, defence, education, health and social work; this equated to 51.2 million persons. By contrast, there were 4.9 million foreign-born residents who were working in the same economic activities, equivalent to 18.9 % of the foreign-born workforce. The difference in the relative shares of these two subgroups — 6.1 percentage points — was the largest recorded for any of the activities analysed in Figure 12.
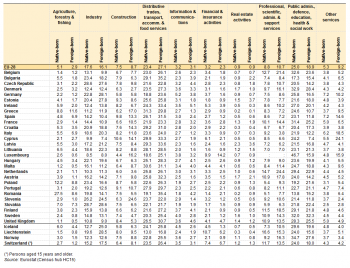
A more detailed analysis, by EU Member State, is provided in Table 4. This shows that a slightly higher share of the foreign-born workforce (compared with the native-born workforce) was employed in public administration, defence, education, health and social work in Romania, Slovakia and Sweden, with the difference rising to 2.4 percentage points in Poland. By contrast, in all of the remaining Member States, the share of the native-born workforce employed in public administration, defence, education, health and social work was higher, with a gap of more than 10 percentage points in Spain, Greece, Cyprus and Luxembourg. In Luxembourg, almost half (46.7 %) of the native-born workforce was working in these activities. These figures suggest that in some of the EU Member States there may be considerable — formal or informal — barriers which prevent the occupation of foreign-born residents in these activities.
A higher proportion of the EU Member States’ native-born workforce (compared with their foreign-born workforce) was also employed in agriculture, forestry and fishing (2.1 percentage points), industry (1.5 points), financial and insurance activities (0.9 points), and information and communications (0.1 point). By contrast, higher shares of the foreign-born workforce were employed in various service activities and in the construction sector.
In the Baltic Member States and Germany, a relatively high share of the foreign-born workforce was employed within the industrial economy. In 2011, these activities accounted for 21–22 % of the foreign-born workforce in Latvia and Lithuania and for close to 28 % in Estonia and Germany, while the share of the foreign-born workforce employed in industrial activities was 3.6 percentage points higher than for the native-born workforce in Lithuania, 4.0 points higher in Latvia, 5.3 points higher in Germany, peaking at 7.4 points higher in Estonia. Italy, Ireland, the Netherlands and Greece were the only other EU Member States where a higher proportion of foreign-born residents were employed within the industrial economy, although the shares for the native-born workforce were never more than 2 percentage points lower.
Qualifications by place of birth
Did you know?
In 2011, the highest proportion of foreign-born persons with a tertiary level of education was recorded in North Eastern Scotland (81.6 % of the population aged 25 and over).
For more information: refer to the CENSUS HUB
Evidence presented earlier in this article concerning the occupations and economic activities in which foreign-born residents work appears to suggest that it remains relatively difficult for foreign-born residents to convert their educational attainment into occupations generally associated with higher qualifications, and that a considerable proportion of foreign-born residents may therefore be overqualified in their jobs.
A higher share of foreign-born residents possessed a tertiary level of educational attainment
Figure 13 presents an analysis of the educational attainment of the native-born and foreign born populations (among those aged 25 and over); this data is from the population and housing census. In 2011, one quarter of the native-born population in the EU Member State had a tertiary level of educational attainment (as defined by ISCED 1997 levels 5 and 6), while the corresponding share among foreign-born residents was somewhat higher, at 28.5 %.
In the United Kingdom, more than half (54.2 %) of all foreign-born residents aged 25 and over in 2011 possessed a tertiary level of educational attainment; shares of 40-44 % were recorded in Estonia, Romania, Bulgaria and Ireland. In 2011, the gap between the proportion of foreign-born and native-born residents in the United Kingdom with a tertiary level of educational attainment was 22.4 percentage points. This was exceeded in Romania (23.6 points), while double-digit differences in favour of foreign-born residents were also recorded in Bulgaria, Ireland, Malta, Portugal and Hungary. By contrast, a smaller proportion of foreign-born rather than native-born residents in Germany had a tertiary level of educational attainment (5.4 percentage points difference). Even wider gaps in favour of native-born residents were recorded in Finland (8.8 points), Slovenia (10.0 points) and Belgium (12.3 points).
North Eastern Scotland recorded the highest share of foreign-born residents possessing a tertiary level of educational attainment
A regional analysis for the same indicator is provided in Map 1 (once again the source of this information is the population and housing census). The map confirms, to some degree, the results shown in Figure 13 insofar as many of the regions with very high levels of tertiary education attainment for foreign-born residents were located in the United Kingdom. This was particularly true in North Eastern Scotland — which includes the city of Aberdeen which provides support to much of the British offshore oil and gas activity —which recorded the highest share (81.6 %) of tertiary educational attainment among its foreign-born residents among any of the NUTS level 2 regions. It was followed by the neighbouring region of Eastern Scotland — which includes Edinburgh — where a ratio of 77.7 % was reported.
There were 10 NUTS level 2 regions in the EU-28 where fewer than 10 % of the foreign-born residents had a tertiary level of educational attainment in 2011, and they were: four regions from the Czech Republic (Jihozápad, Severovýchod, Moravskoslezsko and Severozápad), two Polish regions (Lubuskie and Opolskie), the Ciudad Autónoma de Melilla (Spain) and the French overseas region of Guyane; the latter had the lowest share in the EU-28 at 6.2 %.
See also
- All articles from People in the EU: who are we and how do we live?
Further Eurostat information
Main tables
- Population (t_demo_pop)
- Fertility (t_demo_fer)
- International Migration (t_migr_int)
- Marriage and divorce (t_demo_nup)
Database
- Immigration (migr_immi)
- Emigration (migr_emi)
- Acquisition and loss of citizenship (migr_acqn)
Dedicated section
Other information
- EU legislation on the 2011 Population and Housing Censuses - Explanatory Notes
- Legislation relevant for the population and housing census
- Demographic statistics: a review of definitions and methods of collection in 44 European countries
- Legislation relevant for population statistics
External links
- European website on intercultural dialogue
- European website on diversity management
- European website on integration
- European Commission — Directorate-General for home affairs — Migration
- European Commission — Directorate-General for home affairs — Common European asylum system
