Archive:Being young in Europe today - education
- Data extracted in March 2015. Most recent data: Further Eurostat information, Main tables and Database.
This article is part of a set of statistical articles based on the Eurostat flagship publication 'Being young in Europe today' (which can be consulted in order to get a layouted pdf version). The right to education for children and young people contribute to their overall development and consequently lays the foundations for later success in life in terms of employability, social integration, health and wellbeing. Education and training play a crucial role in counteracting the negative effects of social disadvantage. The European Union (EU) therefore wants all children and young people to be able to access and benefit from high-quality education, care and training.
Each EU Member State is responsible for its own education and training systems and the EU’s role consists in coordinating and supporting the actions of its Member States as well as addressing common challenges. The EU offers a forum for exchange of best practices, gathers and disseminates information and statistics, and provides advice and support for policy reforms.
This article presents a range of statistics covering children’s and young people’s education in the EU, the main sources of data being the joint UNESCO-UIS/OECD/Eurostat (UOE) questionnaires on education statistics, which constitute the core database on education. Childcare data, coming from the EU statistics on income and living conditions (EU-SILC), complement the analysis for the youngest children. Data on outcomes of education collected through the EU labour force survey (LFS) are also analysed in this article in terms of educational attainment and early school leavers.
Main statistical findings
Childcare attendance and participation in education
Early childhood education and care (ECEC) can potentially increase children wellbeing, advance children’s rights and ensure that all children have a fair start in life. A number of studies during the last decade showed indeed the crucial effect of early life experiences on cognitive function, education performance and life chances [1].
Increasing access to high-quality ECEC is one of the goals of the strategic framework in education and training (ET2020) that calls for the participation of at least 95 % of children between the age of 4 and compulsory school age by 2020, addressing child poverty and preventing early school leaving, two of the headline targets of the Europe 2020 strategy.
Childcare services for children under the age of 3 are also at the heart of the EU policies. The ‘Barcelona target’ defined in 2002 by the European Council to improve the provision of childcare in the EU Member States, through an agreement to ‘remove disincentives to female labour force participation and strive […] to provide childcare to at least 33 % of children under three years of age’ is still valid today.
Improvements still need to be made in the availability of childcare services, especially in the Czech Republic, Slovakia and Poland
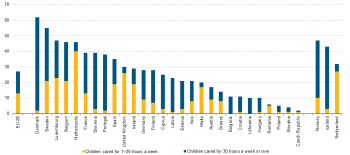
Figure 1 shows the proportion of children under the age of 3 cared for under formal arrangements, namely in day-care centre, in 2013. The rates are broken down by the number of hours during which care is provided (over and under 30 hours per week).
WHAT IS THE DIFFERENCE BETWEEN FORMAL AND INFORMAL CHILDCARE?
Formal childcare:
- Childcare at day-care centre organised/controlled by public or private structure.
Informal childcare:
- Childcare by a professional child-minder at child’s home or at child-minder’s home;
- Childcare by grandparents, other household members (outside parents), other relatives, friends or neighbours.
In 2013, the EU-28 average was below the Barcelona target for childcare facilities with 27 % of children up to 3 years attending formal childcare (versus 33 % for the target). Nevertheless, large differences could be observed across countries. Nine EU Member States reached the Barcelona objective, with attendance rates higher than one third in Denmark (62 %), Sweden (55 %), Luxembourg (47 %), Belgium and the Netherlands (both 46 %), France and Slovenia (both 39 %), Portugal (38 %) and Spain (35 %). In contrast, the rate of attendance in childcare services for children aged less than 3 years was very low in the Czech Republic (2 %), Slovakia (4 %) and Poland (5 %).
(%)
Source: Eurostat (ilc_caindformal)
Among countries that have reached the Barcelona target, Denmark, Slovenia, Portugal and Sweden had the highest childcare attendance in 2013 when taking into account the 30-hours a week threshold (with 60 %, 36 %, 36 % and 34 % respectively of children cared for 30 hours a week or more).
Participation in early childhood education increasing steadily
Children who have attended pre-primary education tend in most countries to perform better in school than those who have not, even after accounting for the socio-economic background. Early childhood education helps to build a strong foundation for lifelong learning and to ensure fair access to later learning opportunities. Many countries have recognised this by making pre-primary education almost universal for children by the time they are 3 or 4 years old [2].
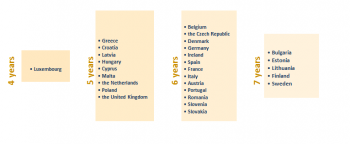
Compulsory school age is reached by children who are 6 years old in thirteen EU Member States, while in nine EU Member States compulsory education starts at the age of 5 (Figure 2). Luxembourg is the only country in the EU-28 where children start compulsory education at the age of 4, whereas in Sweden, Estonia, Bulgaria, Lithuania and Finland children compulsory education starts at the age of 7.
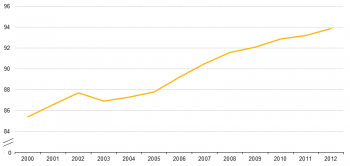
As presented in Figure 3, the ET2020 benchmark calling for the participation of at least 95 % of children between the age of 4 and the starting age of compulsory education was almost achieved in 2012, with 93.9 % of ECEC attendance. The percentage of children in early education at EU-28 level increased steadily from 2000 to 2012, except for a slight drop in 2003–04, reaching its highest rate so far in 2012.
(% of children of the corresponding age group)
Source: Eurostat (educ_ipart)
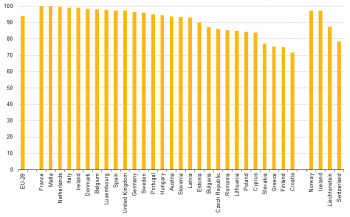
At country level (Figure 4) the highest percentages of children in early education were found in 2012 in France and Malta (100 %), followed by the Netherlands (99.6 %), Italy (99.2 %) and Ireland (99.1 %). In nearly half of the EU Member States (13 of 28 EU Member States), the participation rate was higher than the ET2020 benchmark. Hungary, Austria, Slovenia, Latvia and Estonia were close to the target with rates between 90 and 95 %. The rates of ten EU Member States were consequently below 90 %, with the lowest rates seen in Croatia (71.7 %), Finland (75.1 %) and Greece (75.2 %).
There is a trend towards requiring children to start education at a younger age, with several countries having lowered their school starting ages recently and others making pre-school attendance compulsory.
(% of children of the corresponding age group)
Source: Eurostat (educ_ipart)
The number of hours per week that young children attend formal care arrangements (including pre-school education, childcare at centre-based services outside school hours and childcare at day-care centres) is another important dimension to consider. Indeed, a longer day enables children to receive more individualised instruction and to have more time interacting with their peers, as well as enables parents to engage in gainful employment.
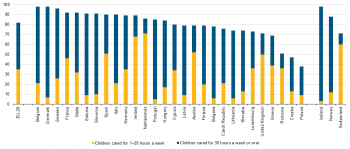
Available data shows that on a total of 82 % of children from the age of 3 to the minimum compulsory school age who attended formal care in the EU-28 in 2013, 47 % attended ECEC 30 hours a week or more, while 35 % did it between 1 and 29 hours a week (Figure 5).
EU Member States with the highest share of children between 3 years old and the minimum compulsory school age cared for by formal arrangement 30 hours a week or more are Denmark (91 %), Estonia (82 %), Slovenia (81 %) and Portugal (80 %). In contrast, the Netherlands and Romania (both 15 %) as well as Ireland and the United Kingdom (both 21 %) recorded the lowest proportion of children of that age attending formal care 30 hours a week or more.
(%)
Source: Eurostat (ilc_caindformal)
Half of the children aged less than 3 years are cared for only by their parents
Early childhood education and care arrangements vary in different countries and families have generally a range of options from which to choose. Some parents choose to care for their children themselves without making use of childcare services. At EU-28 level, just half (50 %) of children aged less than 3 years were cared for only by their parents in 2013 (Figure 6). The highest rates amongst EU Member States were found in Bulgaria (81 %), Slovakia (71 %) and Lithuania (70 %), while the lowest rates were found in the Netherlands (29 %), Portugal (30 %) and Cyprus (31 %).
Looking at children from 3 years to the starting age of compulsory education, the share of children only cared for by their parents drops substantially in the EU-28, to only 10 % in 2013. The countries with the highest rates of children from 3 to compulsory school age cared for only by their parents were Poland (39 %) and Croatia (35 %). The lowest rates were found in Belgium, Denmark and Sweden (all three 2 %), followed by France and Slovenia (both 4 %).
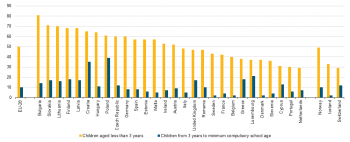
(% over the population of each age group)
Source: Eurostat (ilc_caparents)
Informal childcare concerns 30 % of children aged less than 3 years
Some children are cared for by other types of informal childcare meaning they are cared for either by a professional child-minder at the children’s home or at the child-minders’ home or cared for by grand-parents, other household members (outside parents), relatives, friends or neighbours.
As presented in Figure 7, 30 % of children aged less than 3 years were cared for by other types of childcare in the EU-28 in 2013, against 29 % of children from 3 to compulsory school age.
Informal childcare can — although it does not have to — be combined with formal childcare, meaning that some of the children who are recorded as cared for under informal childcare also attended formal childcare for part of the week.
At country level, the highest rates of children aged less than 3 years attending informal childcare were found in the Netherlands (54 %), Greece (52 %), Cyprus (51 %) and Romania (50 %). In contrast, the northern EU Member States Denmark (1 %), Sweden and Finland (both 3 %) presented the lowest rates. As regards children aged from 3 to compulsory school age, Romania (63 %), the Netherlands (61 %) and Slovenia (52 %) had the highest rates, whereas the lowest were recorded in the same three northern countries Denmark (0 %), Sweden and Finland (both 3 %).
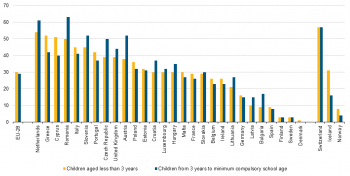
(% over the population of each age group)
Source: Eurostat (ilc_caindother)
More data and contextual information on ECEC can be found in the Eurydice Key Data on Early Childhood Education and Care in Europe 2014 report. The Education and Training Monitor annual series produced by DG Education and Culture also provides more detailed information on the progress on the ET2020 benchmarks.
Very high enrolment rates in primary and secondary education in most EU Member States
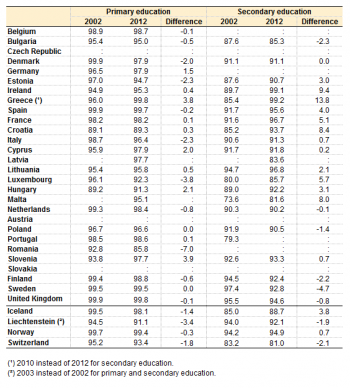
The net enrolment rate for primary education was 95 % or above in 20 EU Member States in 2012, and even above 97.5 % in 14 EU Member States (namely Belgium, Denmark, Germany, Greece, Spain, France, Cyprus, Latvia, the Netherlands, Portugal, Slovenia, Finland, Sweden and the United Kingdom). The enrolment rates for secondary (lower and upper secondary together) education were a bit lower, but still higher than 95 % in five EU Member States, on the basis of available data (namely Ireland, Greece, Spain, France and Lithuania) (Table 1).
The lowest participation rates in primary education were registered in Romania (85.8 %), Hungary (91.3 %) and Luxembourg (92.3 %), while Malta (81.6 %), Latvia (83.6 %) and Bulgaria (85.3 %) bottom ranked in enrolment rates for secondary education.
It should be noted that the legal requirements concerning the start and end of compulsory education influence the level of educational enrolment, and consequently the national enrolment rates in education depends on the national regulation in terms of compulsory education.
Despite the resource mobilisation campaigns and political commitments, the share of children attending compulsory education decreased in several EU Member States over the last decade. Nevertheless, the enrolment rates in compulsory education are still close to 100 % in most EU Member States.
The net enrolment rate in primary (respectively secondary) education is the percentage of children of the primary (respectively secondary) school age who are enrolled in primary (respectively secondary) education.
Although primary and secondary school enrolment figures remain low in countries around the world, they are on the increase
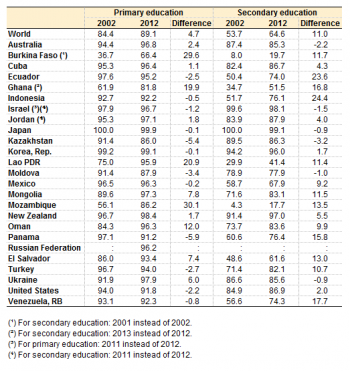
The enrolment rate at world level for primary education was 89.1 % in 2012 with, using the data available, Japan (99.9 %), the Republic of Korea (99.1 %) and New Zealand (98.4 %) recording the highest rates. In contrast, Burkina Faso (66.4 %), Ghana (81.8 %), Kazakhstan (86.0 %) and Mozambique (86.2 %) corresponded to the lowest rates.
For secondary education the world enrolment rate was lower than for primary education, at 64.6 % in 2012. Japan (99.1 %), Israel (98.1 %), New Zealand (97.0 %) and the Republic of Korea (96.0 %) however recorded rates above 90 %. Mozambique (17.7 %) and Burkina Faso (19.7 %) stood at the other extreme of the range with enrolment rates below 20 %.
Comparing figures from 2002 and 2012, world enrolment rates in primary (+ 4.7 percentage points) and secondary (+ 11.0 percentage points) education have increased significantly. At country level, on the basis of available data, the biggest increases in enrolment rates in primary education were recorded in two African nations: Mozambique (+ 30.1 pp) and Burkina Faso (+ 29.7 pp). The largest decreases in primary education, on the other hand, were registered in Panama (- 5.9 pp) and Kazakhstan (- 5.4 pp). The largest increases in secondary education enrolment rates were found in Indonesia (+ 24.4 pp) and Ecuador (+ 23.6 pp), while the largest decreases were registered in Kazakhstan (- 3.2 pp), Australia (- 2.2 pp) and Switzerland (- 2.1 pp).
PRIMARY ENROLMENT TARGETS IN EDUCATION FOR ALL (EFA) AND IN THE MILLENNIUM DEVELOPMENT GOALS (MDGS)
At the turn of the 21st century, the international community reached a consensus and pledged to achieve universal primary education (UPE) and gender parity. In 2000, the Dakar Framework for Action and the United Nations Millennium Declaration reaffirmed the notion of education as a fundamental human right.
EFA Goal 2 The goal is to ensure that by 2015 all children, particularly girls, children in difficult circumstances and those belonging to ethnic minorities, have access to, and complete, free and compulsory primary education of good quality (UNESCO, 2000).
MDG Goal 2 The goal is to ensure that, by the year 2015, children everywhere, boys and girls alike, will be able to complete a full course of primary schooling (United Nations, 2000).
Larger discrepancies between EU Member States in enrolment in education for young people than for children, especially in older age groups
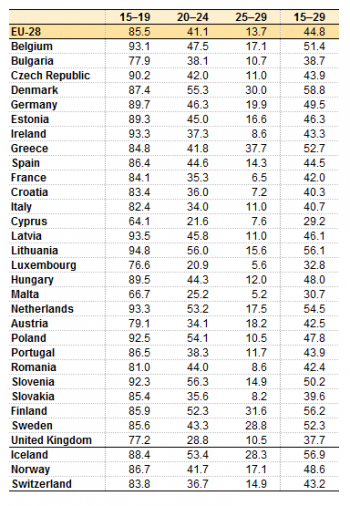
From the 91.8 million young people aged 15–29 living in the EU-28 in 2012, approximately 41 million were enrolled in education. While at EU level the enrolment rate was 45 %, it varied between about 30 % and 60 % across countries. In eight EU Member States over 50 % of young people attended an educational programme. Denmark was the country with the highest share (59 %), followed by Finland, Lithuania and the Netherlands (around 55 % each). The lowest rates were registered in Cyprus (29 %), Malta (31 %) and Luxembourg (33 %), which are all countries where many young people study abroad.
The enrolment rate decreases with age. On average, 85 % of the young people aged 15–19 are enrolled in education. This proportion decreases almost by half for young people aged 20–24 (41 %), while only 14 % of young people aged 25–29 are still in education.
Over the last 10 years enrolment rates have generally increased in the EU. While there was a continuous growth between 2002 and 2012 for the 20–24 age group, with the EU enrolment rate going from 35 % in 2002, to 38 % in 2007 and 41 % in 2012, the EU enrolment rate for the age group 25–29 was stable between 2002 and 2007 (both years at 11 %) growing afterwards to reach 14 % in 2012. Different patterns can nevertheless be found across EU Member States. Figures 8 and 9 illustrate the differences in enrolment rates between countries and their evolution over time for the 20–24 and 25–29 age groups.
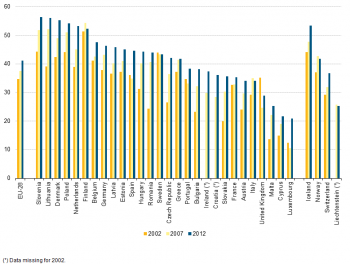
(%)
Source: Eurostat (educ_enrl1tl)

(%)
Source: Eurostat (educ_enrl1tl)
The first thing to be noted is that there are large differences between EU Member States with regard to the participation in education of young people aged 20–24. In 2012, the highest enrolment rates were observed in Slovenia and Lithuania (56 %), while the lowest rates were seen in Luxembourg and Cyprus (about 20 %), followed by Malta and the United Kingdom (with rates below 30 %). Taking into consideration the evolution between 2007 and 2012, an increase in enrolment rates can be observed in almost all EU Member States. The largest increase was observed in Luxembourg, the country with the lowest enrolment rate for this age group. Compared to 2007, the percentage of people aged 20–24 enrolled in education in 2012 was two times higher. A possible explanation for this could be the expansion of the University of Luxembourg, which was founded in 2003. Important growths could also be observed in Spain (+ 10 pp), the Netherlands, Croatia and Ireland (all three + 8 pp).
For the 25–29 age group the disparities between EU Member States are even higher. While in Malta and Luxembourg only around 5 % of people aged 25–29 were enrolled in education in 2012, in Greece the enrolment rate of 38 % was almost eight times higher. High enrolment rates for this age group can also be observed in Finland, Denmark and Sweden (around 30 %). The analysis of the time trend reveals that in most EU Member States the proportion of young people aged 25–29 enrolled in education increased between 2007 and 2012. The highest increase, from 12 % in 2007 to 38 % in 2012, was registered in Greece. In Luxembourg, Austria, Germany and the Netherlands, a more moderate increase, between 4 and 6 percentage points, occurred.
The disparities between EU Member States result from a combination of several factors: country specific organisation of education systems, legal requirements concerning the end of compulsory education, accessibility and affordability of non-compulsory education, and situation on the labour market. While the enrolment rate of young people aged 15–19 is rather linked to country-specific legal requirements on compulsory education, the enrolment rate for people aged 20–29 is linked more to socio-economic criteria, especially the employment situation (in many cases, young people stay longer in education as they cannot find a job).
More skills, more languages — increasing your opportunities in the EU
The ability to speak foreign languages promotes the intercultural dialogue in Europe, improves employability and facilitates the free movement of workers across the EU. Furthermore, research has shown that at individual level, learning foreign languages at an early age in general fosters the cognitive capacities of children, such as comprehension, expression, communication and problem-solving [3].
The share of pupils in primary education (ISCED level 1) who learned two or more foreign languages was 4.7 % in the EU-28 in 2012. This represents nearly 2 percentage points more than 5 years before (2.9 % in 2007).
Figure 10 shows that Luxembourg topped the list of EU Member States for the percentage of pupils at ISCED level 1 learning two or more foreign languages, both in 2007 and 2012 (83.0 % and 83.9 % respectively). Greece (31.1 %), Estonia (26.6 %) and Croatia (18.4 %) also recorded high shares of ISCED 1 pupils learning two or more foreign languages in 2012.
Several EU Member States managed to significantly increase their share of pupils learning two or more foreign languages in primary education in the 5-year period, namely Greece (+ 24.4 pp between 2006 and 2012) as well as Poland and Malta (both + 12.7 pp between 2007 and 2012).
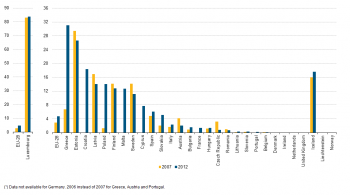
(%)
Source: Eurostat (educ_thfrlan)
THE ISCED STANDARD
The International Standard Classification of Education (ISCED) is an instrument suitable for assembling, compiling and presenting comparable statistics and indicators on education. It presents standard concepts and definitions and classifications. Applied until 2013, the ISCED 97 classification comprises seven levels of education:
Level 0: Pre-primary education — the initial stage of organised instruction; it is school- or centre-based and is designed for children aged at least three years.
Level 1: Primary education — begins between five and seven years of age, is the start of compulsory education where it exists and generally covers six years of full-time schooling.
Level 2: Lower secondary education — continues the basic programmes of the primary level, although teaching is typically more subject-focused. Usually, the end of this level coincides with the end of compulsory education.
Level 3: Upper secondary education — generally begins at the end of compulsory education. The entrance age is typically 15 or 16 years. Entrance qualifications (end of compulsory education) and other minimum entry requirements are usually needed.
Level 4: Post-secondary non-tertiary education — between upper secondary and tertiary education. This level serves to broaden the knowledge of ISCED level 3 graduates.
Level 5: Tertiary education (first stage) — entry to these programmes normally requires the successful completion of ISCED level 3 or 4. This includes tertiary programmes with academic orientation (type A) which are largely theoretical and tertiary programmes with an occupational orientation (type B).
Level 6: Tertiary education (second stage) — leads to an advanced research qualification (Ph.D. or doctorate)
Figure 11 reveals significantly higher rates of pupils studying two or more foreign languages at ISCED level 2 than level 1 across the EU Member States. The EU-28 share of pupils in lower secondary education learning two or more foreign languages reached 64.8 % in 2012. Looking at the evolution over time, this share grew by nearly 10 percentage points in the last 5 years (53.9 % in 2007).
At country level, the highest figures were registered in Luxembourg, Italy, Finland, Greece, Malta and Romania for both 2007 and 2012 with values exceeding 95 %. The lowest figures in 2012 were seen in Hungary (6.0 %), Ireland (9.2 %) and Austria (9.7 %). Poland who recorded one of the lowest percentages in 2007 (8.5 %) ranked the in the top 10 in 2012 with 93.4 % of pupils in lower secondary education learning two or more foreign languages.
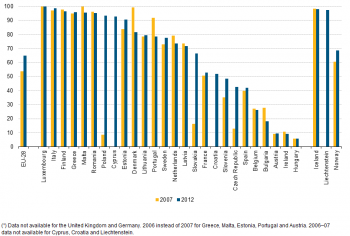
(%)
Source: Eurostat (educ_thfrlan)
Learning foreign languages in upper secondary schools: different programmes, different opportunities
School is the most important place to acquire foreign languages, and in many EU Member States the upper secondary education curricula include at least one foreign language. Figure 12 depicts the situation of language learning in upper secondary education taking into consideration the programme orientation: either general or vocational/prevocational.
At EU-28 level, 51 % of pupils enrolled at ISCED level 3 learned at least two foreign languages at school in 2012, against 42 % of pupils enrolled at that level in vocational/prevocational training. In Romania, almost all pupils enrolled in ISCED level 3 were taught at least two foreign languages at school. The situation varied across the other EU Member States. In Luxembourg, Finland, Slovakia, the Czech Republic, Romania, Slovenia, France and Estonia more than 9 in 10 pupils enrolled in a general ISCED 3 programme learned at least two foreign languages at school. Learning two or more foreign languages at school remains uncommon in only a few countries: Greece (3.5 %), the United Kingdom (4.4 %), Portugal (5.3 %) and Ireland (7.6 %) with percentages below 10 %.

(%)
Source: Eurostat (yth_educ_040)
Reading, mathematical and science skills: there is room for improvement in most EU Member States
Competences in reading, mathematics and sciences are considered to be basic skills as they are key elements for a successful professional and civic life. Having recognised that they are also vital for the full participation in the knowledge society and to ensure the competitiveness of modern economies, the Council has adopted an EU-wide benchmark (ET2020 framework) to reduce the proportion of 15-year-olds underachieving in these areas of learning, to less than 15 % by 2020. Data on reading, mathematics and science achievement of 15-year old students are collected through the PISA survey.
WHAT IS PISA?
PISA (Programme for International Student Assessment) is an internationally standardised assessment, developed by the OECD and conducted in almost all EU Member States but Malta and Cyprus. It measures the knowledge and skills of 15-year-old students in reading, mathematics and science. It also collects contextual information on the individual characteristics and socio-economic background of the students. The PISA scores are divided into six proficiency levels ranging from the lowest, level 1, to the highest, level 6. Low achievement is defined as performance below level 2.
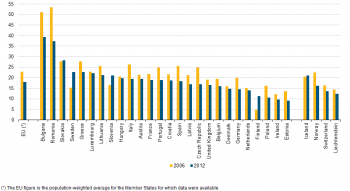
PISA results on low-achievers in reading literacy for 2012 showed large differences between EU Member States. Estonia, Ireland, Poland and Finland stood out for their low rates of low-achievers in reading competence (around 10 %). At the other end of the scale we found Bulgaria and Romania with high rates of low-achievers in reading (37.3 % and 39.4 %). In 2012 only seven countries reached the EU benchmark of less than 15 % (Estonia, Ireland, Poland, Finland, the Netherlands, Germany and Denmark).
In PISA, reading literacy is defined as understanding, using and reflecting written texts, in order to achieve one's goals, to develop one's knowledge and potential and to participate in society.
Nevertheless, overall across the EU there is a steady trend towards improvement in reading skills. In almost all EU Member States the low-achieving rate declined between 2006 and 2012. The most important progress was observed in Romania (a difference of 16 pp), followed by Bulgaria (almost 12 pp). But in three EU Member States (Sweden, Finland and Slovenia) the proportion of low-achievers went up in comparison to their 2006 level.
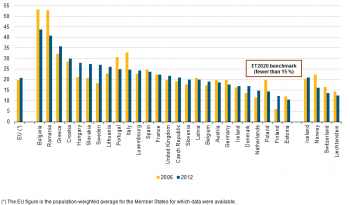
The rates of low-achievers in mathematics vary widely across the 26 EU Member States covered by the PISA programme. The lowest rates were found in Estonia (10.5 %) and Finland (12.3 %) in 2012, while the highest were in Bulgaria (43.8 %) and Romania (40.8 %). The situation is less encouraging than that for reading literacy. The rates of low-achievers in mathematics were below the EU benchmark in only four countries (Estonia, Finland, Poland and the Netherlands) in 2012. Moreover, taking the time dimension into account, the share of low-achieving students in mathematics in 2012 remained on average the same as in 2006. An important drop in the rates of low-achievers in mathematics (more than 5 percentage points) was nevertheless registered in five EU Member States: Poland, Portugal, Italy, Bulgaria and Romania. In the other EU Member States no significant decrease or even increase in the proportion of low-achievers occurred.
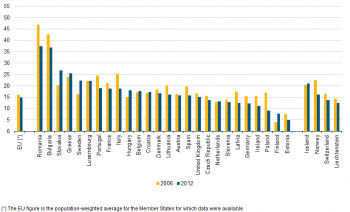
With regard to science literacy, the situation is similar to that of mathematics: the best performers in 2012 were Estonia, Finland and Poland, with rates between 5 % and 9 %, while the worst performers were Romania and Bulgaria with low-achieving rates of around 37 %. Between 2006 and 2012, a decline in the proportion of low-achievers could be observed in two thirds of the EU Member States. The highest reduction took place in Romania (9.6 pp) and Poland (8 pp). Significant increases (more than 3 pp difference) only occurred in four EU Member States (Hungary, Finland, Sweden and Slovakia).
Overall, the 2012 results of PISA indicate that performance in reading, mathematics and science correlate with each other. EU Members States that show certain skill levels in one of the areas tend to perform similarly in the others. The main factor explaining this situation is the general organisation of the education system in each EU Member State. However, other factors such as socio-economic background, participation in early childhood education or migrant status were also found to play a role [4].
Early school leavers: situation improving in almost all EU Member States, especially for women
Secondary education is an important stage in an individual’s personal and professional development. Unfortunately, many young people leave the education system without the skills necessary for a successful integration in the labour market.
WHO IS CONSIDERED AN EARLY SCHOOL LEAVER?
‘Early leavers from education and training’ refers to persons aged 18–24 with at most lower secondary education attainment and who are no longer in education or training.
The Europe 2020 benchmark is to bring the proportion of early leavers from education and training in the EU down to below 10 %. On this basis, the EU Member States have set national targets that reflect their starting position and national circumstances. In 2013, 11 EU Member States had already met or exceeded their national target for this indicator (Figure 16). At EU level, about 12 % of young people aged 18–24 were early school leavers. Early school leaving was rare in Croatia, Slovenia, the Czech Republic and Poland, with rates below 6 %. The highest rates were observed in Spain (24 %), followed by Malta (21 %) and Portugal (19 %). A reduction can be observed in most EU Member States over the last five years and in 2013 the EU-28 average was three percentage points lower than in 2008 (15 %). The largest drop (16 pp) was registered in Portugal.
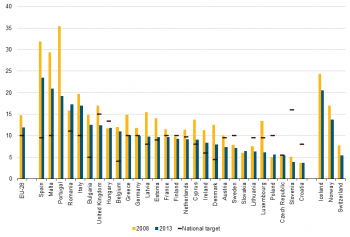
(%)
Source: Eurostat (edat_lfse_14)
On average, more young men (14 %) than young women (10 %) leave school. This trend applies to all EU Member States except Bulgaria and the Czech Republic, where the proportion was slightly higher among young women. The most pronounced gender gap was visible in Cyprus, where the rate for men was 11 percentage points higher than that for women, closely followed by Portugal, with a difference of 9 percentage points (Figure 17).
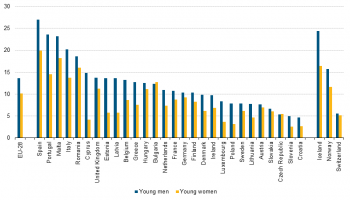
(%)
Source: Eurostat (edat_lfse_14)
Tertiary education: an increasing number of graduates, especially among women
Tertiary education — provided by universities and other higher education institutions, such as colleges, seminaries, institutes of technology, etc. — plays a key role in a knowledge-based society. The Europe 2020 benchmark stipulates that by 2020, at least 40 % of the population aged 30–34 should have completed tertiary education. This target was transposed into specific national targets to reflect the specificities of each EU Member States (Figure 18).
At EU level, over one third (37 %) of the population aged 30–34 had completed tertiary education in 2013 (41 % of women and 31 % of men). In Ireland, Luxembourg, Cyprus and Lithuania, the overall proportion of 30–34-year-olds with tertiary educational attainment stood at around 51 %. In contrast, the figures for Italy and Romania in this age group were around 22 %.
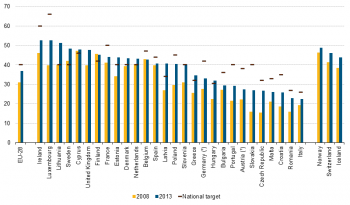
(%)
Source: Eurostat (edat_lfse_07)
Compared with 2008, there were more people with a tertiary educational level in 2013 in almost all EU Member States. The biggest increases were seen in Latvia (14 pp) and Luxembourg (13 pp).
The proportion of women with tertiary educational attainment was higher than that of men in all EU Member States (Figure 19). The gender gap was widest in Latvia (25 pp), followed by the other two Baltic States, Estonia and Lithuania (both around 20 pp). The smallest gender difference (around two percentage points) was registered in Germany and Austria.
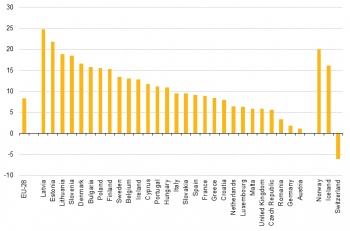
(percentage points)
Source: Eurostat (edat_lfse_07)
Student mobility: room for improvement in most EU Member States
Student mobility is seen as improving young people’s employability by helping them acquire key skills and competences, such as communication in a foreign language, intercultural understanding, social and civic participation, entrepreneurship, problem-solving skills and creativity in general. The EU set a benchmark referring both to mobility of graduates from higher education and mobility in vocational education and training (VET).
BENCHMARK ON STUDENT MOBILITY
In November 2011 the Council adopted a dual benchmark at EU level for 2020 on student mobility:
- at least 20 % of higher education graduates should have had a period of higher education-related study or training (including work placements) abroad, representing a minimum of 15 ECTS credits or lasting a minimum of three months;
- at least 6 % of 18–34-year-olds with an initial vocational education and training (VET) qualification should have had an initial VET-related study or training period (including work placements) abroad lasting a minimum of two weeks.
To monitor this benchmark, only partial data exist: the number of currently enrolled students who have spent some time in another EU Member State, EEA or candidate country. Figure 20 shows the percentages of students enrolled in a tertiary education institution in an EU Member State, EEA or candidate country other than their own in 2007 and 2012. Data reflect the mobility of students to obtain their degree or diploma but does not include students enrolled in credit mobility programmes.
In 2012 the highest student mobility rates were registered in Luxembourg (72 %) and Cyprus (52 %), followed by Slovakia (14 %), Ireland (13 %) and Malta (11 %). This could be explained by the fact that students often leave these countries to study in neighbouring countries with the same language and more diversified tertiary education systems. Students from the United Kingdom (1 %) and Spain (2 %) had the lowest mobility rates. In most countries, the outward mobility rate has slightly increased over the last five years.
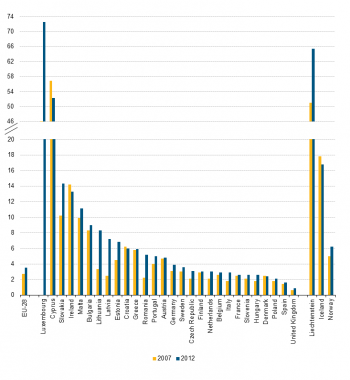
(%)
Source: Eurostat (educ_thmob)
The Erasmus programme, launched in 1987, is a Community action aimed at enhancing student mobility. It enables higher education students to study, train or work abroad for a period of at least three months as part of their studies. The programme guarantees that the period spent abroad is recognised by their university when they come back, as long as they fulfil previously agreed requirements.
Almost 250 000 EU students participated in the Erasmus programme in 2012/13. This represents less than 1 % of all EU students enrolled in tertiary education, but is still a measure of the programme’s success. The number of Erasmus students has increased in all EU Member States in the past five years.
Quality of childcare and school life
High-quality early education and childcare for young children improves their health and promotes their development and learning. While child poverty and labour market participation of parents are affected by a number of factors, there is no doubt that high-quality, affordable early-years and after-school services are essential both to the reduction of child poverty and to the labour market participation of parents, especially single parents [5].
Measuring the quality of formal childcare and education is difficult since there is no single indicator that adequately reflects the quality of the educational environment and the interaction between teachers and pupils. However some indicators can be taken into consideration; those linked to class sizes or to staff-to-child ratios: the lower the ratio, the better the quality of school life can be assumed. More specifically, quality of school life can be assessed through the study of multiple indicators such as the school likeness, the pupil-teacher ratio in all levels of education, class size and negative experiences such as bullying [6].
To that end, smaller pupil-teacher ratios often have to be weighed against higher teacher salaries, increased professional development and teacher training, greater investment in teaching technology, or more widespread use of assistant teachers and other paraprofessionals, whose salaries are often considerably lower than those of qualified teachers. As larger numbers of children with special needs are integrated into mainstream classes, more use of specialised personnel and support services may limit the resources available for reducing pupil-teacher ratios [7].
The pupil-teacher ratio in pre-primary education (ISCED 0) for 2012 is shown in Figure 21. Based on data available, the EU-21 average — meaning the average for the 21 EU Member States which are also members of the OECD (i.e. the 28 EU Member States except Bulgaria, Croatia, Cyprus, Latvia, Lithuania, Malta, and Romania) — stood at 13 pupils per teacher. This figure nevertheless hides large disparities among the 21 countries. The lowest ratios in the EU were observed in Iceland (5 pupils), Sweden (6 pupils) and Estonia (7 pupils) while the highest were recorded in France (21 pupils) and the United Kingdom (17 pupils).
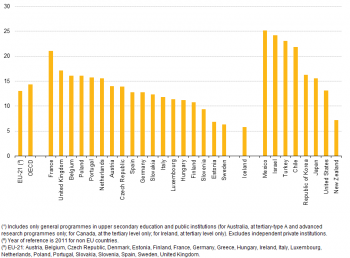
(calculations based on full-time equivalents)
Source: OECD, Education at a Glance, 2013; China: UNESCO Institute for Statistics (World Education Indicators Programme); Saudi Arabia: UNESCO Institute for Statistics and Observatory on Higher Education; South Africa: UNESCO Institute for Statistics. See Annex 3 for notes (http://www.oecd.org/edu/eag.htm)
Figure 22 presents the pupil-teacher ratio in ISCED 1 and ISCED 2 among the EU-28 Member States in 2012. In ISCED 1, Luxembourg’s ratio stands at 9 pupils per teacher, followed by Lithuania (10 pupils), Hungary, Latvia and Poland (all three 11 pupils). The highest ratios are about twice as much as pupils per teacher and are found in the United Kingdom, the Netherlands (both 21 pupils), France and the Czech Republic (both 19 pupils). The corresponding ratios in ISCED 2 vary from 4 to 23 pupils per teacher. The lowest ratios are found in Denmark, Lithuania, Latvia, Slovenia, Malta and Belgium (8 pupils or less) while the highest are recorded in Luxembourg (23 pupils), the Netherlands and France (both 16 pupils).
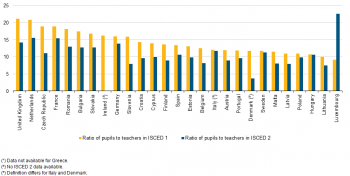
(number of full-time-equivalent pupils and students in the specific level of education by the number of full-time-equivalent teachers at the same level)
Source: Eurostat (educ_iste)
How does class size vary around EU Member States?
Class size (another indicator provided by countries) is a vastly debated topic and an important element of education policy among EU Member States. Smaller classes allow teachers to focus more on the needs of individual pupils and reduce the amount of time spent dealing with disruptions. Smaller class sizes may also influence parents when they select a school for their children. In this respect, class size may be viewed as an indicator of the quality of the school system. Yet evidence on the effects of differences in class size upon student performance is mixed [8].
As shown in Figure 23, all EU Member States had, on average, more than 15 pupils per class at ISCED 1 in 2012. Taking into consideration EU Member States with available data, the national average class size varies widely from about 15 to 25 pupils per classroom. The lowest figures were found in Lithuania (15 pupils), Latvia and Luxembourg (both 16 pupils), while the highest were found in the United Kingdom (25 pupils), Ireland (24 pupils), France and the Netherlands (both 23 pupils).The range at ISCED 2 was similar, varying from 15 pupils per classroom in Latvia, 16 pupils in Estonia and 19 pupils in Luxembourg and the United Kingdom to 25 pupils per classroom in Spain, Germany and France.
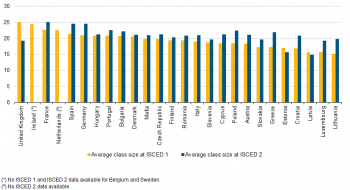
(number of pupils)
Source: Eurostat (educ_iste)
How much do countries spend on childcare and education?
Strong educational performance cannot be expected without sufficient resources invested in childcare and education services to ensure their effectiveness. However, increasing budget devoted to childcare and education does not automatically lead to improved education outcomes; the way the resources are used also matter [9].
PUBLIC EXPENDITURE AND PUBLIC SPENDING
Public expenditure on childcare and early educational services are a public financial support for families with children participating in formal day care services and pre-school institutions (including kindergartens and day-care centres, which usually provide an educational content as well as traditional care for children aged 3–5 years).
Public spending on childcare support per child relates to the expenditure on childcare divided by the number of children in that country aged under three, while public spending on pre-school care and education per child is calculated by dividing public spending on educational institutions by the number of children enrolled in those programs.
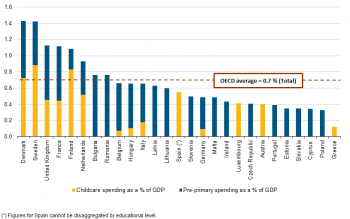
As shown in Figure 24, total public spending on childcare and early educational services in 2009 stood at over 1 % of GDP in Denmark, Sweden (both 1.4 %), the United Kingdom, France and Finland (all 1.1 %), while the OECD average was 0.7 %. The Slovak Republic (0.4 %), Cyprus, Poland (both 0.3 %) and Greece (0.1 %) were at the other end of the scale, below the OECD average.
Most countries spend more on pre-primary school care than childcare. This could partly be a reflection of coverage of a larger group of children.
Comparison of education expenditure as a percentage of GDP between the different education levels shows that expenditure for the secondary level of education (ISCED 2–4) were higher (2.23 % of GDP) in 2011 than for the primary (1.19 % of GDP) and pre-primary education (0.57 % of GDP) at the EU level. This was observed in all EU Member States, except Croatia and Luxembourg, where primary education corresponded to the highest expenditure.
For the combined pre-primary, primary and secondary education in the EU-28 the total expenditure amounted on average to 4 % of GDP in 2011, with Malta and Denmark recording the highest rates, between 6 and 7 % of their GDP.
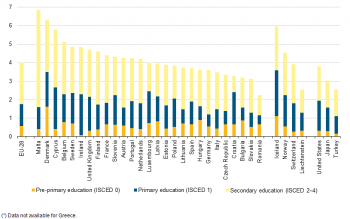
(% GDP)
Source: Eurostat (educ_figdp)
Data sources and availability
The aim of the education statistics is to provide comparable statistics and indicators on key aspects of the education systems across Europe. The data cover participation and completion of education programs by pupils and students, personnel in education and the cost and type of resources dedicated to education.
The main sources of annual data are the joint UNESCO-UIS/OECD/Eurostat (UOE) questionnaires on education statistics, which constitute the core database on education. The UOE data collection is an administrative data collection, compiled on the basis of national administrative sources, reported by Ministries of Education or National Statistical Offices. Countries provide data, coming from administrative records, on the basis of commonly agreed definitions. The UOE data collection is overseen jointly by the United Nations Educational, Scientific, and Cultural Organisation — Institute for Statistics (UNESCO-UIS), the Organisation for Economic Co-operation and Development (OECD), and Eurostat. Data on regional enrolments and foreign language learning are collected additionally by Eurostat.
Commission Regulation No 88/2011 regarding statistics on education and training systems is the EU legal base covering the above mentioned data. 2012 was the first year of application of the Regulation. The first data provided according to that Regulation refers to the school academic year 2010/2011 and, as far as data on education expenditure are concerned, to the financial year 2010. Data for previous years were reported on a voluntary basis from countries (i.e. so called gentlemen’s agreement).
Data on formal and Informal childcare are collected through the EU statistics on income and living conditions (EU-SILC), which is the reference data source for indicators related to income, living conditions and social inclusion.
On the other hand, statistics on educational attainment and early leavers come from the EU Labour Force Survey (LFS), which is another major source for European education statistics. The LFS is a large sample survey among private households which provides detailed annual and quarterly data on employment, unemployment and inactivity.
Context
STRATEGIC FRAMEWORK FOR EUROPEAN COOPERATION IN EDUCATION AND TRAINING
The strategic framework for European cooperation in education and training up until 2020 (ET2020) has been drawn up in 2009 with the main aim to support EU Member States in further developing their educational and training systems. These systems should better provide the means for all citizens to realise their potentials, as well as ensure sustainable economic prosperity and employability, with a view to creating a knowledge-based Europe and making lifelong learning a reality for all.
In order to measure progress achieved on these objectives, the framework defines benchmarks for 2020:
- at least 95 % of children (from 4 to compulsory school age) should participate in early childhood education;
- fewer than 15 % of 15-year-olds should be under-skilled in reading, mathematics and science;
- fewer than 10 % of young people should drop out of education and training;
- at least 40 % of people aged 30–34 should have completed some form of higher education;
- at least 15 % of adults should participate in lifelong learning;
- at least 20 % of higher education graduates and 6 % of 18–34 year-olds with an initial vocational qualification should have spent some time studying or training abroad;
- the share of employed graduates (20–34 year-olds having successfully completed upper secondary or tertiary education) having left education 1–3 years ago should be at least 82 %.
EUROPEAN STRATEGY FOR MULTILINGUALISM
At the 2002 Barcelona European Council, targets were set for the ‘mastery of basic skills, in particular by teaching at least two foreign languages from a very early age’. Since then, linguistic diversity has been encouraged throughout the EU, in the form of learning in schools, universities, adult education centres and company training.
The European Commission adopted in 2008 the Communication ‘Multilingualism: an asset for Europe and a shared commitment’ (COM(2008) 566 final), which was followed by a Council Resolution on a European strategy for multilingualism (2008/C 320/01). Addressing multilingualism in the broader context of social cohesion and economic prosperity, the Communication urges the EU Member States to do more in order to achieve the Barcelona objective of enabling the citizens of the EU to communicate in two languages in addition to their mother tongue.
In 2014, these recommendations were endorsed in the Council Conclusions on multilingualism and the development of language competences which stated that EU Member States should assess and monitor progress in developing language competences in the national context. Such assessment should cover all four language skills: reading, writing, listening and speaking. EU Member States agreed to adopt and improve measures aimed at promoting multilingualism from an early age and at enhancing the quality and efficiency of language learning and teaching.
See also
- All articles from the publication Being young in Europe today
- All articles on Education and training
Further Eurostat information
Main tables
- Living conditions (t_ilc_lv)
- Childcare arrangements (t_ilc_ca)
- Education (t_educ)
- Education indicators - non-finance (t_educ_indic)
- Indicators on education finance (t_educ_finance)
- Student mobility and foreign students in tertiary education (t_educ_mo)
- Thematic indicators - Progress towards the Lisbon objectives in education and training (t_educ_them_ind)
- Educational attainment and outcomes of education (t_edat)
- Transition from education to work, early leavers from education and training (t_edatt)
- Educational attainment level: main indicators (t_edatm)
Database
- Living conditions (ilc_lv)
- Childcare arrangements (ilc_ca)
- Education (educ)
- Education indicators - non-finance (educ_indic)
- Indicators on education finance (educ_finance)
- Student mobility and foreign students in tertiary education (educ_mo)
- Thematic indicators - Progress towards the Lisbon objectives in education and training (educ_them_ind)
- Educational attainment and outcomes of education (edat)
- Transition from education to work, early leavers from education and training (edatt)
- Educational attainment level: main indicators (edatm)
- Youth education and training (yth_educ)
Dedicated section
Methodology / Metadata
- Income and living conditions (ilc) (ESMS metadata file - ilc_esms)
- Education (educ) (ESMS metadata file - educ_esms)
- Educational attainment and outcomes of education (edat) (ESMS metadata file - edat_esms)
Source data for tables, figures and maps (MS Excel)
Other information
- Presidency conclusions — Barcelona European Council, 15 and 16 March 2002
- Commission Regulation (EU) No 88/2011 of 2 February 2011 implementing Regulation (EC) No 452/2008 of the European Parliament and of the Council concerning the production and development of statistics on education and lifelong learning, as regards statistics on education and training systems
- Communication from the Commission COM/2008/0566 final of 18 September 2008 on 'Multilingualism: an asset for Europe and a shared commitment'
- Council Resolution 2008/C 320/01 of 21 November 2008 on a European strategy for multilingualism
- Council conclusions 2014/C 183/06 of 20 May 2014 on multilingualism and the development of language competences
External links
Publications
- Augustine J.M. et al. (2009): Maternal Education, Early Child Care and the Reproduction of Advantage. Social Forces 2009 September; 88(1): 1–29
- Gamoran A. (1999): Effects of Non-maternal Child Care on Inequality in Cognitive Skills, Institute for Research on Poverty Discussion Paper n°1186–99
- Heckman, J.J. (2008): Schools, Skills and Synapses. Economic Enquiry, Vol. 46, N°3, July 2008, 289–324
- Vandell D.L. et al (2010): Do Effects of Early Child Care Extend to Age 15 Years? Results from the NICHD study of early child care and youth development, Child Development 81(3): 737–756
- OECD, Education at a glance, Paris, 2011
- Barnardos and Start Strong, Towards a Scandinavian childcare system for 0–12-year-olds in Ireland?, 2012
Notes
- ↑ Augustine J.M. et al. (2009): Maternal Education, Early Child Care and the Reproduction of Advantage. Social Forces 2009 September; 88(1): 1–29
Gamoran A. (1999): Effects of Non-maternal Child Care on Inequality in Cognitive Skills, Institute for Research on Poverty Discussion Paper n°1186–99
Heckman, J.J. (2008): Schools, Skills and Synapses. Economic Enquiry, Vol. 46, N°3, July 2008, 289–324
Vandell D.L. et al (2010): Do Effects of Early Child Care Extend to Age 15 Years? Results from the NICHD study of early child care and youth development, Child Development 81(3): 737–756 - ↑ OECD, Education at a glance, ‘Chapter C: Access to Education, Participation and Progression’, Paris, 2011
- ↑ Commission Staff Working Paper, 2011
- ↑ DG EAC: PISA 2012: EU performance and first inferences regarding education and training policies in Europe
- ↑ Barnardos and Start Strong, Towards a Scandinavian childcare system for 0–12-year-olds in Ireland?, 2012
- ↑ See the article Being young in Europe today - digital world of this publication
- ↑ OECD, Education at a glance, Paris, 2011
- ↑ id. ibid.
- ↑ See the ‘Education and Training Monitor 2014’ (http://ec.europa.eu/education/library/publications/monitor14_en.pdf)
