Hourly labour costs
Data extracted in April 2024
Planned article update: 27 March 2025
Highlights
This article provides recent statistics on hourly labour costs in the European Union (EU).
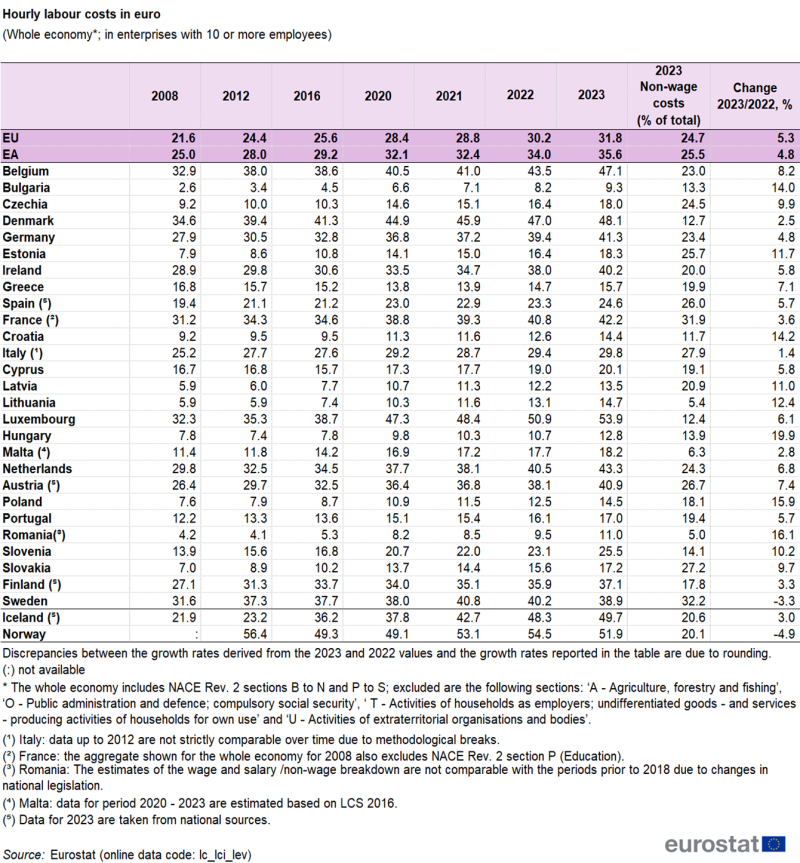
In 2023, average hourly labour costs were estimated at €31.8 in the EU and at €35.6 in the euro area. However, this average masks sizeable gaps between EU Member States, with hourly labour costs ranging from €9.3 in Bulgaria to €53.9 in Luxembourg.
When comparing labour cost estimates in euro over time, it should be noted that the data for the EU Member States outside the euro area are influenced by the exchange rate movements.
Full article
Hourly labour costs ranged between €9.3 and €53.9 in 2023
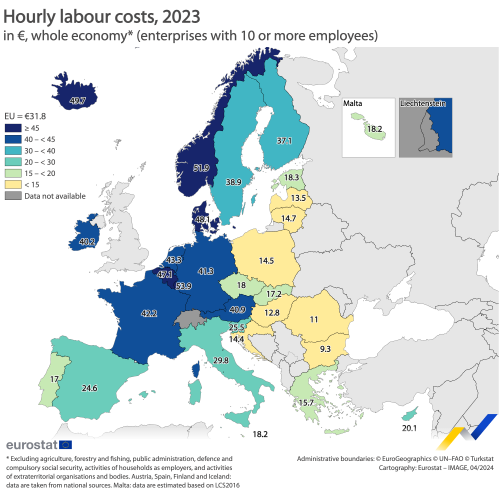
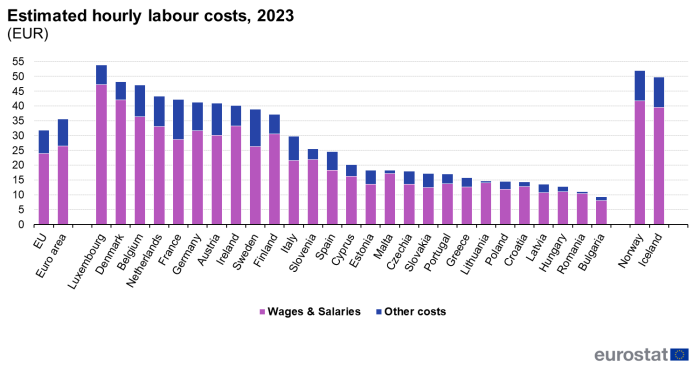
In 2023, average hourly labour costs in the whole economy (see paragraph 'Data sources') were estimated to be €31.8 in the EU and €35.6 in the euro area. However, this average masks sizeable differences between EU Member States, with the lowest hourly labour costs recorded in Bulgaria (€9.3), Romania (€11.0) and Hungary (€12.8), and the highest in Luxembourg (€53.9), Denmark (€48.1) and Belgium (€47.1). Figure 1 shows the labour costs across EU Member States.
Source: Eurostat (lc_lci_lev)
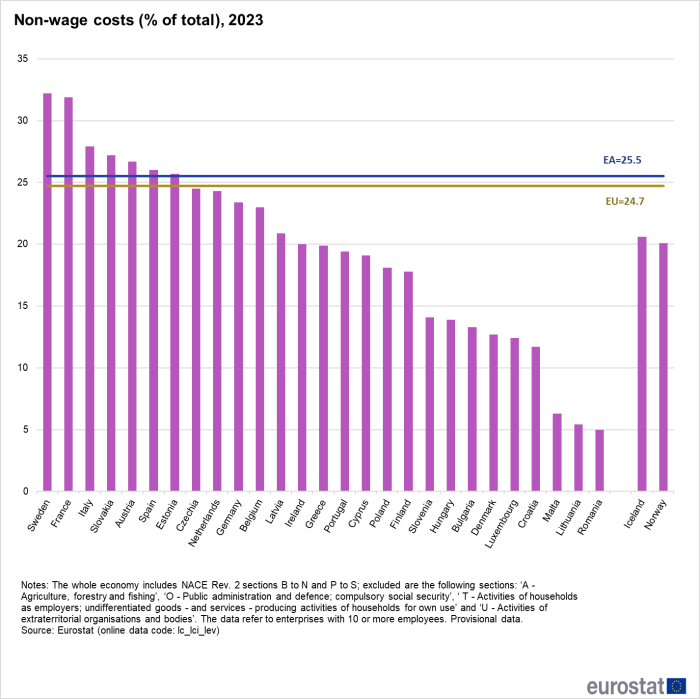
The two main components of labour costs are wages & salaries and non-wage costs such as employers' social contributions. The share of non-wage costs in the whole economy was 24.7 % in the EU and 25.5 % in the euro area (see Table 1 and Figure 2).
These estimates for 2023, published by Eurostat, cover enterprises with 10 or more employees and are based on the 2020 Labour cost survey (LCS2020), except for Malta (based on LCS2016). They are extrapolated with the corresponding annual growth rates from Labour cost index.
Labour costs per hour lowest in the construction sector
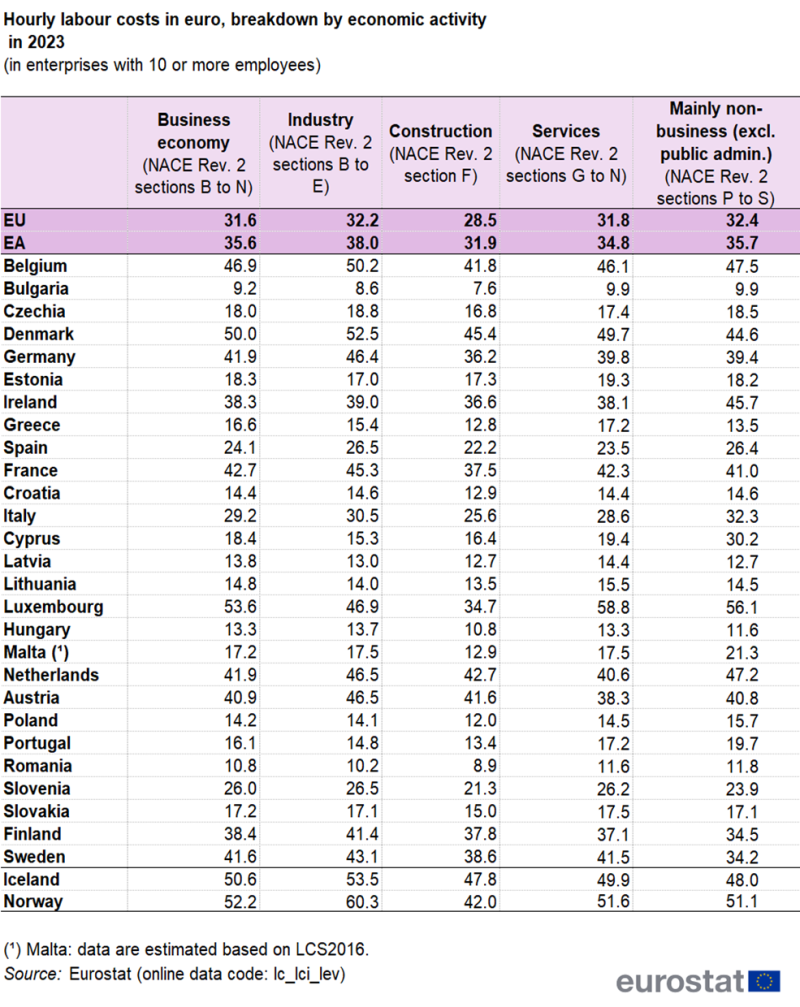
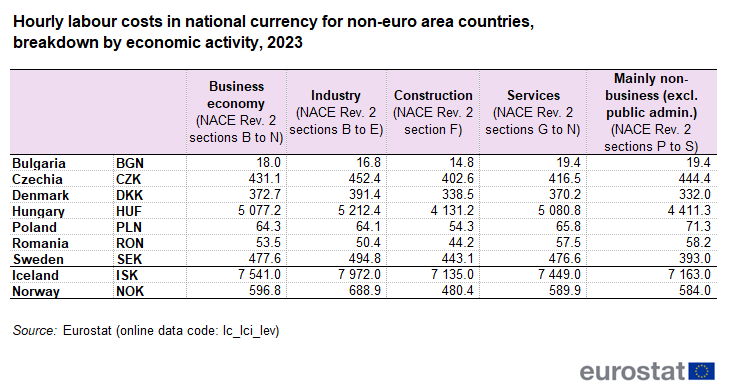
In the EU, labour costs per hour were the highest in the mainly non-business economy excluding public administration (€32.4) and the lowest in the construction sector (€28.5). Gaps were larger in the euro area, with industry being the highest paying sector (€38.0 per hour) and construction the lowest (€31.9 per hour) (see Table 3).
Source: Eurostat (lc_lci_lev)
Source: Eurostat (lc_lci_lev)
Hourly labour costs increased most in Hungary
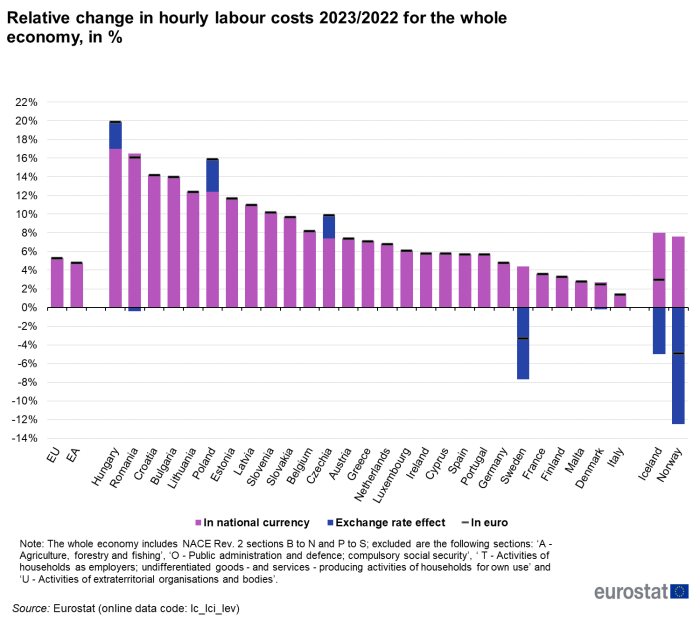
Between 2022 and 2023, hourly labour costs in the whole economy (in euro) rose by 5.3 % in the EU and by 4.8 % in the euro area (see Figure 3).
Within the euro area, hourly labour costs increased in all EU Member States. The largest increases were recorded in Croatia (+14.2 %), Lithuania (+12.4 %) and Estonia (+11.7 %).
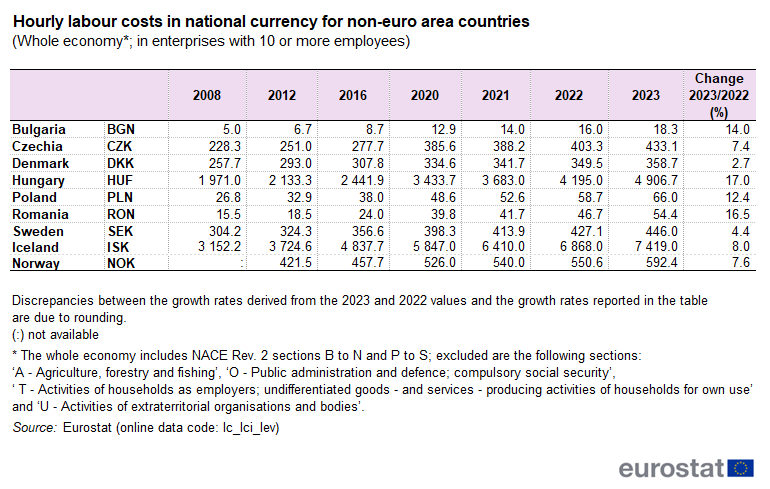
For EU Member States outside the euro area, the hourly labour costs expressed in national currency also increased in all countries, with the largest variations recorded in Hungary (+17.0 %), Romania (+16.5 %), Bulgaria (+14.0 %) and Poland (+12.4 %). They increased the least in Denmark (+2.7 %).
Source: Eurostat (lc_lci_lev)
Source data for tables and graphs
Data sources
Labour cost survey
The labour cost survey (LCS) provides structural information on labour costs. The survey is conducted every four years and the most recent LCS refers to the year 2020. The LCS covers observation units with 10 or more employees and all economic activities except NACE Rev. 2 sections : 'A - Agriculture, forestry and fishing', 'O - Public administration and defence; compulsory social security', 'T - Activities of households as employers; undifferentiated goods - and services - producing activities of households for own use' and 'U - Activities of extraterritorial organisations and bodies'.
The labour cost per hour from the LCS is calculated as:
Compensation of employees + Vocational training costs + Other expenditure + Taxes – Subsidies.
For the EU the weight of each variable in the labour cost per hour in 2020 was:
| Compensation of employees | 98.98 % |
| Vocational training costs | 0.57 % |
| Other expenditure | 0.46 % |
| Taxes | 0.73 % |
| Subsidies | 0.74 % |
Labour cost index
The labour cost index (LCI) is a short-term indicator showing the development of hourly labour costs incurred by employers. It is calculated by dividing the labour costs by the number of hours worked. Total labour costs consist of costs for wages and salaries, plus non-wage costs (such as employer's social contributions). These do not include vocational training costs or other expenditures (such as recruitment costs, spending on work clothes, etc.). The LCI covers all business units irrespective of the number of employees and all economic activities except agriculture, forestry and fishing, private households and extra-territorial organisations.
The index equals 100 in 2020 and is available 70 days after the reference quarter. The labour cost per hour from the LCI is calculated as:
Compensation of employees + Taxes – Subsidies
From the table above it can be concluded that for the EU, the LCI labour cost concept covers approximately 99.0 % of the LCS labour concept. This percentage varies from country to country. The lowest percentages are observed in Ireland and the Netherlands where the LCI concept represents 96.9 % of the LCS labour cost concept. See (lc_nstruc_r2).
In this publication, the whole economy includes NACE Rev. 2 sections B to N and P to S, and can be subdivided into the following economic activities: The mainly non-business economy (excluding public administration), which includes NACE Rev. 2 sections P to S (Education; Human health & social work activities; Arts, entertainment & recreation and Other service activities); for the EU this accounts for about 25 % of the labour costs of the whole economy.
The business economy, which includes NACE Rev. 2 sections B to N; for the EU this accounts for about 75 % of the total labour costs of the whole economy. It can be further broken down into:
Industry, which includes NACE Rev. 2 sections B to E (Mining and quarrying; Manufacturing; Electricity, gas, steam & air conditioning supply; and Water supply, sewerage, waste management & remediation activities). Industry accounts for around 23 % of the whole economy in the EU. Construction; NACE Rev. 2 section F, which accounts for 5 % of the whole economy in the EU. Services, which include NACE Rev. 2 sections G to N (Wholesale and retail trade, repair of motor vehicles & motorcycles; Transportation & storage; Accommodation & food service activities; Information & communication; Financial & insurance activities; Real estate activities; Professional, scientific & technical activities; Administrative & support service activities). They account for around 47 % of the whole economy in the EU.
Excluded are NACE Rev. 2 sections : 'A - Agriculture, forestry and fishing', 'O - Public administration and defence; compulsory social security', ' T - Activities of households as employers; undifferentiated goods - and services - producing activities of households for own use' and 'U - Activities of extraterritorial organisations and bodies'.
Country notes
Compared to the publication of 27. March 2024, the data for Malta have been revised. They are now benchmarked on Labour Cost Survey data 2016 (LCS2016) instead of LCS2020, pending further analysis.
Estimation method
Estimates for the years after 2020 are obtained by extrapolating the hourly labour costs, derived from the latest Labour Cost Survey (LCS2020) except for Malta where LCS2016 is used, with the Labour Cost Index (LCI). LCI data are not adjusted for calendar effects except in the case of Denmark, Sweden, Norway and Iceland where only calendar-adjusted data are available.
Caveats
Using the LCI to extrapolate the LCS values means assuming the following hypothesis:
- the labour cost per hour of all business units behaves in the same way as the labour cost per hour of business units with 10 or more employees;
- 'Vocational training costs' and 'Other expenditure' behave similarly to 'Compensation of employees', 'Taxes' and 'Subsidies'.
These assumptions, especially the first one, can lead to a small over or under-estimation of the annual labour cost per hour.
Conversion to euro
LCI data used to extrapolate labour cost levels are calculated in national currencies. To compile European aggregates, the results for non euro area countries are first converted into euros using the average exchange rates recorded for year 2023.
Geographical information
The euro area (EA20) included Belgium, Germany, Estonia, Ireland, Greece, Spain, France, Croatia, Italy, Cyprus, Latvia, Lithuania, Luxembourg, Malta, the Netherlands, Austria, Portugal, Slovenia, Slovakia and Finland. The aggregate data series commented on in this publication refers to EA20. The European Union (EU27) includes Belgium, Bulgaria, Czechia, Denmark, Germany, Estonia, Ireland, Greece, Spain, France, Croatia, Italy, Cyprus, Latvia, Lithuania, Luxembourg, Hungary, Malta, the Netherlands, Austria, Poland, Portugal, Romania, Slovenia, Slovakia, Finland and Sweden.
Context
The collection of labour costs is an essential part of the range of statistics that are relevant for an understanding of the inflationary or deflationary process and the cost dynamics in the economy.
Information on labour costs is required for economic and monetary policies, wage bargaining and economic analyses. Labour costs are an important potential source of inflation since they account for a large proportion of the total costs borne by private businesses, which may pass on higher labour costs, in particular if not reflected in higher productivity, to consumers via higher end prices, thus fuelling inflation. Equally, low or negative growth in hourly labour costs may signal deflation risks. A timely publication of labour cost levels is therefore of the utmost importance for the European Central Bank (ECB) in order for it to be able to monitor inflation in the euro area.
Direct access to
Previous publications
- Hourly labour costs news release 30 March 2023
- Hourly labour costs news release 28 March 2022
- Hourly labour costs news release 31 March 2020
- Hourly labour costs news release 11 April 2019
- Hourly labour costs news release 9 April 2018
- Hourly labour costs news release 6 April 2017
- Hourly labour costs news release 1 April 2016
- Hourly labour costs news release 30 March 2015
- Hourly labour costs news release 27 March 2014
- Labour costs (lc)
- Labour cost index (lci)
- Labour costs annual data (lcan)
- Labour cost levels (lc_lci_lev)
- Labour cost index (ESMS metadata file — lci_esms)
- Regulation (EC) No 450/2003 of 27 February 2003 concerning the labour cost index
- Summaries of EU Legislation: Comparable EU-wide labour cost statistics
- Regulation (EC) No 1216/2003 of 7 July 2003 implementing Regulation 450/2003 concerning the labour cost index
- Corrigendum to Regulation (EC) No 1216/2003 of 7 July 2003
- Regulation (EC) No 224/2007 of 1 March 2007 amending Regulation 1216/2003 as regards the economic activities covered by the labour cost index
- Employment Cost Index (U.S. Bureau of Labour) - An alternative measure of changes in labour costs
