Archive:Europe 2020 indicators - poverty and social exclusion
- Data from December 2014. Most recent data: Further Eurostat information, Main tables.
This article is part of a set of statistical articles based on the Eurostat publication Smarter, greener, more inclusive? - Indicators to support the Europe 2020 strategy. It provides recent statistics on poverty and social inclusion in the European Union (EU), key areas of the EU's Europe 2020 strategy.
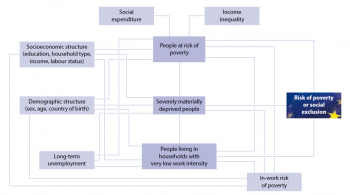
The analysis focuses on the indicator ‘people at risk of poverty or social exclusion’, itself consisting of three sub-indicators on monetary poverty, material deprivation and low work intensity, respectively. Additional contextual indicators present a broader picture and show the drivers behind changes, providing a breakdown by sex, age, educational attainment level, household type, country of birth and labour status and identifying the groups most at risk. Finally, factors reducing or increasing the risk of poverty and social exclusion are discussed: social protection expenditures and long-term unemployment (see the article on 'Employment').
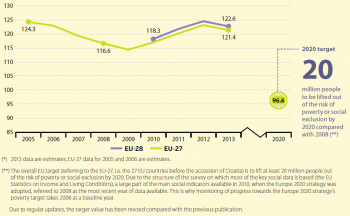
Europe 2020 strategy target on the risk of poverty and social exclusion The Europe 2020 has set the target of ‘lifting at least 20 million people out of the risk of poverty and social exclusion’ by 2020 [1]
(Million people)
Due to regular data updates, the target value has been revised compared to the previous publication.
Source: Eurostat online data code (t2020_50)
(% of population)
Source: Eurostat online data code (t2020_50)
(% of population)
Source: Eurostat online data code (ilc_peps01)
(% of population)
Source: Eurostat online data code (ilc_peps03)
(% of population)
Source: Eurostat online data code (ilc_peps03)
(percentage point change 2008-13) (**)
Source: Eurostat online data code (ilc_peps06)
(% of population aged 18 and over)
Source: Eurostat online data code (ilc_peps04)
(Million people)
Source: Eurostat online data code (ilc_pees01)
(million people)
Source: Eurostat online data code (t2020_51), (t2020_52) and (t2020_53)
(% of population)
Source: Eurostat online data code (t2020_52)

Source: Eurostat online data code (ilc_li02)
(%)
Source: Eurostat online data code (ilc_li02), (ilc_li03) and (ilc_li07)
(%)
Source: Eurostat online data code (ilc_li02), (ilc_li10) and (spr_exp_sum))
(%)
Source: Eurostat online data code (ilc_di01)
(% of population)
Source: Eurostat online data code (t2020_53)
(% of population)
Source: Eurostat online data code (ilc_mddd11)
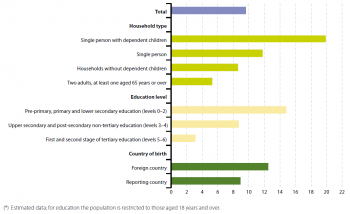
(%)
Source: Eurostat online data code (ilc_mddd13), (ilc_mddd14) and (ilc_mddd16)
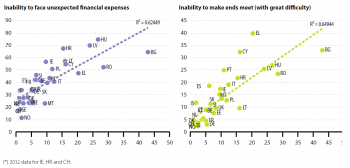
(% of total population)
Source: Eurostat online data code (ilc_mdes04), (ilc_mdes09) (ilc_mddd11)
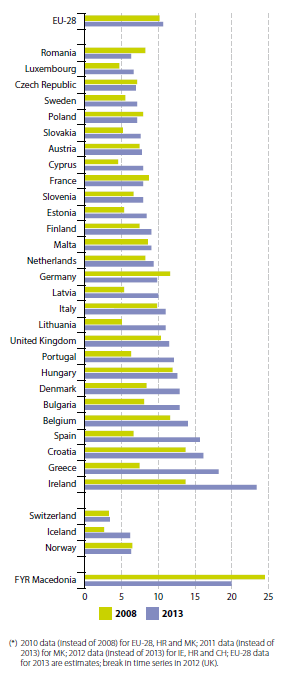
(% of population aged 0 to 59)
Source: Eurostat online data code (t2020_51)
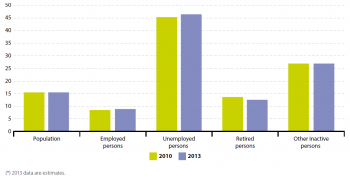
(% of population aged 18 and over)
Source: Eurostat online data code (ilc_li04)
(%)
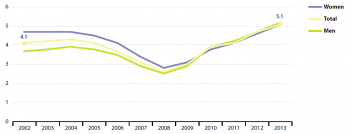
Source: Eurostat online data code (tsdsc330)
(%)
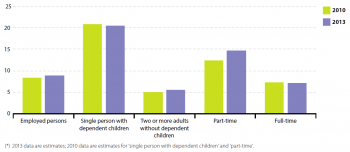
Source: Eurostat online data code (ilc_iw01), (ilc_iw02) and (ilc_iw07)
Main statistical findings
How do poverty and social exclusion affect Europe?
The headline indicator ‘people at risk of poverty or social exclusion’ shows the number of people affected by at least one of three forms of poverty: monetary poverty, material deprivation or low work intensity. People can suffer from more than one dimension of poverty at a time. To calculate the headline indicator people are counted only once even if they are present in more than one sub-indicator.
As shown in Figure 2 the number of people at risk of poverty or social exclusion in the EU-27 had been decreasing steadily before the economic crisis. The indicator reached its lowest level in 2009 with about 114 million people at risk in the EU-27. However, this figure grew again in the following years. It reached its peak in 2012, with about 123 million people at risk, before decreasing again slightly in 2013.
For the EU-28 the number of people at risk of poverty or social exclusion followed a similar trend, although at a slightly higher level due to the inclusion of Croatia. As shown in Figure 2, it accounted for about 118 million people in 2010 and rose to almost 125 million people in 2012 before falling again in 2013 to 122.6 million. The serious impact of the economic crisis on Member States’ financial and labour markets was the most likely cause for the rise from 2009 onwards (see the article on ‘Employment’).
Automatic stabilisers and other discretionary measures were used to help cushion the recession’s negative social effects. By 2013 almost 123 million people - about 24.5 % of the EU population - were at risk of poverty or social exclusion. This means almost one in four people in the EU experienced at least one of the three forms of poverty or social exclusion.
The current economic situation poses a major challenge to policy makers trying to fight poverty and ensure social inclusion. The emphasis needs to shift from short-term measures to structural reforms to spur economic growth, promote high levels of employment (tackling in-work poverty), guarantee adequate social protection and access to quality services (such as healthcare, childcare and housing). Social policies alone cannot deliver on the Europe 2020 poverty target. This objective must be underpinned by other public policies in the economic, employment, tax and education fields [2].
The number of people at risk of poverty or social exclusion has increased in most Member States
To meet the overall EU target on risk of poverty and social exclusion, Member States have set their own national targets in their National Reform Programmes. As noted in the European Council conclusions from 17 June 2010, Member States are free to set their own targets based on the most appropriate indicators for their circumstances and priorities. In most countries the target is expressed as an absolute number of people to be lifted out of the risk of poverty or social exclusion compared with 2008. As mentioned earlier this base year is also used for the overall EU target [3].
Most countries have experienced an increase in the number of people at risk of poverty or social exclusion since 2008, widening the distance from their national targets. Poverty levels have improved in only a few countries. Three countries – the Czech Republic, Poland and Romania – had already reached their national poverty targets by 2013. Germany and Latvia have also reached their national targets, however, these refer to different indicators than those used at the EU level [4]. The other Member States remain some distance from their targets, which range from 4.4 million people in Italy to about 25 000 people in Malta.
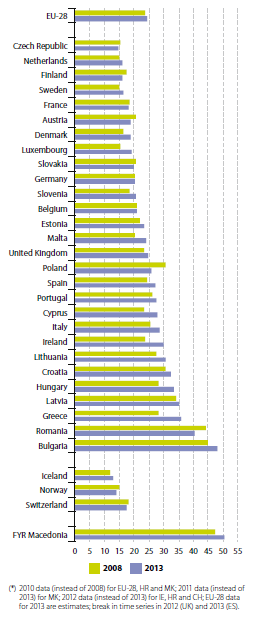
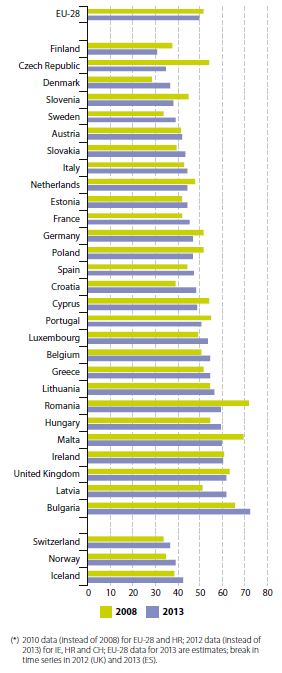
Overall, 24.5 % of the EU population were at risk of poverty or social exclusion in 2013. However, this conceals considerable variations among Member States in both the level and dynamics of this indicator (see Figure 3). In Bulgaria almost half of the population (48 %) were included in this category in 2013. In the Czech Republic (14.6 %), the Netherlands (15.9 %) and Finland (16.0 %) the rate was about three times lower.
In the EU as a whole, and in most Member States, the number of people at risk of poverty or social exclusion reached its lowest level in 2009 before rising again. Significant differences between Member States could be seen during 2008 to 2013. Some countries have made clear progress in integrating their most vulnerable members into society. Reductions in the number of people at risk of poverty or social exclusion ranged from 2 % to 15 % in Poland (- 15 %), Romania (- 9 %), Austria (- 9 %), Finland (- 8 %), Slovakia (- 4 %), Czech Republic (- 5 %) and France (- 2 %). A number of countries have experienced less inclusive growth. In Cyprus, Greece, Malta and Luxembourg the number of people at risk increased by more than 20 % or even more than 30 %.
One reason for the disparity in poverty rates across the EU is the uneven impact of the economic crisis on Member States. Differences in the structure of labour markets, welfare systems, the fiscal position and fiscal consolidation measures have also played a role [5] (see the article on ‘Employment’).
In this respect, a link between the average risk of poverty and social exclusion at EU level and the disparities across the EU can be observed: the higher the average percentage of people at risk in the EU as a whole, the higher the distance between the lowest and the highest percentage observed across the Member States. In 2008, the distance between the countries with the lowest and the highest risk of poverty or social exclusion was about 30 percentage points. In 2013, this gap had grown slight to 33 percentage points. This divergence of inequality and poverty levels between Member States has raised serious concern. In particular, a persistent widening of the gap in social exclusion levels could lead to a dangerous polarisation within the EU [6].
Which groups are at greater risk of poverty or social exclusion?
Compared with the EU average, some groups are at a higher risk of poverty and social exclusion. The most affected are women, children, young people, people living in single-parent households, lower educated people and migrants. EU policies aimed at reducing the number of people at risk therefore tend to focus on these groups. They call on Member States to define and implement measures to address their specific circumstances [7].
Women are more likely to live in poverty and social exclusion than men
In 2013, 25.4 % of women were at risk of poverty or social exclusion across the EU compared with 23.6 % of men. This put the EU-wide gender gap at 1.8 percentage points. Women were worse off in all countries except Spain and Portugal where the risk of poverty or social exclusion was the same for women and men in 2013. In 2013, the gaps were highest in Lithuania (4.7 percentage points), Germany (3.1 percentage points), the Czech Republic and Sweden (3 percentage points each) and Bulgaria (2.9 percentage points). Portugal, Finland and Denmark were the most egalitarian countries with gender gaps of less than or about 0.5 percentage points. The gender gap narrowed in most countries between 2008 and 2013, except in the Netherlands, Lithuania and Sweden.
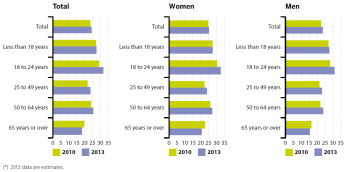
The disparities between women and men become more distinct when looking at age groups. Among men, the young aged 18 to 24 were most at risk (31 %) in 2013 compared with older people aged 65 or over (15.3 %). In contrast, women were more likely to be at risk of poverty or social exclusion in all age groups (see Figure 4). The risk was the most unequal among the older groups aged 65 or over. In this age group the gender gap was 5.3 percentage points in 2013.
Young people aged 18 to 24 are more at risk
For both men and women, young people aged 18 to 24 are the most likely to be at risk of poverty or social exclusion. More than 30 % were at risk in 2013 (31.0 % for men and 32.6 % for women). People younger than 18 years were the next most at risk, at 27.6 %. Moreover, the situation for young people aged 18 to 24 has not improved compared with 2010. Although their risk of poverty or social exclusion had been falling until 2009, it climbed back in the following years.
In contrast, older people aged 65 or over showed the lowest rates of 18.3 % (15.3 % for men and 20.6 % for women) in 2013. The rates of this group have shown a steady decline over the period 2010 to 2013 (see Figure 4). As a result the age gap has widened. This indicates the burden of the financial crisis has fallen more heavily on those already belonging to the most vulnerable groups of society.
The widening of the gap between young people aged 18 to 24 and older people aged 65 or over can also be seen in most Member States. In almost all countries except for Germany, the gap increased, in some cases massively, between 2008 and 2013. In Denmark, the age gap grew by about 18 percentage points. This was due to the number of young people at risk of poverty or social exclusion rising by 11 percentage points and the number of elderly at risk falling by about 7 percentage points (see the article on ‘Employment’).
Single parents face the highest risk of poverty or social exclusion
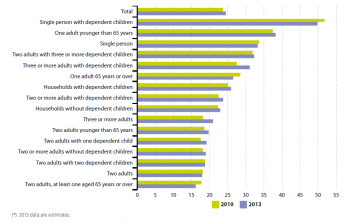
Almost 50 % of single people with one or more dependent children were at risk of poverty or social exclusion in 2013. This was double the average and higher than in any other household type or group analysed. Figure 5 shows that the situation for single parents at EU level has improved only marginally since 2010 when almost 52 % of single-parent households were at risk of poverty or social exclusion. Even though this is a serious problem for this household type, single parents’ households only account for 4.6 % of all households. The group with the lowest poverty rate in 2013, and showing the most improvement since 2005, was households with two adults where at least one person was aged 65 years or over.
At the national level, changes in the risk of poverty or social exclusion rate varied widely among single parent households during 2008 to 2013. Changes between 2008 and 2013 ranged from an increase of 10.8 percentage points in Latvia to a fall of 19.1 percentage points in the Czech Republic. Other countries that also experienced big increases were Denmark (8.2 percentage points) and Bulgaria (6.7 percentage points). The biggest falls, besides Czech Republic, were in Romania (– 12.7 percentage points) and Malta (– 9.5 percentage points), as well as Finland and Slovenia (both – 6.6 percentage points).
In contrast, for households with two adults with at least one aged 65 or over, the at-risk rate decreased in most countries. Hence the absence of children seems to lower the risk of poverty or social exclusion.
Migrants are worse off than people living in their home countries
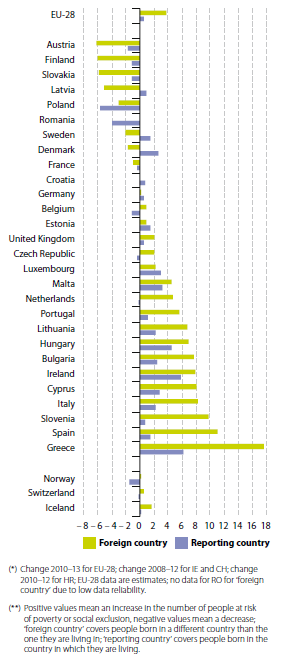
People living in the EU but in a different country from where they were born had a 34.4 % risk of poverty or social exclusion in 2013. This is almost 12 percentage points higher than for people living in their home countries. This ‘origin gap’ could be seen in most European countries in 2013, except Hungary, Poland and Slovakia. It was highest in Greece, where the risk of poverty or social exclusion among migrants was 30.3 percentage points higher than among those born in the country. In 18 Member States, the risk of poverty or social exclusion among foreigners increased between 2008 and 2013 (see Figure 7). Greece showed the highest increase of 17.6 percentage points. In contrast, in Austria the risk decreased by 6.1 percentage points. The overall trend might be explained by the fact that migrants have suffered the most from rising unemployment in the EU [8].
People with low educational attainment are three times more likely to be at risk
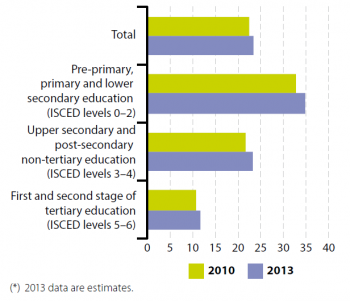
In 2013, 34.8 % of people with at most lower secondary educational attainment were at risk of poverty or social exclusion (see Figure 8). In comparison, only 11.8 % with tertiary education were in the same situation. This indicates that the least educated people were about three times more likely to be at risk than those with the highest education levels (also see the article on ‘Education).
This situation is even more distinct in Member States such as the Czech Republic, Malta, Slovenia, Romania, Croatia and Poland. In these countries people with the lowest educational attainment were about five (5.5 times in Malta) to almost eight times (7.9 times in the Czech Republic) more likely to be at risk of poverty or social exclusion. In Bulgaria, Denmark, Germany and the Czech Republic the disparities between these groups has grown within the last six years. In these countries the number of people at risk of poverty or social exclusion among the least educated increased, while it decreased for those with the highest levels of education. However, a better education did not necessarily protect everyone against the crisis. In 21 Member States the rate increased in 2013 as compared to 2008 also among those with the highest educational attainment. For example in Greece it increased by 7.8 percentage points and in Cyprus by 6.4 percentage points.
The three dimensions of poverty
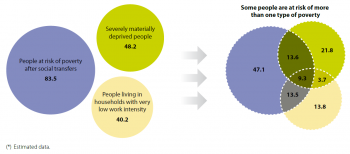
The 122.6 million people who were at risk of poverty or social exclusion in the 28 EU Member States in 2013 were affected by one or more dimensions of poverty (see 'Data sources and availability').
As shown in Figure 9, monetary poverty was the most widespread form in 2013, with 83.5 million people living at risk of poverty after social transfers. This was followed by material deprivation, affecting 48.2 million people, and low work intensity, affecting 40.2 million people.
More than one-third affected by more than one dimension of poverty
About 40 million people, or almost one third (32.6 %) of all people at risk of poverty or social exclusion, were affected by more than one dimension of poverty in 2013. Of these, 13.6 million people suffered from monetary poverty and material deprivation, 3.7 million were both materially deprived and living in households with very low work intensity, and 13.5 million were affected by low work intensity and monetary poverty. Another 9.3 million people were affected by all three forms (see Figure 9).
Divergent developments of the three forms of poverty
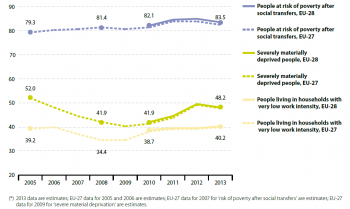
As shown in Figure 10, the three forms of poverty developed quite distinctly between 2005 and 2013. Monetary poverty has been the most prevalent form and has shown a slightly increasing trend since 2005. In contrast, the number of people affected by severe material deprivation or very low work intensity fell considerably over the period 2005 to 2008/09, but has since grown again. This shows that improvements in the headline indicator between 2005 and 2009 (see Figure 2) can mainly be traced back to the reduction in material deprivation and low work intensity. One possible reason for the divergence of monetary poverty on the one hand and material deprivation and low work intensity on the other is the different structure of the indicators (see 'Data sources and availability'). While monetary poverty is measured in relative terms, material deprivation and low work intensity are absolute measures (see 'Data sources and availability'). The relativity of monetary poverty means the at-risk rate may remain stable or even increase even if a country’s average or median disposable income increases. Absolute poverty measures, however, are likely to decrease during economic revivals.
Monetary poverty increased in over half of Member States
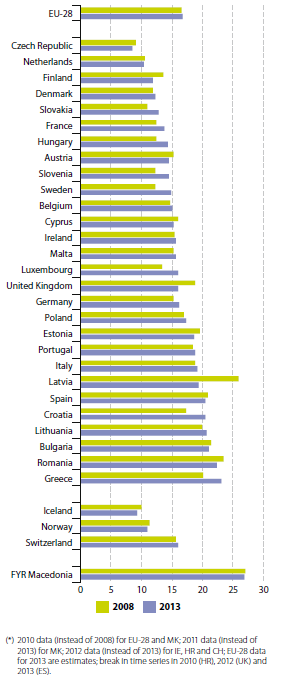
In 2013, 16.7 % of the EU population earned less than 60 % of their respective national median equivalised disposable income, the so-called ‘poverty threshold’. This represents a slight increase compared with 2008, when the risk-of-poverty rate was 16.5 %.
The increase did not take place in all countries (see Figure 11). Between 2008 and 2013 the share of people at risk of monetary poverty rose in 17 Member States and fell in the rest. The countries reporting the highest rates in 2013 were Greece (23.1 %), Romania (22.4 %) and Bulgaria (21 .0 %). The best performing Member States for monetary poverty were the Czech Republic (8.6 %), the Netherlands (10.4 %) and Finland (11.8 %).
Impact of the poverty threshold
Monetary poverty is related to disposable income after monetary social transfers. It is reached when disposable income falls below a certain threshold. Hence, the number of people considered monetarily poor depends on the level at which the poverty threshold is set (see Table 1).
If the poverty threshold was set at 70 % of the national median disposable income, nearly one out of four people would be at risk of poverty. This holds for 2010 and 2013. If the threshold was set at 50 % or 40 %, then about 10 % or 5 % of the population would be at risk respectively. For all poverty thresholds, the number of people at risk of monetary poverty increased from 2010 to 2013.
Single parents, large families, low educated and young people most affected
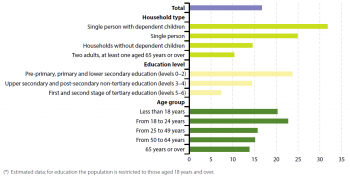
Single parenthood bears the biggest risk of monetary poverty. Almost one out of three or 32 % of households in this group were affected in 2013. The number of children also influences the risk, with one out of four large family households being touched. Single-wage and part-time employment may also cause monetary poverty [9]. A lack of affordable childcare might prevent parents from fully participating in the labour market [10] (see the article on ’Employment). Households with children are more at risk of poverty because young people generally face a greater risk of living in this condition (see Figure 12).
Children and young people (up to 24 years old) remained vulnerable groups in 2013. One out of five was at risk of poverty. Compared with 2008 [11] , the number of poor people aged 65 years or over has fallen by 5.2 percentage points but the number of poor young people has risen. Among those aged less than 18 years, the number of poor people remained stable at about 20 %. However, among those aged 18 to 24, the number of poor people increased by 2.7 percentage points.
The most vulnerable age groups vary between Member States. Commission analyses point to the persistent gender pay gap and the higher presence of women in precarious employment as possible reasons. In 2013, children were the most at risk in Romania (32.1 %) and Greece (28.8 %), while young people aged 18 to 24 were most at risk in Denmark (40.5 %) and the elderly were most at risk in Estonia (24.4 %). The risk of suffering from monetary poverty is slightly higher for women in most Member States [12].
As with poverty and social exclusion, a low level of education is a major risk factor for monetary poverty. While only 7.7 % of the population aged 18 to 64 with higher education were affected by monetary poverty in 2013, almost 28 % of people in the same age group with lower education were affected. This could also be related to the higher level of unemployment and in-work poverty among low-skilled workers (see the article on ’Employment).
Social expenditure helped prevent more monetary poverty
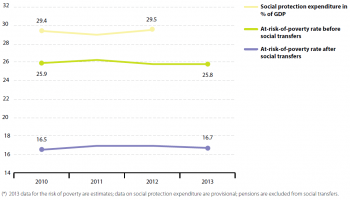
To support people at risk of poverty, governments provide social security in the form of social transfers. The effectiveness of monetary social provision can be evaluated by comparing the at-risk-of-poverty rate before and after social transfers and considering social policy expenditures (see Figure 13). The amount of money spent on social assistance is a good indicator of income support expenditure [13].
The at-risk-of-poverty rate before social transfers had been relatively stable since 2010 at around 26 %. The same holds for the at-risk-of-poverty rate after social transfers, but at the much lower level of slightly above 16.5 %. The expenditure for social protection [14] was at 29.4 % of GDP in 2010 and decreased slightly in 2011, only to rise again to 29.5 % in 2012.
Inequality of income distribution remained stable
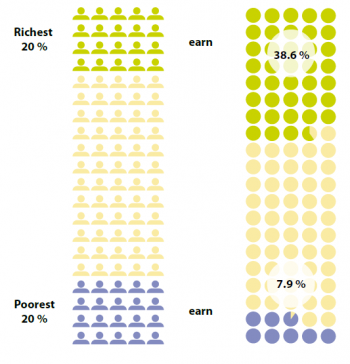
As with the number of people suffering from monetary poverty after social transfers, income inequality has also remained stable. To measure income inequality, the income quintile share ratio and the Gini coefficient [15] can be considered. Between 2008 and 2013, income inequality remained stable in the EU, with the richest 20 % of the population earning about five times more than the poorest 20 % (see Figure 14).
There are considerable differences among Member States in the income quintile share ratio. In 2013 Bulgaria, Greece and Romania recorded the highest inequality in income distribution. In all of these three Member States the total income of the richest 20 % was almost seven times higher than the income of the poorest 20 %. On the other hand the Czech Republic and the EFTA countries Norway and Iceland had income quintile share ratios below 3.5.
The Gini coefficient for the EU was 30.5 in 2013, a level similar to previous years (a coefficient of 100 expresses complete inequality and a coefficient of 0 expresses perfect equality). Income inequality according to the Gini coefficient was again lowest in Norway, Iceland, Slovakia, Slovenia, Czech Rpublic and Sweden, with coefficients of less than 25. On the other hand, in Bulgaria, Latvia, Lithuania and Greece the index exceeded the EU average by four percentage points, indicating relatively high income inequality in these countries.
Material deprivation is the second most common form of poverty
Material deprivation covers issues relating to economic strain, durables and housing and environment of the dwellings. Severely materially deprived people have living conditions greatly constrained by a lack of resources.
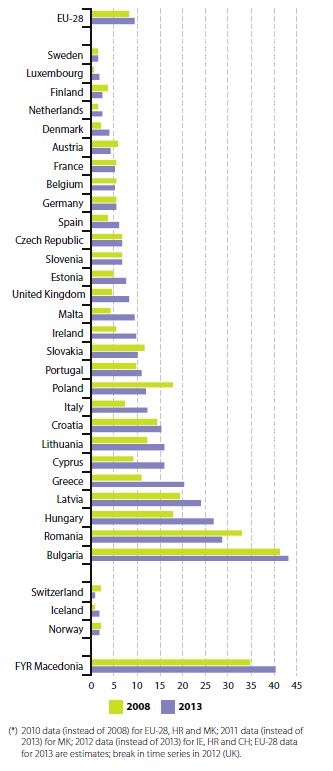
In 2013, 48.2 million people in the EU were living in conditions severely constrained by a lack of resources. This equalled 9.6 % of the total EU population or every tenth person, making severe material deprivation the second most common form of poverty. The levels of severe material deprivation differed widely across the EU in 2013, from 43 % in Bulgaria to as low as 1.8 % in Luxembourg and 1.4 % Sweden (see Figure 15).
A combination of factors are likely to cause these persistent disparities between Member States. Differences in living standards, levels of development and social policies all play a part [16].
In a few Member States the share of people in poor living conditions is much higher than the share of people at risk of monetary poverty. For example, in Bulgaria the proportion of people living in severely deprived conditions was almost twice as high as the share living in monetary poverty. On the other hand, in a number of countries with higher standards of living such as Sweden, Luxembourg and Denmark, monetary poverty rates appear high.
Since 2008 the number of people living in severe material deprivation increased in the majority of countries. The rate has decreased in nine countries and remained stable in two. In general, these were countries with initially low rates below or around 5.5 % such as Austria, Finland, Belgium, France, Germany and Sweden. However, in Romania the rate decreased by 4.4 percentage points from 32.9 % in 2008. The most distinct improvements took place in Poland, which improved by 5.8 percentage points from 17.7 % in 2008.
Women and young people more affected
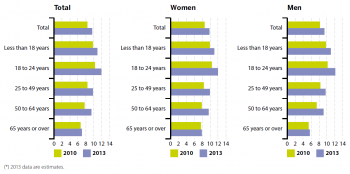
As is the case for the other indicators analysed in this article, women and people aged 18 to 24 were the most affected by material deprivation in 2013. Figure 16, illustrating the rates of materially deprived people among different age groups and by gender, shows age disparities were greater for men. Moreover men aged 65 years or over were better off than any other group in 2013.
Single parents, poorly educated and migrants were worse off
People living in single households with children, those who are poorly educated and foreigners are the most vulnerable to material deprivation (see Figure 17).
Inability to face unexpected financial expenses or to make ends meet
Material deprivation can threaten a person’s existence or make them fear their existence is threatened. They may feel unable to face unexpected financial expenses or to ‘make ends meet’ (the ability to pay for their usual expenses). In 2013, almost 40 % of the EU population reported that their household was not able to face unexpected expenses. About 12 % declared they had great difficulties making ends meet. As shown in Figure 18, material deprivation is often associated with these concerns. In countries with fewer severely materially deprived people, more could afford unexpected or usual expenses. Countries with more materially deprived people were more likely to exhibit higher numbers of people unable to face unexpected expenses or make ends meet.
Low work intensity lowers income security
In 2013, 10.7 % (or 40.2 million) of the EU population aged 0 to 59 were living in households with very low work intensity. This means the working-age members of the household worked less than 20 % of their potential during the previous year. Across Europe, this figure ranged from 6.4 % in Romania and 6.6 % in Luxembourg to more than 23.4 % in Ireland (2012 data) (see Figure 19). Low work intensity increased between 2005 and 2006 before declining between 2006 and 2008. It then remained stable for one year but started to increase again gradually in parallel with the rising unemployment levels as a result of the crisis. Between 2008 and 2013 Greece, Ireland and Spain reported the highest increases (by 10.7, 9.7 and 9.1 percentage points respectively) in the amount of households with very low work intensity. Improvements were observed in Romania (by 1.9 percentage points), Germany (by 1.8 percentage points), France (by 0.9 percentage points), Poland (by 0.8 percentage points) and the Czech Republic (by 0.3 percentage points).
Some countries reported that the share of people living in households with very low work intensity increased by a similar amount to the decrease in the employment rate. In some cases such as Greece and Spain the increase was even stronger. This trend indicates that a deterioration in employment rates has the biggest effect on the most vulnerable households [17] (see article on ’Employment).
In many countries the rate of lack of access to labour does not seem to correspond to the extent of the other forms of poverty or social exclusion: material deprivation and monetary poverty. Ireland, for example, in 2012 had a high proportion of households with very low work intensity (23.4 %) despite its risk of monetary poverty (15.7 %) being below the EU average. In contrast, Romania had one of the highest proportions of its population living at risk of monetary poverty in 2013 (22.4 %) and at the same time one of the lowest shares of households with very low work intensity (6.4 %).
Work intensity lowest for single parents and single households
In many cases, low work intensity means low income. In 2013, one out of every three people (33 %) in the lowest income quintile in the EU was living in a household with very low work intensity. This figure increases to more than one in two for single people (56.5 %) and almost one in two for single-parent households (47.2 %) in this lowest income quintile.
With 28.4 %, single parents were more than twice as likely to live in a household with very low work intensity than the average (10.7 %) in 2013. However, unlike the other forms of poverty, large households with three or more dependent children were less likely (8.1 %) to experience very low work intensity than single-person households. Single people were more than twice as likely (23.3 %) to live in a household facing problems accessing labour than the average. The most vulnerable groups for labour exclusion were therefore single parents and single people.
Education is one of the keys to lifting people out of poverty. People with a low level of education find it hardest to gain work. In 2013, 21.5 % of this group were living in a household with very low work intensity. This represents an increase of 5.6 percentage points since 2008. Migrants, especially women, also face greater difficulty finding work. In 2013, 17.9 % of women originating from a country outside the EU lived in households with low work intensity. With regard to gender and age groups, women aged 25 to 59 are the most vulnerable to low work intensity.
Lack of work drives monetary poverty and material deprivation
As depicted in the article on ’Employment', unemployment and economic inactivity are major drivers of monetary poverty and material deprivation. Figure 20 illustrates the variations of the risk of monetary poverty by economic activity and the shifts between 2010 and 2013.
Being unemployed poses the highest risk of monetary poverty. In 2013, almost every second unemployed person was at risk of poverty after social transfers. Also, 26.8 % of other economically inactive people were at risk of poverty in 2013. With the exception of retired people, these risks have risen since 2010. For example, the at-risk-of-poverty rate of unemployed people increased from 45.3 % in 2010 to 46.5 % in 2013.
Long-term unemployment describes people aged 15 or over who have been unemployed for longer than a year. These people usually find it harder to obtain a job than those unemployed for shorter periods, so they face a higher risk of social exclusion. Figure 21 shows how the generally favourable trend of falling long-term unemployment in the early 2000s has been reversed since the onset of the economic crisis. In 2013, 5.1 % of the economically active population had been unemployed for longer than a year; with more than half of these (about 57 %) having been unemployed for more than two years. In addition, differences between men and women have disappeared over the past five years.
People in work can also be affected by poverty
Poverty and social exclusion do not only affect those who are economically inactive or unemployed. Some groups among those in work also face higher risks of being poor. The developments of income-related aspects of poverty and lack of access to labour are also interrelated with in-work poverty (see Figure 22). Factors affecting in-work poverty rates include household type, type of contract, working time and hourly wages, among others.
Multi-person adult households without dependent children are much less at risk of in-work poverty than households with dependent children and single-person households. Those most at risk are single parents. One out of five was affected in 2013. Part-time employment can also lead to this form of poverty.
In general men were more affected by in-work poverty than women (9.4 % compared with 8.5 % in 2013). The situation was the opposite for young workers aged 18 to 24 years. In this case women were more affected (12.5 % compared with 10.7 %). Of all age groups, young workers showed the highest in-work at-risk-of-poverty rates.
Conclusions and outlook towards 2020
The European Commission has a goal to reduce the number of people at risk of poverty or social exclusion by 20 million by 2020 compared with 2008. Nevertheless, almost every fourth person in the EU was still at risk of poverty or social exclusion in 2013.
Monetary poverty is the most widespread form of poverty. The number of people at risk of poverty after social transfers in 2013 was 83.5 million or 16.7 % of the total EU-28 population. Next was material deprivation, covering 48.2 million people or 9.6 % of all EU citizens. The third dimension is low work intensity, with 40.2 million people experiencing it in 2013. This equals 10.7 % of the total population aged 0 to 59.
The year 2009 marks a turning point in the development of all three dimensions of poverty. While monetary poverty had been stable until 2009 and started to increase afterwards, the other two dimensions decreased considerably until 2009 and started to increase from then on.
Furthermore, the analysis shows that across all three dimensions of poverty, the same groups appear the most vulnerable: children, young people, single parents, households with three or more dependent children, people with low educational attainment and migrants.
More than 30 % of young people aged 18 to 24 and 27.6 % of children aged less than 18 were at risk of poverty or social exclusion in 2013. Moreover, one out of five children and young people aged 18 to 24 were subject to monetary poverty.
Poverty also seemed to be much more pronounced for the less educated and migrants. Almost 35 % of adults with at most lower secondary educational attainment and 34.4 % of adults with a migrant background were at high risk of poverty or social exclusion. Of all groups examined, single parents with one or more dependent children faced the greatest risk of poverty. They were the most affected by low work intensity (28.4 %), monetary poverty (31.8 %), in-work poverty (20.5 %) and material deprivation (19.9 %). Overall, about 49.7 % of all single parents were at risk of poverty or social exclusion in 2013. This was double the average and higher than in any other household type or group analysed.
The development of the risk of poverty or social exclusion indicators also shows a growing gap between high-risk and low-risk groups since 2009. This suggests that the burden of the financial crisis has fallen more heavily on those who already belonged to the weakest groups.
Efforts needed to meet the Europe 2020 target on poverty and social exclusion
As the most widespread form of poverty, monetary poverty is one of the major challenges to achieving the Europe 2020 target. The proportion of people at risk of monetary poverty is closely linked to income inequality. This is not reduced by simply raising the average income. Therefore, action needs to be taken in the areas of social protection and improving the efficiency and effectiveness of income support [18].
To make progress towards the Europe 2020 poverty goal it will be particularly important to focus on groups of society that are at high risk of poverty and social exclusion. Actions to be taken for this purpose have been outlined in the EU flagship initiatives ‘Youth on the move’, ‘Agenda for new skills and jobs’ and ‘European Platform against poverty’. These include EU funded study programmes, learning projects and trainings aimed at facilitating the employment of young people [19]; also reforms to improve the flexibility and security in the labour market (‘flexicurity’), to improve the quality of jobs and to ensure better conditions for workers and for job creation [20]. Measures directly addressing poverty and social exclusion include the monitoring of Member States’ economic and structural reforms through the European Semester and a number of actions designed to help meet the poverty target at the European level [21].
In its stocktaking of the Europe 2020 strategy, the European Commission acknowledges that there is no sign of rapid improving in the situation and anticipates that the number of people at risk of poverty might remain at about 100 million by 2020. The European Commission expresses a concern that ‘[t]he situation is particularly aggravated in certain Member States and has been driven by increases in severe material deprivation and in the share of jobless households’, reckoning that ‘[t]he crisis has demonstrated the need for effective social protection systems.’ [22].
Data sources and availability
Measuring poverty in absolute and relative terms
Absolute poverty refers to the deprivation of basic human necessities for survival, such as food, clean water, clothing, shelter, health care and education. This poverty line is considered the same for different countries, cultures and technological levels and it is often based on a given basket of goods and services. For example, absolute poverty can be measured as the number of people eating less food than needed to sustain the human body [23].
Relative poverty occurs when someone’s standard of living and income are much worse than the general standard in the country or region where they live. They may struggle to live a normal life and to participate in ordinary economic, social and cultural activities. Relative poverty depends on the standard of living enjoyed by most of the country. For example, it can be measured by the number of people living below a country-specific poverty threshold. Relative poverty measures are often closely linked to inequality [24].
What is social exclusion?
Social exclusion can be defined as ‘a process whereby certain individuals are pushed to the edge of society and prevented from participating fully by virtue of their poverty, or lack of basic competencies and life-long learning opportunities, or as a result of discrimination. This distances them from job, income and education and training opportunities, as well as social and community networks and activities. They have little access to power and decision-making bodies and thus often feel powerless and unable to take control over the decisions affecting their day-to-day lives’ [25].
Education and employment policies targeting young people
The Europe 2020 strategy puts forward a flagship initiative focusing on young people. ‘Youth on the move’ aims to enhance the performance of education systems and help young people find work. This is to be done by raising the quality of all levels of EU education and training, promoting student and trainee mobility and improving the employment situation of young people [26].
The flagship initiative ‘A European platform against poverty’ focusing on migrants’ integration
The flagship initiative ‘A European platform against poverty’ incorporates policies to help integrate the most vulnerable groups of the population. It aims to provide innovative education, training and employment opportunities for deprived communities, fight discrimination and develop a new agenda to help migrants integrate and take full advantage of their potential. To underpin this, the initiative asks Member States to define and implement measures, addressing the specific circumstances of groups at particular risk, such as minorities and migrants [27].
The headline indicator ‘People at risk of poverty or social exclusion’ combines three dimensions of poverty
Measuring poverty and social exclusion requires a multidimensional approach. Household income is a key determinant of standard of living, but other aspects preventing full participation in society such as access to labour markets and material deprivation also need to be considered. Therefore, the European Commission adopted a broad ‘at-risk-of-poverty or social exclusion rate’ indicator to serve the purposes of the Europe 2020 strategy. This indicator is an aggregate of three sub-indicators: (1) monetary poverty, (2) material deprivation and (3) low work intensity.
1. Monetary poverty is measured by the indicator ‘people at risk of poverty after social transfers’. The indicator measures the share of people with an equivalised disposable income below the risk-of-poverty threshold. This is set at 60 % of the national median equivalised disposable income after monetary social transfers. Social transfers are benefits provided by national or local governments, including benefits relating to education, housing, pensions or unemployment.
2. Material deprivation covers issues relating to economic strain, durables and housing and dwelling environment. Severely materially deprived people are living in conditions greatly constrained by a lack of resources and cannot afford at least four of the following: to pay their rent or utility bills or hire purchase instalments or other loan payments; to keep their home warm; to pay unexpected expenses; to eat meat, fish or other protein-rich nutrition every second day; a week-long holiday away from home; to own a car, a washing machine, a colour TV or a telephone.
3. Very low work intensity describes the number of people aged 0 to 59 living in households where the adults worked less than 20 % of their work potential during the past year.
Because there are intersections between these three dimensions, they cannot simply be added together to give the total number of people at risk of poverty or social exclusion. Some people are affected by two, or even all three, types of poverty. Taking the sum of each would lead to cases being double-counted. This will become clearer when looking at the current numbers of people at risk of poverty or social exclusion (see Figure 9).
Context
Poverty and social exclusion - why do they matter?
Poverty and social exclusion harm individual lives and limit the opportunities for people to achieve their full potential by affecting their health and well-being and lowering educational outcomes. This, in turn, reduces opportunities to lead a successful life and further increases the risk of poverty. Without effective educational, health, social, tax benefit and employment systems, the risk of poverty is passed from one generation to the next. This causes poverty to persist and hence more inequality, which can lead to long-term loss of economic productivity from whole groups of society [28] and hamper inclusive and sustainable economic growth.
To prevent this downward spiral, the European Commission has made ‘inclusive growth’ one of the three priorities of the Europe 2020 strategy. It has set a target to lift at least 20 million people out of the risk of poverty and social exclusion by 2020. To underpin this objective, the European Commission has launched two flagship initiatives under the ‘inclusive growth’ priority: the ‘Agenda for new skills and jobs’ [29] and the ‘European platform against poverty and social exclusion’ [30].
The strategy’s poverty target is monitored with the headline indicator ‘People at risk of poverty or social exclusion’. This indicator is based on a multidimensional concept, incorporating three sub-indicators on monetary poverty (‘People at risk of poverty after social transfers’), material deprivation (‘Severely materially deprived people’) and low work intensity (‘People living in households with very low work intensity’).
Due to the structure of the survey on which most of the key social data is based (EU Statistics on Income and Living Conditions (EU-SILC)), a large part of the main social indicators available in 2010 (when the Europe 2020 strategy was adopted) referred to 2008 as the most recent year of data available [31]. This is the reason for using 2008 as a baseline year for monitoring progress. For the headline indicator (‘People at risk of poverty or social exclusion’), the target value for 2020 continues to be based on EU-27 data from 2008 because EU-28 aggregated data are only available from 2010. This is also why the analysis of the headline indicator and the three sub-indicators refers to both EU-27 data (from 2005) and EU-28 data (from 2010).
Additional contextual indicators are used to present a broader picture and show the drivers behind the changes in the headline indicator. They break down the top-level indicator by sex, age, educational attainment level, household type, country of birth and labour status. They also help identify the groups most at risk and reveal how their vulnerability has changed over time. Some indicators refer to factors that put people at risk of poverty and social exclusion or help them emerge from this status. These include social protection expenditures and long-term unemployment, which are linked to employment indicators (see the article on ‘Employment’)
Employment and education help people escape poverty. Thus, the EU’s poverty target is interrelated with the other Europe 2020 targets. Achieving the target to reduce the number of people at risk of poverty and social exclusion will therefore depend on successfully implementing the priorities and actions addressing the other targets.
See also
Further Eurostat information
Publications
Main tables
Dedicated section
Methodology / Metadata
- Towards robust quality management for European Statistics - Communication from the Commission COM(2011) 211 final
Other information
- Regulation 223/2009 of 11 March 2009 on European statistics
External links
Notes
- ↑ European Commission, Taking stock of the Europe 2020 strategy for smart, sustainable and inclusive growth, COM(2014) 130 final, Brussels, 2014.
- ↑ European Commission, Social Europe — Current challenges and the way forward. Annual Report of the Social Protection Committee (2012), Publications Office of the European Union, Luxembourg, 2013, (p. 8).
- ↑ European Commission, Social Europe — Current challenges and the way forward. Annual Report of the Social Protection Committee (2012), Publications Office of the European Union, Luxembourg, 2013, (p. 12).
- ↑ The poverty target in Germany refers to long-term unemployment, and the one in Latvia refers to two of the three sub-indicators (‘People at risk of poverty after social transfers’ and ‘Severely materially deprived people’) only.
- ↑ European Commission, Social Europe — Current challenges and the way forward. Annual Report of the Social Protection Committee (2012), Publications Office of the European Union, Luxembourg, 2013, (p. 18).
- ↑ European Commission, Social Europe — Current challenges and the way forward. Annual Report of the Social Protection Committee (2012), Publications Office of the European Union, Luxembourg, 2013, (p. 8).
- ↑ European Commission, A Strategy for smart, sustainable and inclusive growth, COM(2010) 2020 final, Brussels, 2010.
- ↑ European Commission, Social Europe — Current challenges and the way forward. Annual Report of the Social Protection Committee (2012), Publications Office of the European Union, Luxembourg, 2013, (p. 17).
- ↑ European Commission, The social dimension of the Europe 2020 strategy. A report of the social protection committee, Luxembourg, 2011, (p. 21).
- ↑ European Commission, The European Platform against Poverty and Social Exclusion: A European framework for social and territorial cohesion, COM (2010) 758 final, Brussels, 2010, (p. 5).
- ↑ 2008 data refers to EU-27 (instead of EU-28) due to data availability.
- ↑ European Commission, The social dimension of the Europe 2020 strategy. A report of the social protection committee, Luxembourg, 2011, (p. 21).
- ↑ European Commission, Europe 2020 Targets: Poverty and social exclusion. Active inclusion strategies, (p. 4) (accessed 23 July 2013).
- ↑ Social protection expenditure includes in-kind transfers that are not reflected in the at-risk-of-poverty rates.
- ↑ The GINI coefficient measures the extent to which the distribution of income within a country deviates from a perfectly equal distribution. A coefficient of 0 expresses perfect equality where everyone has the same income, while a coefficient of 100 expresses full inequality where only one person has all the income.
- ↑ European Commission, Social Europe — Current challenges and the way forward. Annual Report of the Social Protection Committee (2012), Publications Office of the European Union, Luxembourg, 2013, (p. 27).
- ↑ European Commission, Social Europe — Current challenges and the way forward. Annual Report of the Social Protection Committee (2012), Publications Office of the European Union, Luxembourg, 2013, (p. 28).
- ↑ European Commission,Improving the efficiency of social protection, Lisbon, 2011, (p. 8).
- ↑ For more information see: http://ec.europa.eu/youthonthemove/index_en.htm#theme_pos_3.
- ↑ For more information see: http://ec.europa.eu/social/main.jsp?langId=en&catId=958.
- ↑ For more information see: http://ec.europa.eu/social/main.jsp?catId=961&langId=en.
- ↑ European Commission, Taking stock of the Europe 2020 strategy for smart, sustainable and inclusive growth, COM (2014) 130 final, Brussels, 2014 (p.14).
- ↑ European Anti-Poverty Network, Poverty and inequality in the EU, EAPN Explainer, 2009, (p. 5ff).
- ↑ European Anti-Poverty Network, Poverty and inequality in the EU, EAPN Explainer, 2009, (p. 5ff).
- ↑ European Commission (Directorate-General for Employment, Social Affairs and Inclusion), Employment and Social Developments in Europe 2011, Publications Office of the European Union, Luxembourg, 2012 (p. 144).
- ↑ European Commission, Youth on the Move: An initiative to unleash the potential of young people to achieve smart, sustainable and inclusive growth in the European Union, Brussels, 2010.
- ↑ European Commission, An Agenda for new skills and jobs: A European contribution towards full employment, COM(2010) 0682
- ↑ European Commission, Social trends and dynamics of poverty, ESDE conference, Brussels, 2013
- ↑ European Commission, An Agenda for new skills and jobs: A European contribution towards full employment COM(2010) 682 final, Strasbourg, 2010.
- ↑ European Commission, European Platform against Poverty and Social Exclusion: A European framework for social and territorial cohesion, COM(2010) 758 final, Brussels, 2010.
- ↑ European Commission, Social Europe — Current challenges and the way forward. Annual Report of the Social Protection Committee (2012), Publications Office of the European Union, Luxembourg, 2013, (p. 12).
