- Data from July 2013. Most recent data:. Most recent data: Further Eurostat information, Main tables.
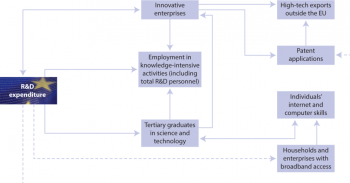
This article is part of a set of statistical articles based on the Eurostat publication Smarter, greener, more inclusive? - Indicators to support the Europe 2020 strategy. It provides recent statistics on research, development and innovation in the European Union (EU), key areas of the EU's Europe 2020 strategy.
Having more innovative products and services on the market addresses two objectives of the strategy’s smart growth objective: job creation through increased industrial competitiveness, labour productivity and the efficient use of resources; and finding solutions to societal challenges such as climate change and clean energy, security, and active and healthy ageing.
Europe 2020 strategy target on R&D The Europe 2020 strategy sets the target of ‘improving the conditions for research and develop-ment, in particular with the aim of increasing combined public and private investment levels for R&D to 3 % of GDP’ by 2020[1].
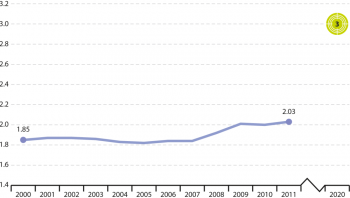
(% of GDP)
Source: Eurostat online data code (t2020_20) - (*) Data for 2000–2002 and 2008–2011 are estimates.
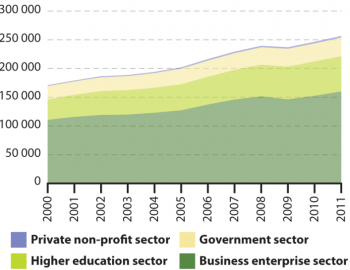
(million EUR)
Source: Eurostat online data code (rd_e_gerdtot) - (*) Data for 2000–2002 and 2008–2011 are estimates.
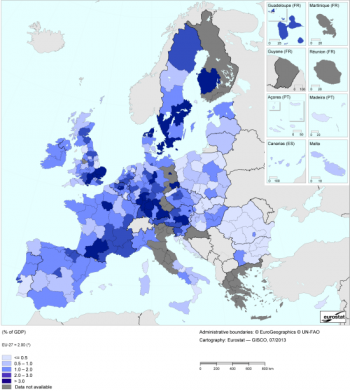
(% of GDP)
Source: Eurostat online data code (rd_e_gerdreg) - (*) Belgium, Croatia, Denmark, Germany, France, the Netherlands, Austria, Sweden, the United Kingdom and Iceland, 2009 data; EU-27, Ireland, Luxembourg, the Netherlands and the United Kingdom, estimated data.
(% of GDP)
Source: Eurostat online data code (rd_e_gerdreg)
Overall EU target: 3 %
Distance to the overall EU target: 1.00 pp
(*) Europe 2020 national targets: the Czech Republic: 1 % (public sector only), Ireland: approximately 2 % (2.5 % of GNP), Luxembourg: 2.3–2.6 %, . Portugal: 2.7–3.3 %.
(% of GDP)
Source: Eurostat online data code (t2020_20)
(Graduates per 1 000 inhabitants, 20 to 29 years old)
Source: Eurostat online data code (tps00188)
(% of total employment)
Source: Eurostat online data code (htec_kla_emp2)
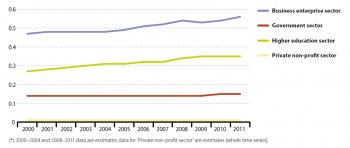
(% of total employment)
Source: Eurostat online data code (rd_p_perslf)
(*) 2000–2004 and 2008–2011 data are estimates; data for ‘Private non-profit sector’ are estimates (whole time series).
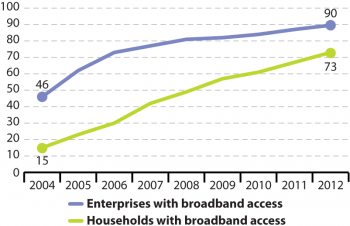
(% of households and % of enterprises)
Source: Eurostat online data code (tin00089) and (tin00090)
(*) Enterprises with broadband access refers to enterprises with at least 10 persons employed in the given NACE sectors; Break in series in 2009 (NACE Rev 2 since 2009).
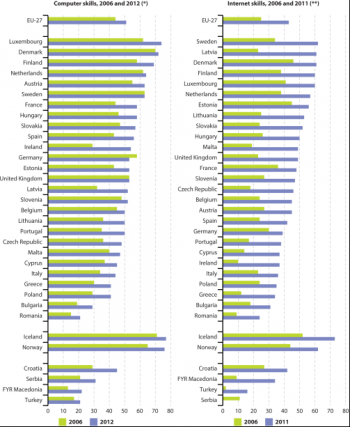
(% of the total number of individuals aged 16 to 74)
Source: Eurostat online data code (tsdsc460) and (tsdsc470)
(*) 2007 data (instead of 2006) for HR, RS and TR; 2009 data (instead of 2012) for MK, RS and TR.
(**) 2007 data (instead of 2006) for FR, HR and TR; only 2007 data for RS; 2010 data (instead of 2011) for MK and TR.

(% of the total number of enterprises)
Source: Eurostat online data code (inn_cis7_type)
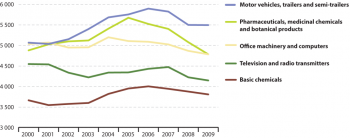
(number)
Source: Eurostat online data code (pat_ep_nnac)
(index 2007=100)
Source: Eurostat online data code (pat_ep_nnac)
(% of GDP)
Source: Eurostat online data code (pat_ep_nrg)
(% of GDP)
Source: Eurostat online data code (rd_e_gerdtot)
(*) EU-27 data for 2000–2003 and 2008–2011 are estimates; break in series in 2007 for South Korea; break in series in 2008 for Japan.
(million EUR)
Source: Eurostat online data code (htec_trd_group4)
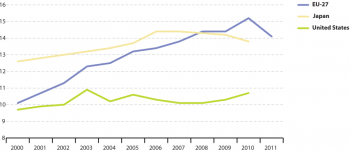
(per 1 000 of population aged 20 to 69)
Source: Eurostat online data code (tps00188)
(*) Data for 2000 to 2004 are Eurostat estimates.
Main statistical findings
How much is the EU investing in research and development?
The headline indicator ‘gross domestic expenditure on R&D’ shows the proportion of GDP dedicated to research and development[2]. It is also referred to as ‘R&D intensity’ and reflects the extent of research and innovation activities undertaken in a given country in terms of resources input.
Figure 1 shows a relatively stable trend in gross domestic expenditure on R&D of slightly over 1.8 % of gross domestic product (GDP) for the period 2000 to 2007. At the onset of the economic crisis, R&D intensity increased to slightly more than 2 % in 2009 and has remained at that level since then.
The reasons for this increase include, on the one hand, GDP falling more rapidly than overall R&D expenditure [3] (see Data sources and availability) and, on the other hand, the actions taken by individual EU Member States to step up public R&D investment. In 2009 a majority of the Member States sustained nominal growth in public R&D expenditure to counter the impacts of the crisis on private ¬investment [4].
The EU boosts public sector R&D expenditure in times of crisis
Expenditure on R&D is split into four institutional sectors: government, business enterprise, higher education and the private non-profit sector. Since 2000, expenditure has grown across all sectors in absolute terms at the European level (see Figure 3).
The two sectors with the highest expenditure on R&D in Europe have been the business enterprise sector, which made up 62 % (EUR 160 billion), and the higher education sector, which made up 24 % of total R&D expenditure in 2011. In the period from 2000 to 2011 expenditure by these two sectors grew by 45 % and 73 % respectively. The only exception to this increasing trend occurred in 2009 when business sector expenditure dropped by 3.5 % compared to 2008.
The government sector also plays an important role, especially in terms of long-term stability in R&D expenditure. This proves to be important in times of crisis when other sectors set new expenditure priorities. In 2011, the sector accounted for 13 % of total expenditure in R&D in 2011. Between 2000 and 2011 its R&D expenditure grew by 39 %.
When the financial and economic crisis hit Europe in 2008, EU Member States boosted public R&D expenditure to stimulate economic growth and encourage private R&D investment. Government sector R&D expenditure grew by 2.7 % between 2008 and 2009, and it continued to grow in the following years.
In comparison, R&D expenditure of the business sector declined by 3.5 % over the same period. This drop was much less than the effect of the crisis on companies’ net sales and profits [5]. During an economic crisis businesses usually decrease their R&D expenditure (see see Data sources and availability). However, R&D spending actually started to increase again with growth rates of 4.2 % and 4.9 % in 2010 and 2011 respectively, indicating that increased public R&D expenditure encouraged further private R&D expenditure.
Member States stepping up spending on R&D
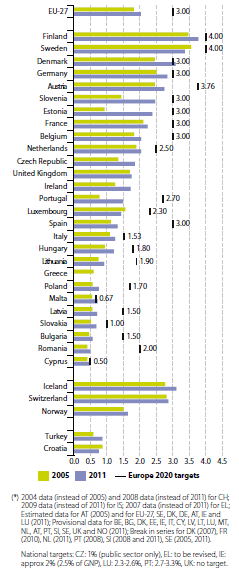
Figure 4 shows a rather heterogeneous picture of EU Member States’ R&D expenditure as a percentage of GDP. Overall, in 2011 R&D expenditure varied from 0.5 % to 3.8 % across the EU. Northern European countries such as Finland and Sweden generally shared a pattern of high expenditure; however, except for Denmark, none have yet achieved their national targets. Countries with lower R&D expenditure levels were mostly in Eastern and Southern Europe, for instance Romania, Cyprus and Bulgaria.
The financial crisis and its adverse impact on the growth of GDP in the following years, combined with an increase in nominal government spending on R&D, led to a widespread increase in R&D intensity across Europe. Nevertheless, the analysis showed that the European Commission and individual Member States put investment in R&D high on the agenda for combating the crisis.
One out of ten EU regions shows substantially high R&D intensity
As indicated in Map 2.1, 30 of the EU‘s NUTS 2 regions had R&D intensity above 3.00 % in 2010. As such, they exceeded the 3.00 % target set by the Barcelona Council in 2002 and maintained within the Europe 2020 strategy. Among these 30 regions, 10 were in Germany, five in the United Kingdom, four in Sweden, three in Denmark and two each in Belgium, France, Austria and Finland. Together these 30 regions accounted for 38.4 % of all R & D expenditure in the EU-27 in 2010.
Remarkably, nine of the regions where R&D intensity was over 3.00 % were located in the Nordic Member States. The three Danish and four Swedish regions with R&D intensity above 3.00 % collectively contributed 6.5 % to total R&D expenditure in the EU-27 in 2009 while the two Finnish regions contributed 1.2 % in 2010.
Those EU Member States with relatively low levels of national R & D intensity tended to display a narrow range of values for R&D intensity across their regions. This was particularly true for Romania, Bulgaria, Greece, Slovakia and Ireland. In half of the 20 EU Member States for which data are available (Bulgaria, Denmark, Spain, Hungary, Austria, Poland, Portugal, Romania, Slovenia and Slovakia), the capital city region recorded the highest level of R&D intensity.
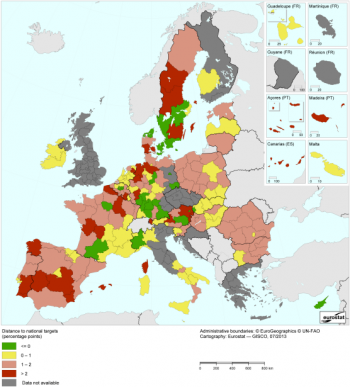
Map 2.2 highlights the distance of regions (at NUTS 2 level) to the respective national Europe 2020 targets in 2010. The cross-country regional performance in terms of R&D intensity shows a quite different picture compared with the distance to the national target. Essentially, EU Member States with a high number of regions scoring above EU average R&D intensity only had a few regions that achieved their respective national targets. This might be a result of the different level of ambition reflected in the national R&D intensity targets, which determines the difficulty of reaching these goals.
Policy cornerstones helping Member States to create a well-functioning R&D system
Research and development are needed to help tackle the EU’s employment, education, competitiveness and future societal challenges such as climate change and clean energy. To meet these challenges, the EU proposes a set of important policy cornerstones to help Member States create well performing national research systems[6]:
- Placement of innovation at the heart of government policy design.
- Adequate and predictable public investment to provide a stable, long-term and appropriate environment for research and innovation, which in turn stimulates private sector investment.
- Adoption of a broad-based definition for innovation going beyond technological research and its applications such as non-technological, user-driven and social innovation.
- Strong focus on the development of human resources.
- Appropriate framework for stimulating growth of innovative enterprises.
- Public sector interventions through innovation-friendly public procurement mechanisms.
How the EU strengthens its human capital and knowledge base
Current skill mismatches are a threat to Europe’s innovation capacity at a time of increasing technological needs (also see chapters on Employment and Education). In particular there is a shortage of human resources such as scientists and engineers.
Knowledge and skills are crucial for gaining new scientific and technological expertise and for building the economy’s capacity to absorb and use this knowledge (see see Data sources and availability). R&D expenditure covers a substantial part of expenditure on skills and education and, therefore, constitutes a vital enabling factor for human capital. In this regard, the EU will need to train and employ at least one million new researchers compared with 2008 levels if it is to reach the R&D target of 3 % [7].
The number of science graduates in the EU is increasing
Making good progress towards the Europe 2020 strategy’s R&D target requires fundamental changes in the economy and the educational and labour market system. To fully absorb the increases in R&D budgets, the output and excellence of Europe’s tertiary education system needs to be stepped up. This means providing the capacity to make use of the increased spending on R&D.
Empowering women in tertiary education and enhancing their employment opportunities in the R&D sector is an important issue for the EU. However, gender equality heavily relies on a multitude of factors such as the combined effects of R&D innovation systems, the importance of science to the national economy, the features of the labour market and equality policies in place.
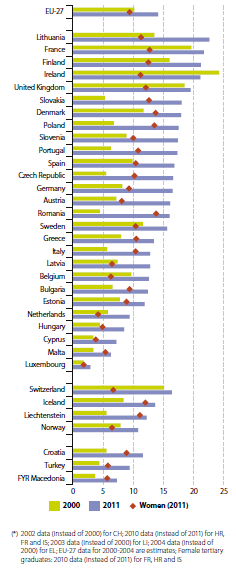
An ever increasing number of the EU population are graduating from tertiary education in science and technology. Figure 5 shows how this trend has developed over the past decade. Between 2000 and 2011, the number of tertiary graduates in science and technology grew by almost 70 %, from 10 graduates per 1 000 inhabitants in 2000 to almost 14 graduates per 1 000 inhabitants in 2011.
This trend varies considerably across EU Member States (see Figure 5). In 2011, the number of science and technology graduates ranged from about 23 per 1 000 inhabitants in Lithuania to 6 per 1 000 inhabitants in Malta (Luxembourg being an exception with only 3 per 1 000 inhabitants). This gap has serious implications for labour mobility and the notion of a barrier-free labour market in the EU (see see Data sources and availability). All countries except Ireland have increased tertiary education graduations since 2000. Between 2000 and 2011 Slovakia, the Czech Republic and Romania practically tripled graduate rates. Poland, Austria, Germany, Portugal, Italy, Lithuania, Cyprus and Malta more than doubled their rates.
Remarkably, between 2000 and 2011 the share of female graduates grew slightly faster than the overall growth in science and technology graduates. This trend could in the future help address the current underrepresentation of women in science and research careers and PhD positions. It could also mean the trend of men outnumbering women in employment of researchers (men accounting for 67 %), PhD students (51 %) and graduates (54 %) might be reversed [8]. In Lithuania, Romania, Italy and Malta women already made up more than 80 % of total graduates in 2011.
What is the EU’s performance with regard to employment?
As outlined earlier, Europe is making progress in terms of its academic tertiary education output. Taken together, a sufficiently high number of researchers and excellence in skills and performance are key factors for the creation and implementation of novel ideas in a knowledge- and research-intensive economy.
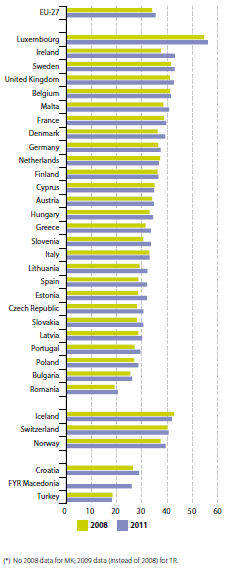
In the EU-27, the number of people employed in knowledge-intensive activities as a share of total employment increased slightly from 34.1 % in 2008 to 35.5 % in 2011. However, the picture across Members States is rather mixed, as shown in Figure 6. While in 2011 Romania (20.5 %), Bulgaria (26.1 %) and Poland (28.6 %) showed the lowest percentages, Luxembourg (56.2 %), Ireland (43.1 %) and Sweden (43.0 %) had the highest rates.
As a general trend, between 2008 and 2011, employment in knowledge-intensive activities increased in almost all EU Member States, demonstrating that the EU is moving towards a more knowledge-based economy. Countries making substantial progress were Ireland (5.6 percentage points), followed by Spain, Estonia, Lithuania and Slovenia, all experiencing a period of continuous expansion of employment in knowledge-intensive activities of 3.0 to 3.5 percentage points. There were falls in the Netherlands (– 0.5 percentage points) and Cyprus (– 0.2 percentage points).
At the EU level, total R&D personnel (in head count) constituted 1.68 % of total employment in 2009. This translates into about 2.5 million people in full-time equivalent positions working in R&D.
As shown in Figure 7, R&D personnel as percentage of the labour force increased in three of the institutional sectors between 2000 and 2011; however, the rate of growth was quite different between the sectors. The business enterprise sector grew by 0.09 percentage points between 2000 and 2011, followed by the higher education sector which grew by 0.08 percentage points over the same period. The government sector increased by only 0.01 percentage points. The private non-profit sector remained stable at 0.01 % over that period.
ICT connectivity and digital skills are central to a knowledge-based economy
Information and communications technology (ICT) skills and knowledge are essential for the development of an effective research and innovation system. In that sense, they are an important part of the skills base necessary in today’s interactive and connected world.
Furthermore, ICT development and usage skills are a new driver for employment and R&D in Europe. The ICT sector, including information industries, accounts for 6 % of GDP and is responsible for a fifth of business R&D spending. Moreover, it is one of Europe’s fastest growing sectors [9]. A number of EU policy strategies under the Europe 2020 strategy umbrella tackle the issue of ICT connectivity and skills at the business and citizen levels (see Data sources and availability).
A large part of the EU population is, however, affected by a growing digital literacy deficit. The exclusion of many people from the digital knowledge-based society and economy is holding back the large multiplier effect of ICT take-up in fostering innovations and, consequently, productivity growth. These skills do not only improve employability, they also enhance societal learning, creativity, emancipation and empowerment.
Broadband access for businesses and for households increased substantially
Availability of infrastructure is one of the foundations for diffusing the digital and knowl-edge-based economy into the very corners of society. Therefore, increased broadband access for private and business usage is an important enabling factor.
In line with the most recent developments in the global internet and increased network coverage as well as affordability, the share of broadband access of European households and enterprises increased tremendously over the period 2004 to 2012. Enterprises’ access to broadband connections almost doubled (from 46 % to 90 %), while the share of households enjoying access to the broadband infrastructure increased nearly fivefold (from 15 % to 73 %).
This pattern of growing access to ICT infrastructure is also reflected at Member State level. Between 2004 and 2012 the share of households and enterprises with broadband access increased in all Member States. In 2012, Denmark, Germany, the Netherlands, Finland, Sweden and the United Kingdom showed the highest shares of household connectivity of above 80 %. Countries with lower access rates, but with the highest growth rates in Europe, were mainly Eastern and Southern European countries. Starting from almost no household broadband connectivity in 2004, Greece and Cyprus increased the share of households with access to broadband by 30 times or more by 2012.
Compared with household connectivity, differences in enterprises’ broadband access in 2012 were less pronounced, especially in Eastern and Southern Europe. In 2012 enterprises’ access varied from 98 % in Finland to 63 % in Romania. By 2012 Spain, Cyprus and Lithuania had achieved remarkable progress towards access rates of about 95 %.
Increase in the EU population’s digital skills
Between 2006 and 2012 the share of individuals with at least a medium level of basic computer skills [10] in the EU grew slightly from 44 % to 51 % (see left-hand graph in Figure 9). In 2012 the share of individuals with at least a medium level of basic computer skills in the EU countries ranged between 74 % and 21 %. High shares of such levels of computer skills could be found in Luxembourg, Denmark and Finland.
As for computer skills, internet skills are equally important for a society’s digital knowledge base. The trend observed in Figure 9 (right-hand graph) shows that between 2006 and 2011 the share of individuals with at least a medium level of internet skills [11] increased substantially, from 25 % to 43 % at the EU level. This favourable trend is mirrored in the development in EU Member States: all succeeded in improving their populations’ internet skills between 2006 and 2011.
The increases in internet skills across the EU in general reflect the developments in terms of connectivity (see Figure 8). Thus it is not surprising that many Member States such as the Czech Republic, Greece, Ireland, Cyprus, Latvia, Malta and Romania increased the share of people having advanced internet skills by more than 2.5 times.
How are businesses achieving technology-based innovation and getting good ideas to the market?
A dynamic business environment is fundamental for the promotion and diffusion of innovations. In this regard, the challenge is to utilise R&D via entrepreneurship and creativity to trigger innovation and economic competitiveness and, consequently, achieve job creation. Therefore, measures targeting knowledge diffusion and absorption, for example, through the creation of technology markets and licensing schemes, are equally important as investment in the knowledge generation (see see Data sources and availability). Accordingly, the higher the uptake and use of ideas from R&D, the more likely those innovative players will invest in future knowledge generation in the form of increased private R&D expenditure.
Furthermore, innovative players also facilitate a more dynamic system. In many cases they contribute to the necessary structural and technological change to adapt to new circumstances and challenges. An example of this is the depletion of fossil fuels and the consequent transition towards more renewable energy sources.
Significant progress in achieving knowledge diffusion and absorption is measured through growth in innovative firms, the number of patent applications, the export of high-tech products, and the number of patents related to societal challenges such as climate change.
More than half of EU enterprises contribute towards innovation activity
With regard to innovativeness, more than half of the EU’s enterprises reported innovation activity in 2010 (see Figure 10). Member States considered as innovation leaders, with a share of innovative enterprises being substantially above the EU average of 53 %, are Germany (79 %) and Luxembourg (68 %).
Innovative companies can be distinguished depending on the type of innovation they are following. Figure 10 shows how companies diversify their business strategy leading to different innovation types such as product and/or process as well as organisational and/or marketing innovation.
How are EU sectors performing with regard to new patent applications?
A higher scientific output in the public sector is positively related to a higher business sector R&D investment and innovation. The more cutting-edge knowledge has been produced, the more likely it is that such knowledge should spill over into new products and services and hence private R&D activities. In this regard, patents provide a valuable measure of the exploitation of research results and of inventiveness of countries, regions and firms (see see Data sources and availability).
Over the period 2000 to 2007, patent applications in the EU manufacturing sector increased almost continuously until the global economic and financial crisis began to be felt in 2008. After having peaked in 2006, EU patent applications fell by more than 4 % from 2007 to 2009. This is also reflected in the total number of patent applications at EU level which declined by more than 6 % between 2007 and 2011.
Taking a more detailed view of the manufacturing sector, the trend at EU level is to a large extent mirrored in the individual sectors as outlined in Figure 11[12]. Among the five selected subsectors, which constitute a major part of Europe’s manufacturing sector, the pharmaceuticals sector has been hit the hardest: patent applications dropped by more than 11.4 % between 2007 and 2009, followed by the television and radio transmitters sector (– 7.3 %). All remaining sectors — basic chemicals, office machinery and computers, and motor vehicles, trailers and semi-trailers — have been hit to a lesser degree (varying between – 3.4 % and – 5.6 %).
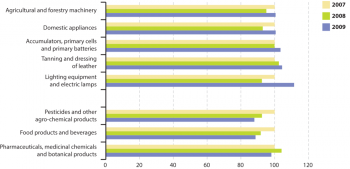
As indicated in Figure 12 the magnitude of the financial crisis’s impact on various manufacturing sectors’ patent applications varied substantially between 2007 and 2009. Patent applications dropped most in chemical manufacturing, subsector ‘pesticides and other agro-chemical products’ (– 12.0 %) and in the food production sector, sub-sector ‘food products and beverages’ (– 11.3 %).
Other manufacturing sectors which have been more robust include ‘tanning and dressing of leather’ and the ‘accumulators, primary cells and primary batteries’ sectors with stable or even increasing levels during the crisis.
Technological solutions addressing climate change
The EU targets its investment strategies towards innovation-oriented sectors that help address some of society’s most pressing challenges. Essentially, research and innovation in combination with market development measures can help provide the necessary structural and technological solutions to societal challenges, such as climate change, a healthy ageing or security of material supply. Accordingly, targeted sectors also represent future areas of potential economic growth and jobs.
In this regard the European Commission initiated a series of ‘innovation partnerships’ under the umbrella of the flagship initiative ‘Innovation Union’ by fostering the development and deployment of the technologies needed to meet the challenges identified.
The patent market addressing climate change has been equally hit by the crisis
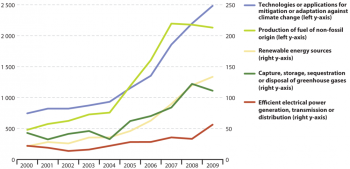
During the past decade Europe’s progress in addressing societal challenges through patenting has been focused on climate change mitigation and adaptation[13]. Figure 13 shows Europe’s efforts towards tackling the global challenge of climate change in terms of patent applications in the area of mitigation or adaptation against climate change. Like conventional manufacturing patent applications, the market for patent applications targeting climate change adaptation and mitigation did not escape the turmoil in European markets created by the financial and economic crisis.
Since 2000, Europe’s patent market for climate change mitigation and adaptation experienced an almost continuous increase until the crisis hit in 2008. This led to a sharp drop in patent applications of 10 %. While more than 95 % of the market is dominated by patent applications from the ‘energy generation, transmission or distribution’ sector, the newer ‘capture, storage, sequestration or disposal of greenhouse gases’ sector, which only accounts for about 4 %, was strongly affected by the crisis. Patent applications in this sector dropped by nearly one third in 2009.
While most of the sectors (renewable energy, carbon capture and storage and non-fossil fuel) have experienced a fall in the number of patent applications, remarkably the area of efficient electrical power generation, transmission or distribution has experienced virtually uninterrupted growth since 2003. Particularly during the time the crisis hit the market in 2009, patent applications peaked reflecting a growth rate of more than 60 %. During this period the most important driver for a technological push (echoing the expansion of patent applications) towards more efficient, secure and clean energy generation was the geopolitical situation in many oil-exporting countries worldwide and the oil crisis during 2003 and 2008.
Is the EU a competitive global player in R&D?
Investment in R&D remains crucial for maintaining a competitive advantage over other world innovation leaders with regard to high-quality science and innovative products. Compared with other global players such as the US, Japan and South Korea, the EU’s performance in terms of business R&D expenditure, patent applications and tertiary education is lagging behind [14].
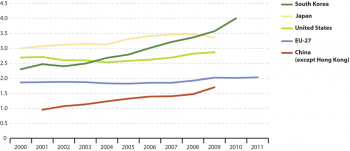
During the period 2000 to 2011, EU-27 R&D intensity remained relatively stable at around 2 % of GDP. On the contrary, other world competitors experienced moderate growth in R&D intensity (0.16 percentage points) over the period 2001 to 2009 (see Figure 14). Substantial progress in terms of R&D intensity could be observed in South Korea (2000 to 2010) and China (2001 to 2009), with increases of 1.7 and 0.75 percentage points respectively. On the other hand, the United States (0.18 percentage points) and Japan (0.36 percentage points) went through a more moderate period of R&D intensity growth between 2000 and 2009.
Furthermore, the United States, Japan and South Korea are not only outperforming the EU in overall R&D intensity, but also in terms of business enterprise R&D intensity. While the EU only marks a share of about 60 % of its R&D intensity originating from the business enterprise sector, other countries such as Japan and South Korea register more than 75 % of R&D intensity from the business enterprise sector.
Which sectors are frontrunners in R&D output in the international market?
Beyond turning research results into tangible applications, innovative businesses compete globally to sell their high-tech products on the world market. By bringing good ideas to the market, businesses contribute to innovation-related trade, for example, in manufactured goods, for the benefit of an economy’s balance of trade. Even though only 13 % of the EU’s small and medium enterprises (SMEs) are active in markets outside the EU, evidence suggests that internationally active SMEs show greater employment growth than non-exporters [15].
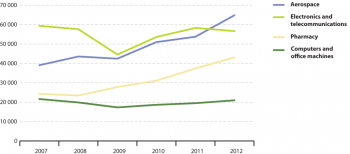
As a result of the economic crisis, total EU high-tech exports to outside the EU fell during 2008 and 2009. However, after the sharp drop in 2009 high-tech exports quickly recovered and continuously increased by more than 40 % by 2012. Similar development trends can be observed at the individual sector level. Since the recovery from the impacts of the economic crisis, the aerospace and pharmacy sectors, with growth rates of more than 50 % between 2009 and 2012, have been the main drivers behind high-tech exports by the EU.
The EU’s international performance with regard to human capital
Since 2000, Europe’s international position in terms of tertiary education graduates has improved almost continuously compared to the United States and Japan. A rising number of tertiary education graduates is fundamental with regard to the two challenges. On the one hand, the EU target of raising R&D intensity to 3 % will require it to substantially invest in future human capital to absorb these investments and, on the other hand, taking provisions to tackle the upcoming demographic challenge of an increasing number of elderly and a decreasing number of young people.
Since 2008 the EU has outperformed Japan with regard to tertiary graduates. However, between 2010 and 2011 tertiary graduation rates significantly dropped by more than 7 %, from 15.2 to 14.1 per 1 000 population.
Conclusions and outlook towards 2020
The EU followed a relatively stable trend of 1.8 % in gross domestic expenditure on R&D as a percentage of GDP (R&D intensity) between 2000 and 2007. In the two following years, R&D intensity grew to about 2 % of GDP and remained at that level until 2011. This was due to the combined effect of the crisis and its adverse impact on GDP growth and an increase in nominal government spending on R&D for combating the long-term impacts of the crisis. At the global level, the EU is catching up in terms of R&D expenditure and output compared with the United States, Japan, South Korea and China.
Digital literacy, measured in computer and internet skills, contributes to employability, societal learning, creativity, emancipation and empowerment.
While the share of individuals in the EU having at least medium computer skills increased only slightly from 44 % to 51 % between 2006 and 2012, for internet skills it increased substantially from 25 % to 43 % between 2006 and 2011. Overall these trends have been partly facilitated by some far-reaching developments in terms of connectivity.
In general, the EU has increased its output of tertiary graduates in science and technology by almost 50 % between 2000 and 2011. Particularly, the share of female graduates grew slightly faster than the overall growth in science and technology graduates potentially impacting on future employment gender equality. In this regard the EU is making progress towards tackling the demographic challenge ahead and, furthermore, preparing for increased future R&D investment.
As a general trend, between 2008 and 2011, employment in knowledge-intensive activities increased in almost all EU Member States demonstrating that the EU is moving towards a more knowledge-based economy.
The EU’s technological output in the form of patents in the manufacturing sector experienced an almost continuous increase until the impact of the global economic and financial crisis began to be felt in 2008. EU patent applications having peaked in 2006 decreased by more than 4 % during the crisis (2007 to 2009). A more detailed view of the manufacturing sector reveals that the trend at the EU level is to a large extent reflected in the development of the individual sectors. Moreover, the market addressing technological solutions for climate change has been equally hit by the crisis. Since 2000, Europe’s patent market for climate change mitigation and adaptation experienced an almost continuous increase until the crisis hit in 2009. This led to a sharp drop in patent applications. This might not only affect Europe’s position on the world market but additionally compromise its ability to respond to the ever-increasing problems of climate change and security of energy supply.
Efforts needed to meet the Europe 2020 target on R&D
Based on extrapolation of the R&D intensity of individual EU Member States the EU would fall short of its 3 % target by 0.2 % to 0.3 %, representing a total sum of EUR 24 to 35 billion with respect to the EU’s 2009 GDP [16]. There is a clear need to improve the conditions for private R&D investments in the EU and many of the measures proposed in the Europe 2020 strategy account for this.
Besides context-specific factors influencing R&D investment, some main causes of policy failure include insufficient or inadequate public funding of the science base and higher education system or inefficient public incentives to stimulate business R&D. Furthermore, a poor match between supply (e.g. investment in R&D) and demand-side measures (i.e. policies stimulating demand for innovative products and solutions) as well as bottlenecks restricting the growth of firms in innovative sectors are among the factors impeding successful R&D policy [17].
Despite the strong effect of the economic crisis on companies’ net sales and profits on a global scale, investment in R&D by the business enterprise sector in Europe recovered quite quickly, demonstrating comparatively high growth rates in 2010 and 2011. Nevertheless, compared to its international competitors, the United States, Japan and South Korea, the EU still has to catch up and reduce the gap with regard to overall R&D intensity.
The Europe 2020 strategy tries to overcome the economic crisis and its impacts by addressing the shortcomings of the European growth model and creating the conditions for a different type of growth through more effective investments in education, research and innovation.
Among these the flagship initiative ‘Innovation Union’ is one of the most prominent. It places renewed emphasis on using public sector intervention to stimulate the private sector and to remove bottlenecks to enable the conversion of Europe’s scientific expertise into marketable products and services. More specifically the flagship initiative addresses issues such as removing obstacles for companies to innovate, commercialisation, development and deployment of technologies into society, public procurement, international cooperation in research and development, as well as reducing fragmentation and duplication of research efforts. Furthermore it refocuses research and development on the challenges facing our society, such as climate change, resource efficiency and demographic change.
The European Research Area (ERA) is designed to overcome barriers thought to have hindered European research efforts, for example, by addressing geographical, institutional, disciplinary and sectoral boundaries. In this regard it creates attractive conditions for carrying out research and investing in R&D intensive sectors and fosters Europe-wide scientific competition, together with the appropriate level of cooperation and coordination.
Horizon 2020 [18] is the financial instrument implementing ‘Innovation Union’ in the EU. It focuses on turning scientific breakthroughs into innovative goods and services that have the potential to tackle societal challenges such as resource efficiency, active ageing as well as climate change and to secure Europe’s global competitiveness.
Data sources and availability
Total R&D expenditure combines public and private funding
Private R&D expenditure is the main component of total R&D expenditure in the more advanced knowledge economies. Its level reflects the attractiveness of the national research and innovation system for business investments and the structure of the economy. Private R&D funding is strongly concentrated in a few research-intensive sectors categorised as High-Tech and Medium-High-Tech Manufacturing and High-Tech Knowledge Intensive Services.
Public R&D funding shows the commitment of a government to promoting research, development and innovation activities both directly and through the leverage effect on business R&D expenditure. In some countries, structural funds have become a significant (and the main) source of public R&D funding (Bulgaria, Czech Republic, Estonia, Hungary, Latvia, Lithuania, Poland, Romania, Slovenia and Slovakia).
The role of anti-cyclic public R&D investment policy
Investment spending (private or public), in general, typically follows cyclical and volatile patterns with regard to GDP growth. During the economic crisis when GDP growth slowed down companies faced tough market conditions. They had difficulties accessing financial resources because banks had decreased supply. On the other hand, countries struggling to lower their debt experienced a decrease in demand for financial funding. Consequently, the crisis caused a decrease in both supply and demand for financial resources intended for investment in general, including in R&D
On the contrary, growth in public or government-financed R&D investment usually experiences counter or anti-cyclical trends. During the economic crisis in 2008–2009, the European Commission and EU Member States took concerted action to increase public R&D investment, not just to stimulate economic growth but also to encourage private R&D investment.
The knowledge triangle: education facilitates research and innovation
Education is the ultimate means to building up human capital and is strongly linked to the concepts of research and innovation. These three concepts, which are central drivers of a knowledge-based society, form the so-called knowledge triangle [19]. This concept couples education, academic research and knowledge production, and innovation, and highlights the mutual benefits from strong inter-linkages among the three. To realise a cohesive European Research Area (ERA), education, research and innovation need to develop strong links with each other (See figure 4 bis).
Researchers’ mobility is intrinsic to the development of a dynamic, knowledge-based Europe
The promotion of the so-called ‘Fifth Freedom’ [20], that is the free movement of knowledge, contributes to an internal knowledge market in Europe, where researchers, science and technologies can circulate freely. This optimises knowledge spill‑overs and increases employment opportunities for researchers. A framework for enhanced mobility of students and researchers, as proposed by the flagship initiative ‘Innovation Union’ [21] and the ‘European Research Area’ [22], is crucial in this respect.
Policies fostering ICT connectivity and digital skills
A series of high-level Europe 2020 initiatives address the two issues of investment in connectivity and ICT skills. Connectivity, on the one hand, is addressed by the flagship initiative ‘Digital Agenda for Europe’ [23] that contributes to the smart growth priority to boost citizens and businesses’ access to broadband. ICT skills, on the other hand, are targeted by another flagship initiative, the ‘Agenda for new skills and jobs’. It facilitates the inclusive growth priority, supporting the improvement of e-skill levels in the labour force and the creation of jobs through an enhanced set of skills and in the ICT sector overall.
Relationships between R&D, innovation and patents
The classical rationale for filing patents is that it encourages companies to produce the innovation. According to literature [24] a company’s propensity towards patents is influenced by three factors: R&D efforts, strategic considerations and the competitive environment. One of the trade-offs for filing patent applications is the limited ex-post diffusion in society by excluding other parties from using the invention, unless
permitted by the patent holder [25].
Since the 1990s, a trend of increased propensity to patent without a corresponding growth in R&D expenditure has been experienced in the United States as well as EU Member States. This trend reflects an increase in R&D productivity.
Next to patent development, the extent to which patents — reservoirs of potential innovations — are actually used for economic and societal purposes remains of major importance. Therefore, the tendency for higher propensity to patent for reasons other than increasing productivity and innovation (for example, guaranteeing protection from rivals), bearing risks that patents are not used, have largely been alleviated by means of licensing. [26].
The relevance of research and innovation for societal progress
Research enlarges the scientific and technological knowledge required to tackle societal problems or simply to satisfy intellectual curiosity. Innovation creates value by introducing new products, processes, services and ways of doing things. The two concepts are intertwined, with scientific and technological research providing knowledge inputs for innovation.
Innovation is a rather broad concept that encompasses the capacity of a company, economy or society to adapt to changing environments and circumstances in different ways. It comprises a variety of aspects [27]:
- Product, process and service innovation: the introduction of new products, processes and services
- Organisational innovation: changes in the way business or manufacturing processes are organised.
- User-driven innovation: innovation that draws heavily on knowledge inputs from customers and markets.
- Open innovation: changes in the way companies and other organisations access and exploit knowledge to innovate.
- Social innovation: innovations in the way society organises itself, especially the different ways that the public sector serves the needs of society at large.
All of these innovation types have socio-economic impacts, for example, research and innovation have a strong relationship with technical change, knowledge capabilities or the productivity of companies. More specifically, a positive relationship exists between innovation and socioeconomic performance. For example, regions with high levels of innovation are more likely to have higher levels of development (in GDP), labour productivity and employment rates, and (to a lesser extent) lower energy usage [28].
The addition of the third concept of education forms the notion of the knowledge triangle: education, research and innovation. These three concepts benefit from their strong interlinkages (see see Data sources and availability).
Context
Research and development - why do they matter?
Research, development and innovation are key policy components of the Europe 2020 strategy. By fostering an increase in the number of innovative products and services on the market, they contribute to the strategy’s smart growth objective, create jobs and address societal challenges. By paving the way towards increased industrial competitiveness, labour productivity and the efficient use of resources, they are also at the heart of sustainable growth. In particular the ‘Innovation Union’ flagship initiative aims to create favourable framework conditions for EU researchers and entrepreneurs.
R&D contributes to a well-functioning, knowledge-based economy by fostering knowledge and know-how that translate into new ideas for products, procedures and services. An innovative society helps companies grow and maintain their competitive advantage, resulting in economic growth and more jobs. The well-being of the EU population also depends on scientific and technical solutions to global societal challenges such as climate change and clean energy, security, and active and healthy ageing.
Competitiveness and jobs and the EU societal challenges are mutually reinforcing: fast-growing innovative companies create new, high added-value jobs while developing new products and services in response to the needs of society.
The analysis in this chapter is based on the headline indicator ‘Gross domestic expenditure on R&D’, monitoring the strategy’s research and development target. Contextual indicators are used to present a broader picture, looking into potential drivers behind the changes observed in the headline indicator and the impacts of the EU’s expenditure on its R&D and innovation activities.
The analysis first sheds light on fundamental enabling factors that drive innovation and, as a result, are the first link in the innovation chain, including issues such as public and private R&D investment or tertiary educational attainment. The analysis then highlights the EU’s performance concerning business frontrunners, their innovative capacity and technological output addressing the end of the innovation chain towards commercialisation and the relevance for societal challenges. This is followed by a look at the bigger R&D picture, by comparing the EU’s performance to global competitors.
The EU’s R&D intensity target has a mutually beneficial relationship with the strategy’s tertiary educational attainment and employment targets (see chapters on Employment and Education). On the one hand, human skills development feeds the development of academic knowledge and innovative products. On the other hand, increased investment in R&D provides new jobs in business and academia, increasing demand for scientists and researchers in the labour market. Moreover, increased investment in education and skills development, as well as an increase in the output of tertiary education graduates, improves the skills base of the EU labour force and, therefore, its employability.
A competitive and innovative knowledge-based economy is strongly dependent on its human capital. R&D investment and the Europe 2020 target on tertiary education are closely interlinked. Mutual benefits between the strategy’s targets on R&D and on climate change and energy exist when taking into account the future potential of innovative new products and processes tackling those societal challenges (see the chapter on Climate change and energy).
Further Eurostat information
Publications
Main tables
Dedicated section
Methodology / Metadata
- Towards robust quality management for European Statistics - Communication from the Commission to the European Parliament and the Council COM(2011) 211 final
Other information
- Regulation 223/2009 of 11 March 2009 on European statistics
External links
See also
Notes
- European Council conclusions 17 June 2010, EUCO 13/10, Brussels, 2010. ↑
- Research and experimental development (R&D) comprise creative work undertaken on a systematic basis in order to increase the stock of knowledge, including knowledge of man, culture and society and the use of this stock of knowledge to devise new applications’; (Frascati Manual, 2002 edition, § 63). ↑
- European Commission, Innovation Union Competitiveness Report 2011. Belgium, 2011 (p. 64). ↑
- European Commission, Innovation Union Competitiveness Report 2011. Belgium, 2011 (p. 65). ↑
- European Commission, Monitoring industrial research: The 2010 EU industrial R & D investment scoreboard. Luxemburg, 2010 (p. 19). ↑
- European Commission, Commission staff working document — A rationale for action accompanying the Europe 2020 Flagship Initiative Innovation Union. SEC(2010) 1161 final Brussels, 2010 (p. 74, 75). ↑
- European Commission, Commission staff working document — A rationale for action accompanying the Europe 2020 Flagship Initiative Innovation Union. SEC(2010) 1161 final Brussels, 2010 (p. 86). ↑
- European Commission, She figures 2012 — Gender in Research and Innovation. Luxemburg, 2012 (p. 5). ↑
- European Commission, Digital Agenda: Broadband and E-Communications (accessed 04.09.2013). ↑
- The data refer to individuals having either a medium or a high level of computer skills. A high level of basic computer skills refers to individuals who were able to carry out 5 or 6 of 6 computer-related items, whereas a medium level of basic computer skills refers to individuals who have carried out 3 or 4 of the following 6 computer-related items: copy or move a file or folder; use copy and paste tools to duplicate or move information within a document; use basis arithmetic formula (add, substract, multiply, divide) in a spreadsheet; compress files; connect and install new devices, e.g. a printer or a modem; write a computer program using a specialised programming language. ↑
- The data refer to individuals having either a medium or a high level of internet skills. A high level of basic internet skills refers to individuals who were able to carry out 5 or 6 of 6 internet-related items, whereas a medium level of basic internet skills refers to individuals who have carried out 3 or 4 of the following 6 internet-related items: use a search engine to find information; send an e-mail with attached files; post messages to chatrooms, newsgroups or any online discussion forum; use the Internet to make telephone calls; use peer-to-peer file sharing for exchanging movies, music etc.; create a web page. ↑
- The selection of sectors is based on the most active ones in terms of patent applications. ↑
- European Commission, 2011. Innovation Union Competitiveness Report 2011. Belgium, 2011 (p. 415). ↑
- European Commission, 2013. Innovation Union Scoreboard 2013. Belgium, 2013 (p. 7). ↑
- European Commission, Commission staff working document — A rationale for action accompanying the Europe 2020 Flagship Initiative Innovation Union. SEC(2010) 1161 final Brussels, 2010 (p. 73). ↑
- European Commission, 2011. Innovation Union Competitiveness Report 2011. Belgium, 2011 (p. 57). ↑
- European Commission, Europe 2020 flagship initiative Innovation Union, SEC(2020)1161, Annex 1: Self assessment tool, 2010 (p. 32). ↑
- http://ec.europa.eu/research/horizon2020/index_en.cfm. ↑
- European Institute of Innovation and Technology, Catalysing innovation in the knowledge triangle: practices from the EIT knowledge and innovation communities, 2012 (p. 8). ↑
- The need for a ’Fifth Freedom’ relating to research was first raised by Commissioner Potočnik in a speech in April 2007; see http://europa.eu/rapid/press-release_SPEECH-07-257_en.htm. ↑
- European Commission, Commission staff working document — A rationale for action accompanying the Europe 2020 Flagship Initiative Innovation Union. SEC(2010) 1161 final Brussels, 2010 (p. 39–40). ↑
- European Commission, A Reinforced European Research Area Partnership for Excellence and Growth. COM(2012) 392 final, Brussels, 2012 (p. 10). ↑
- European Commission, A Digital Agenda for Europe, COM(2010)245 final, Brussels, 2010. ↑
- Harhoff, D., Hall, B.H., von Graevenitz, G., Hoisl, K., Wagner, S., Gambardella, A. and Giuri, P., The strategic use of patents and its implications for enterprise and competition policies, Final Report to DG Enterprise, JULY 8, 2007 (p. 7). ↑
- Gambardella, A., Giuri, P. and Mariani, M., Study on evaluating the knowledge economy: what are patents actually worth? The value of patents for today’s economy and society. Project ETD/2004/IM/E3/77 for DG Internal Market, 2006 (p. 28, 31). ↑
- Gambardella, A., Giuri, P. and Mariani, M., Study on evaluating the knowledge economy: what are patents actually worth? The value of patents for today’s economy and society. Project ETD/2004/IM/E3/77 for DG Internal Market, 2006 (p. 28, 31). ↑
- European Commission, Commission staff working document — A rationale for action accompanying the Europe 2020 Flagship Initiative Innovation Union. SEC(2010) 1161 final Brussels, 2010 (p. 6). ↑
- European Commission, 2013. Innovation Union Scoreboard 2013. Belgium, 2013 (p. 64). ↑

