- Data from October 2013. Most recent data: Further Eurostat information, Database.
This article provides an overview of statistical data on sustainable development in the areas of climate change and energy. They are based on the set of sustainable development indicators the European Union (EU) agreed upon for monitoring its sustainable development strategy.
Together with similar indicators for other areas, they make up the report 'Sustainable development in the European Union - 2013 monitoring report of the EU sustainable development strategy', which Eurostat draws up every two years to provide an objective statistical picture of progress towards the goals and objectives set by the EU sustainable development strategy and which underpins the European Commission’s report on its implementation. A synthetic overview of all indicators can be found in Sustainable development - executive summary .
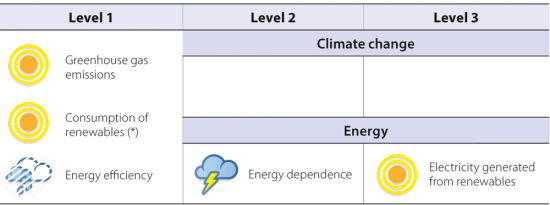
The table below summarises the state of affairs of in the area of climate change and energy. Quantitative rules applied consistently across indicators, and visualised through weather symbols, provide a relative assessment of whether Europe is moving in the right direction, and at a sufficient pace, given the objectives and targets defined in the strategy.
<<
>>
Overview of main changes
At first glance, the EU has made substantial progress towards achieving its energy and climate objectives. Greenhouse gas (GHG) emissions and primary energy demand are approaching the 2020 targets. However, an analysis of the driving forces behind these positive trends leads to a more cautious assessment. The lowered industrial production, transport volumes and energy demand during the economic crisis and its aftermath caused a strong drop in energy consumption and GHG emissions between 2007 and 2011 (with the exception of an increase in emissions from 2009 to 2010). A mild winter in 2010/2011 further pushed down energy demand. The most recent reductions are thus at least in parts linked to low economic performance, rather than reflecting a thorough transformation of the EU energy sector. By contrast, the fast expansion of renewable energies is a clearly favourable trend, particularly in the electricity sector.
Main statistical findings
Headline indicators
Greenhouse gas emissions
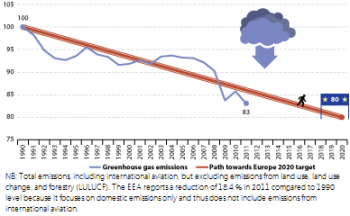
17 % less greenhouse gases (GHGs) have been emitted in 2011 compared to 1990 in the EU. At the current rate of reduction, the EU will overachieve its 2020 target to reduce GHG emissions by 20 %
In 2011, greenhouse gas emissions of the EU-27, accounting for the total emissions of the six man-made gases of the Kyoto basket, were down by 17 % compared to 1990. In absolute terms, the EU cut its emissions by 958 million tonnes of CO2 equivalent between 1990 and 2011.
This figure includes international aviation. Without it, the reduction is 18.4 %, as reported by the European Environment Agency (EEA) [1][2].
Despite this positive trend, the average annual emission reductions between 2000 and 2011 are not sufficient to put the EU on a pathway to meeting its long-term commitment [3] to reduce greenhouse gas emissions by 80-95 % by 2050 compared with 1990 levels.
A large portion of the achieved emission reduction occurred during the early 1990s as a result of economic restructuring in Eastern Europe. In this period, the region experienced a shift from heavy manufacturing industries to more service-based economies. The relatively low emissions reductions achieved between 2000 and 2008 were partly driven by a fuel switch in power generation from coal to natural gas and, to a minor extent, renewable energies. Significant reductions were also made in the waste sector through waste treatment processes with a lower carbon footprint. In the agricultural sector, declining numbers of livestock and less nitrogenous fertilisers helped to cut emissions [4].
- Sharp drop in emissions between 2008 and 2011 can be linked to the economic crisis and mild winter weather
Between 2008 and 2011, GHG emissions dropped sharply. In 2009 alone emissions went down by 7 % compared with the previous year, the largest annual reduction in any one year since reporting began in 1990. The main driving force was the economic crisis. This reduced industrial activity, transport volumes and, as a consequence, energy consumption and emissions. After a rebound in 2010, emissions fell again in 2011. The 3.1 % drop compared to 2010 to a large extent can be explained by mild winter weather in Northern and Western Europe, leading households to use less energy for heating. A higher renewable energy share and lower energy demand due to higher energy prices may also have contributed to emission reductions in some Member States [5].
- The EU-15 have overachieved their Kyoto target
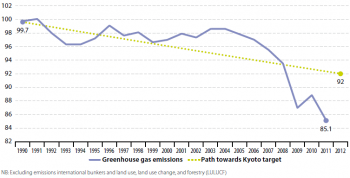
Under the Kyoto Protocol, the EU-15 committed to cut their combined GHG emissions (without international aviation) by 8 % compared to 1990 levels. This reduction was to be achieved by 2008-2012. In 2011, GHG emissions of the EU-15 were 14.6 % below the base year. The country group thus successfully fulfilled its international commitment ahead of schedule.
- How greenhouse gas emissions vary between Member States
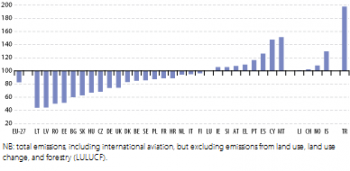
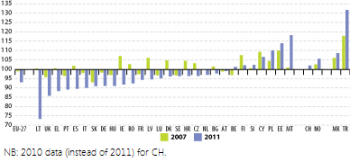
A wide majority of Member States has reduced national GHG emissions between 1990 and 2011. Reductions are highest in Eastern European countries, with Lithuania and Latvia leading with cuts of more than 50 %. By contrast, emissions increased in nine Member States as well as in Liechtenstein, Switzerland, Norway, Iceland and Turkey.
- The EU is on track to achieve its target for the non-ETS sectors
According to the EEA, the EU is making good progress in reducing emissions in sectors not covered under the European Emissions Trading Scheme (EU ETS). Collectively, the EU is on track to achieving its 2020 target of – 9.4 % agreed in the Effort Sharing Decision (ESD). Progress does however vary between Member States. With the exception of Estonia and Luxembourg all countries emitted less than their 2013 interim target in 2012 based on provisional data. But while 14 countries are projected to achieve their 2020 target with existing measures, the other 14 Member States may need to implement additional measures or use flexibility mechanisms to achieve their target [6].
- Emissions went down in all sectors between 2000 and 2011 with one exception
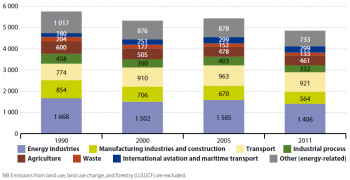
Of all economic sectors, the manufacturing industries and construction achieved the largest reduction in greenhouse gas emissions between 2000 and 2011. Emissions went down by 142 million tonnes of CO2 equivalent, equalling a reduction of 20 %. The second largest reduction of 96 million tonnes of CO2 equivalent or 6 % was achieved in the energy industries, the sector responsible for the largest share of total emissions.
- Transport was the exception from the general emissions fall
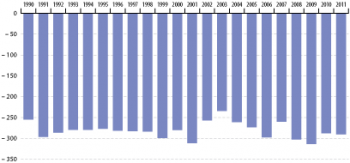
In contrast, transport emissions were 10 million tonnes above 2000 levels in 2011, an increase of 1.1 %. The sector accounted for 20 % of total EU emissions in 2011, making it the second largest source after the energy industries. Despite the slight increase compared to 2000 levels, the continual upward trend in transport emissions appears to have been broken. After reaching a peak in 2007, emissions went down by 6 % over the following four years. Both the increase between 2000 and 2007 [7] as well as the recent decline [8] can be linked to corresponding changes in the volume of passenger and freight transport. Causes for the shrinking transport volumes since 2007 may include the economic downturn as well as a hike in fuel prices. In spite of this positive trend, increasing the share of renewable energy and making the transport sector more energy efficient remains crucial to limit the sector’s contribution to greenhouse gas emissions, particularly when economic growth picks up again.
- Emissions from international bunkers growing fastest
International aviation and maritime transport is the fastest growing source category. Despite a drop during the economic crisis, emissions went up by 19.3 % between 2000 and 2011. Compared to 1990, emissions have increased by 66 % and now amount to 299 million tonnes of CO2 equivalent, 6.6 % of total emissions.
- Forest management removed CO2 emissions from the atmosphere between 1990 and 2011
Land use, land use change and forestry (LULUCF) practices can lead to additional greenhouse gas emissions, for example when forests are converted to farmland. In the EU, however, the net effect of LULUCF has been positive between 1990 and 2011. This means that newly planted forests and improved management of existing forests helped to remove GHG emissions from the atmosphere.
- EU trends in CO2 emissions compared with other countries in the world
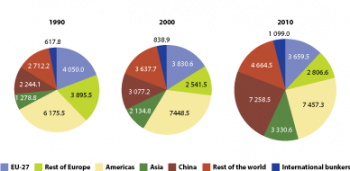
While emissions in the EU have fallen since 1990, global emissions of CO2, the most important greenhouse gas [9], are going up. Between 1990 and 2010, they rose by 44 %. Most of the increase has taken place in emerging economies. Both in relative and in absolute terms, emission growth was strongest in China. The country’s annual CO2 emissions more than tripled between 1990 and 2010. However, per-capita emissions in China still remained 28 % below EU levels in 2010. Although less important in absolute terms, emissions in the rest of Asia and the rest of the world have also grown significantly in relative terms between 1990 and 2010 (160 % and 72 % respectively). As a result of these trends, the EU’s share of global emissions has been shrinking, from almost a fifth in 1990 to 12.1 % in 2010.
- All years between 2001 and 2012 were among the warmest years since records began
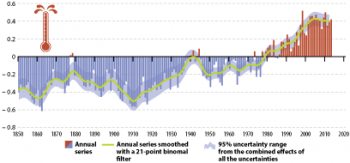
Man-made GHG emissions have increased the concentration of greenhouse gases in the atmosphere which in turn has led to a rise in surface temperature. Recordings of the combined global land and marine surface temperature show a clear upward trend. According to the most recent IPCC report, it increased by 0.85 °C between 1880 and 2012 [10]. The year 2012 was the ninth warmest year on record and all years between 2001 and 2012 were among the top 13 warmest [11].
In Europe and globally, the rise in temperature has already led to observable changes in the natural systems and society. Ice sheets in Greenland and Antarctic, the Arctic sea ice and mountain glaciers are shrinking at increasing speed while the sea level rises at a faster rate [12]. Damage costs from natural disasters have increased and are likely to rise more in the future. Impacts are likely to be spread unevenly across Europe. They threaten to hit regions hardest which already face low economic growth or demographic change [13].
Consumption of renewables
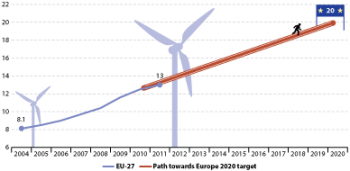
4.9 percentage points increase in the share of renewables in gross final energy consumption in the EU between 2004 and 2011. This favourable trend has put the EU on track to reach its 2020 target
Between 2004 and 2011, the share of renewable energy had been continuously increasing, reaching a share of 13 % in gross final energy consumption in 2011
There are two main drivers for this increase: support schemes for renewable energy technology and shrinking costs. As a result of policies such as feed-in tariffs, grants, tax credits and quota systems, installed capacity for renewable electricity and heat generation as well as the use of renewable transport fuels has grown steadily over the past decade.
The EU is now the world’s biggest renewable energy investor. The scaling up of global production volumes and technological advances have allowed producers to substantially cut costs per unit. Photovoltaic modules have experienced the biggest plunge, with prices falling by 76 % between 2008 and 2012. Onshore wind turbines became 25 % cheaper during the same time period [14]. Wind and solar installations have started to be economically viable without subsidies, where conditions are favourable.
- How consumption of renewables varies between Member States
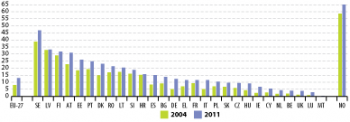
Among Member States the share of renewable energy in gross final energy consumption ranged in 2011 from 46.8 % in Sweden to 0.4 % in Malta. Differences stem from variations in the endowment with natural resources, mostly in the potential for building hydropower plants and in the availability of biomass. All Member States increased their renewable energy share between 2005 and 2011. Eight countries doubled their share, albeit all of them from a small base. Sweden and Bulgaria are the two Member States closest to reaching their target in 2011, closely followed by Romania, Lithuania and Norway. Farthest away from their targets are the UK and France.
- In the transport sector, the positive trend towards more renewable energy use has not continued
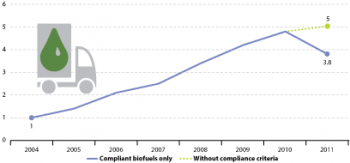
While the final energy consumption in the EU transport sector has remained stable since 2004, the share of renewable energy in transport grew steadily from 1 % to about 4.8 % between 2004 and 2010. Nonetheless, the EU failed to reach its interim target of 5.75 % for 2010. In 2011, the share of renewable energy in EU transport went down by about a fifth to 3.8 %. However, this sudden drop reflects statistical adjustments due to the fact that not all Member States have fully transposed the sustainability criteria for liquid biomass laid down in the Renewable Energy Directive, and the fact that Directive 2009/28/EC prescribes that only compliant (sustainable) biofuels can be counted towards the target. If biofuels from countries without full implementation are included, the share of renewable energy in fuel consumption stood at 5 % in 2011.
The increase in renewable energy consumption in transport between 2004 and 2010 was mainly based on the use of biofuels, driven by the widespread introduction of support systems at national level. Member States use tax rebates or biofuel obligations to promote renewable energy consumption in road transport. Governments have also set national targets as required by the Directive on renewable energy in transport [15], some of which are above the minimum 10 % target required for 2020 [16].
Energy efficiency
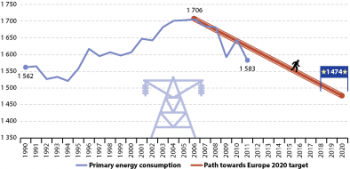
1.5 % less primary energy consumed in the EU in 2011 compared to 2000, but the trend is not continuous. The EU is moving towards the 2020 target of improving energy efficiency by 20 %, but sustained efforts are required
Primary energy consumption, the indicator used to assess progress towards the Europe 2020 strategy’s energy efficiency target, showed an upward trend between 1990 and 2006, but fell sharply in 2009 following the economic crisis. It rose again in 2010 with the slight recovery of the EU’s economy, but fell again in the next year. In 2011, the EU consumed roughly as much primary energy as it did in 1990 and 7 % less than in 2005, the base year of the EU’s headline target to increase energy efficiency by 20 %. In absolute terms, the efficiency target means that by 2020, EU primary energy consumption should be reduced from the projected consumption of 1 842 Mtoe in the reference scenario to 1 474 Mtoe [17]. If the average annual rate of reduction observed between 2006 and 2011 can be maintained in the future, the EU will achieve its energy efficiency target in 2020.
- Reduction in primary energy demand linked to low economic performance
However, it is important to note that the recently achieved reduction in primary energy consumption is only partly due to efficiency improvements. The original projections of 2007 assumed that GDP would grow steadily after 2007. Since GDP growth is one of the key drivers of energy consumption, the low economic performance in the EU partly explains the observed reduction. Structural changes and fuel switches also contributed to lower primary energy consumption [18] . Finally, with respect to the most recent drop of 3.7 % between 2010 and 2011, a mild winter resulting in lower heating demand also played a role [19]. The analysis underlines the need to further pursue energy efficiency measures so as to ensure that primary energy consumption will decrease further when growth accelerates again [20].
- How energy efficiency varies between Member States
Twenty-one out of the 28 Member States reduced primary energy consumption between 2005 and 2011 by values ranging from 1 % to 27 %. In absolute terms, Germany, France, Spain, Italy and the UK achieved the highest reductions [21]. In the other seven Member States, primary energy consumption has gone up 1 % to 18 % since 2005, stressing the importance of additional efforts to improve energy efficiency.
All Member States except Estonia and Malta lowered primary energy intensity between 2005 and 2011. This means countries are producing more GDP with every unit of primary energy they consume. Collectively, the EU has lowered primary energy by 30 % between 1990 and 2011 [22].
- Reductions in energy consumption have been highest in the industrial sector
Between 1990 and 2011, the agriculture and forestry sector as well as industry reduced final energy consumption by 27.7 % and 21.7 % respectively. In absolute terms, the reduction in the industry sector of 79 million tonnes of oil (Mtoe) to 287 Mtoe in 2011 is the largest. In contrast, energy consumption in the services and transport sectors went up by about a third over the same time period. In 2011, the transport sector consumed 364 Mtoe and the service sector 140 Mtoe.
These changes reflect sector-specific levels of energy efficiency improvement, but also relate to structural changes in the EU economy, particularly a shift away from an energy-intensive industry to a service-based economy. In the case of transport, rising volumes of freight and passenger transport have outweighed efficiency gains. Except for annual fluctuations due to weather changes, the residential sector’s consumption remained more or less stable between 1990 and 2011.
Despite recent progress in reducing energy consumption, substantial cost-efficient potential for improvements in energy efficiency remain. A case in point is the refurbishment of residential and commercial buildings. Other areas include transport, green procurement in the public sector, and savings along the energy supply chain from extraction to distribution.
- Progress in expanding combined heat and power remains slow
The share of combined heat and power (CHP) in gross electricity generation in the EU reached 11.7 % in 2010, up from 10.5 % in 2004. Even though the data need to be treated with caution due to changes in calculation methods over time, it is notable that progress in expanding CHP technology is relatively slow, reflecting various economic and administrative barriers still facing cogeneration investments.
Energy dependence
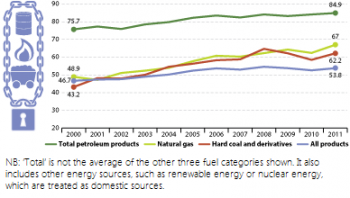
Net energy imports into the EU increased by 15 % between 2000 and 2011. However, the upward trend levelled off in 2006 due to lower energy demand in the EU
The share of total energy needs provided by imports from non-EU countries increased significantly over the past two decades, reaching 53.8 % in 2011. Fossil fuels make up the largest share of total energy imports. Between 2000 and 2011 the level of dependence was highest for petroleum products, but increased most for natural gas followed by hard coal.
- Lower EU oil and gas production and higher demand increase energy dependence
The rise in energy imports is driven by the decline of oil and gas production within the EU, mainly in the North Sea. Until 2006, higher overall primary energy demand was an additional cause for rising imports. The reversal of this upward trend since the onset of the economic crisis (see indicator ‘Primary energy demand’) has also stopped the share of imports in total energy consumption from rising further. The increase in renewable energy consumption might have also played a role (see indicator ‘Consumption of renewables’).
Electricity generation from renewables
About a fifth of EU gross electricity generation came from renewable sources in 2011, up from 13.6 % in 2000. Effective support schemes and lower production costs have enabled the expansion
The share of gross electricity from renewable sources went up by 50 % between 2000 and 2011, almost four times as fast than during the 1990s. With a share of renewables of 20.4 % in 2011, the electricity sector contributes to reaching the renewable energy target (see ‘consumption of renewables’ indicator)[23]. National promotion policies such as feed-in tariffs, grants, tax credits and quota systems have enabled this expansion.
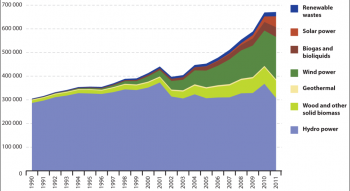
- Hydro power delivers the largest share of all renewable electricity, but wind and solar are growing fastest
Hydro power delivered slightly less than half of all renewable electricity (45.8 %), wind power a bit more than a quarter (26.7%). The remaining quarter is provided from biomass and biogas (17 %), solar energy (6.9 %), renewable wastes (2.7 %) and a small contribution comes from geothermal energy (0.9 %). Wind and particularly solar energy have grown fastest since 2005. The scaling up of global production volumes and technological advances have allowed producers to substantially cut costs. As a result, wind and solar installations start to be economically viable without subsidies, where weather conditions are favourable.
See also
- All articles on sustainable development indicators
- Greenhouse gas emission statistics
- Energy production and imports
Further Eurostat information
Publications
- Driving forces behind EU-27 greenhouse gas emissions over the decade 1999-2008 - Statistics in focus 10/2011
- Energy, transport and environment indicators - Pocketbook, 2011
- Renewable Energy Statistics - Statistics in focus 56/2010
- Sustainable development in the European Union - 2011 monitoring report of the EU sustainable development strategy
Database
[http://epp.eurostat.ec.europa.eu/portal/page/portal/sdi/indicators Sustainable development indicators, see: Climate Change and Energy
Dedicated section
Methodology
- More detailed information on climate change and energy indicators, such as indicator relevance, definitions, methodological notes, background and potential linkages, can be found on page 215-246 of the publication Sustainable development in the European Union - 2011 monitoring report of the EU sustainable development strategy.
Other information
- Analysis of options to move beyond 20% greenhouse gas emission reductions and assessing the risk of carbon leakage - Commission communication COM(2010) 265
- A Roadmap for moving to a competitive low carbon economy in 2050 - Commission communication COM(2011) 112
- White paper - Adapting to climate change : towards a European framework for action - Commission communication COM(2009) 147
External links
- Annual European Union greenhouse gas inventory 1990-2009 and inventory report 2011 - European Enviroment Agency
- CLIMATE-ADAPT - European Climate Adaptation Programme
- Climate Change 2007: Synthesis Report - Intergovernmental Panel on Climate Change, 2007
- Climate change: Global Risks, Challenges and Decisions, Synthesis Report from the Scientific Congress in Copenhagen, 2009
- European Environment Agency - EEA
- New climate science 2006-2009 - The Commission on Sustainable Development
- Scientific Perspectives after Copenhagen - Belgian Presidency of the Council of the EU, 2010
- World Energy Outlook 2010 - International Energy Agency
Notes
- Annual greenhouse gas inventory 1990–2011 and inventory report 2013, EEA Report No. 8/2013. Copenhagen 2013 (p. 6) ↑
- According to the latest EEA progress report, GHG emissions in the EU-28 fell by an additional 1 % between 2011 and 2012, to – 18 % (including international aviation). Based on these provisional data, EU-28 emissions were thus close to the Europe 2020 target of reducing GHG emissions by 20 % by 2020, eight years ahead of schedule. The EEA projects that are based on existing policy measures GHG emissions of the EU-28 will go down to 21 % by 2020. With additional policies and measures currently planned by Member States, emissions reduction could even reach 24 % in 2020 (see European Environment Agency, Trends and projections in Europe 2013. Tracking progress towards Europe’s climate and energy targets until 2020, EEA Report No 10/2013, Copenhagen, 2013 (p. 94)). ↑
- Council of the European Union. Council Conclusions on EU Position for the Copenhagen Climate Conference (7–18 December 2009), Brussels, European Union, 2009 (p. 2). ↑
- Driving forces behind EU-27 greenhouse gas emissions over the decade 1999-2008 - Statistics in focus 10/2011, p. 2 ↑
- European Environment Agency, Why did greenhouse gas emissions decrease in the EU in 2011?, Copenhagen, 2012. ↑
- European Environment Agency, Trends and projections in Europe 2013. Tracking progress towards Europe’s climate and energy targets until 2020, EEA Report No 10/2013, Copenhagen, 2013 (p. 111–112). ↑
- Driving forces behind EU-27 greenhouse gas emissions over the decade 1999-2008 - Statistics in focus 10/2011, p. 5 ↑
- EEA, Annual greenhouse gas inventory 1990–2011 and inventory report 2013, EEA Report No. 8/2013. Copenhagen 2013 (p. 9). ↑
- Working Group I Contribution to the IPCC Fifth Assessment Report Climate Change 2013, The Physical Science Basis Summary for Policymakers, Intergovernmental Panel on Climate Change, 2013, fig. SPM-5. ↑
- Working Group I Contribution to the IPCC Fifth Assessment Report Climate Change 2013, The Physical Science Basis Summary for Policymakers, Intergovernmental Panel on Climate Change, 2013, p. SPM-3. ↑
- World Meteorological Organization, WMO statement on the status of the global climate in 2012, WMO, No 1108, Geneva, 2013, p. 6. ↑
- Working Group I Contribution to the IPCC Fifth Assessment Report Climate Change 2013: The Physical Science Basis Summary for Policymakers, Intergovernmental Panel on Climate Change, 2013, p. SPM-5-6. ↑
- European Environment Agency, Climate change, impacts and vulnerability in Europe 2012, Copenhagen, 2012. ↑
- McCrone, Angus et al, Global Trends in Renewable Energy Investment 2012, Frankfurt School of Finance and Management, commissioned by UNEP’s Division of Technology, Industry and Economics (DTIE) and endorsed by REN21, Frankfurt, 2012 (p. 32). ↑
- Directive 2003/30/EC on the promotion of the use of biofuels or other renewable fuels for transport. ↑
- Geeraerts, K. et. al. National Legislation and national initiatives and programmes (since 2005) on topics related to climate change. European Parliament’s Temporary Committee on Climate Change. 2007 (p. 41). ↑
- Directive 2012/27/EU on energy efficiency, amending Directives 2009/125/EC and 2010/30/EU and repealing Directives 2004/8/EC and 2006/32/EC. ↑
- European Environment Agency, Trends and projections in Europe 2013. Tracking progress towards Europe’s climate and energy targets until 2020, EEA Report No 10/2013, Copenhagen, 2013 (p. 128). ↑
- European Environment Agency, Why did greenhouse gas emissions decrease in the EU in 2011?, Copenhagen, 2012. ↑
- Eurostat, Energy saving statistics explained (accessed 20 November 2013); European Environment Agency, Trends and projections in Europe 2013. Tracking progress towards Europe’s climate and energy targets until 2020, EEA Report No 10/2013, Copenhagen, 2013 (p. 128). ↑
- European Environment Agency, Trends and projections in Europe 2013. Tracking progress towards Europe’s climate and energy targets until 2020, EEA Report No 10/2013, Copenhagen, 2013 (p. 128). ↑
- European Environment Agency, Trends and projections in Europe 2013. Tracking progress towards Europe’s climate and energy targets until 2020, EEA Report No 10/2013, Copenhagen, 2013 (p. 130, 132). ↑
- Ecofys et al., Renewable energy progress and biofuels sustainability, London, 2012 (p. 38). ↑

