- Data from Month July 2014.
This article presents selected results from the EU Labour Force Survey and the 2012 ad-hoc module on the transition from work to retirement for the EU28 and for all Member States, as well as for three EFTA countries. The data explain the transition from work to retirement, regarding types of pensions, age to start receiving a pension, early retirement, people who continue working after starting to receive a pension and reasons for it, etc.
Main statistical findings
- The transition from work into retirement takes place mostly between ages 50 and 69 and affects around 80 % of the population. The remaining 20 % of the population does not undergo this process, or not in the same way, because they were not employed in the first place and/or they do not see themselves as becoming "retired".
- The employment rate of population aged 50-69 is 48.8 % in the EU28 in 2012, i.e. lower than for prime age workers. Instead part-time work increases (to 21.8 % of employed population) as older workers prepare to retire. Based on the evolution of employment rates of older workers, men and women withdraw from employment at the same pace in most countries although important country differences exist.
- 35.1 % of people aged 50-69 in the EU28 received a pension in 2012, 87.4 % of them received an old-age pension, i.e. resulting from building up entitlements during the working life. Other, less frequent types of pensions exist too.
- Being retired (i.e. self-reported status) and receiving an old-age pension are not the same thing but both provide a consistent picture. Starting to receive an old-age pension is the main driver for employed people to stop working and to consider themselves as retired.
- However, 15.9 % of EU28 old-age pensioners continue working. 62.8 % of them continue working mainly for financial reasons, whereas 37.2 % mainly do it for non-financial reasons e.g. job satisfaction.
- 40.9 % of old-age pensioners used an early retirement scheme. They anticipated their retirement by 1.3 years, on average.
All the data used in this article are based on the EU Labour Force Survey (EU LFS). Data for the year 2012 are used because that year the EU LFS had an additional set of variables, so-called ad-hoc module, about retirement and pensions.
Transition from work into retirement
Source: Eurostat (lfsa_eppga)
Retiring is the process by which people withdraw from employment for reasons of age. This process is quite complex: it does not happen at the same age for everybody nor in the same circumstances (it may or may not be voluntary, etc.). Actually, it does not happen at all for many people. This article explores some of those aspects.
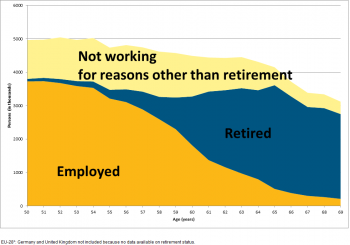
The share of population employed diminishes considerably between ages 55 and 64 (see Figure 1. See the International Labour Organisation (ILO)'s employment definition at the bottom of the article). This article will extend the study group to people aged 50 to 69 in order to provide a more comprehensive picture. Between 50 and 69 years of age, the share of employed population shrinks from 75 % to 7 %. This decrease is largely but not fully compensated by an increased share of people retired (the concept of "retirement" used here is the self-perceived status. EU LFS respondents choose among a list of mutually exclusive categories including: employed, unemployed, retired, fulfilling domestic tasks, permanently disabled, student, etc.)
Whereas most people aged 50-69 undergo this transition from employment to retirement, about 20 % of the population do not (see top coloured stripe in Figure 1). They fall in a range of situations: most of them are women fulfilling domestic tasks, people permanently disabled, unemployed persons, people out of the labour force for other reasons e.g. no need of labour income to make a living, etc. This group does not change status with the same intensity and at the same age as those passing from employment to retirement. The group does change with age, in particular it gets smaller when people stop seeing themselves (and correspondingly reporting to the EU LFS) as fulfilling domestic tasks or being disabled and start seeing themselves as retired. National cultural factors determine when people's attitude change in this respect. In some countries, people in this group consistently change their attitude when they reach a certain age, typically 65, like in France or Hungary, whereas in other countries they never report they are retired, like in Italy or Spain.
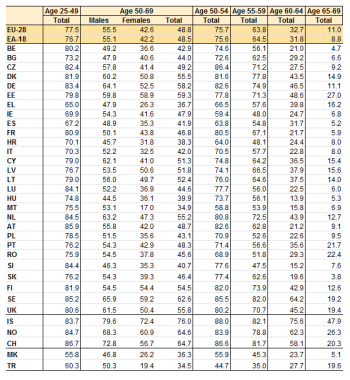
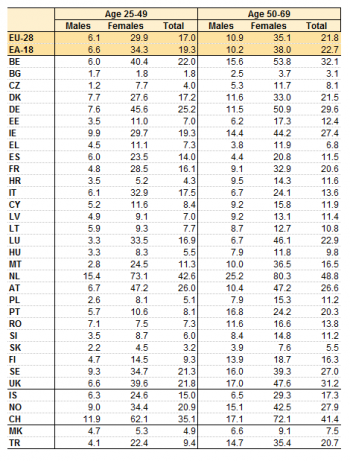
The transition out of employment shown in Figure 1 takes place at different ages in each country. This can be seen in the employment rates of the population aged 50-69, reported in Table 1. This table also shows the employment rates for people aged 25-49, taken here as prime working age for comparison purposes. In the EU28 in 2012, 48.8 % of the peopled aged 50-69 are employed. This rate has steadily increased during the last decade, in spite of the economic crisis. Some EU Member States have employment rates much higher than the average, foremost Sweden (62.6 %), Estonia (59.3 %) and Germany (58.2 %). Other European countries have even higher values: Iceland (76.0 %), Switzerland (64.7 %) and Norway (64.6 %). The employment rate 50-69 is lowest in Greece (36.7 %), Croatia (38.2 %) and Hungary (39.9 %). The employment rate for the population aged 50-69 is lower than for the population aged 25-49 in every country, the gap being 28.6 percentage points in the EU28 in 2012. This gap ranges between 43.6 p.p. in Slovenia and 7.7 p.p. in Iceland.
Unsurprisingly, the employment rates of women are lower than those of men in the same age group. In the EU28, 42.6 % of women aged 50-69 are employed, compared to 55.5 % of men, i.e. a gender gap of 12.8 p.p. This gender gap is largest in Malta (36.1 p.p.), Greece (21.6 p.p.) and Cyprus (21.1 p.p.) and smallest in Finland (0.1 p.p.), Estonia (0.9 p.p.) and Latvia (2.9 p.p.). Looking at each country, the gender gap is generally similar for people aged 50-69 and aged 25-49, except in a few countries. This indicates that, broadly speaking, the employment gender gap does not change as people get older and they move into retirement.
Many people work part-time as an interim step before retirement. The share of employed persons aged 50-69 and working part-time in the EU28 in 2012 was 21.8 %, up from 17.0 % for people aged 25-49. This increase of part-time work regards both men and women: the share of men working part time raises from 6.1 % at the age 25-49 to 10.9 % at age 50-69; women pass from 29.9 % to 35.1 %. In percentage points this increase is bigger for women. However, in relative terms it is larger for men because they start from a lower baseline share of part-time employment at ages 25-49. In this sense, the growth of part-time work between the age groups 25-49 and 50-69 is 79 % for men compared to 17 % for women.
There are important country differences in this regard too. In Portugal the share of part-time workers increases by 12.2 p.p., passing from 8.1 % at age 24-49 to 20.3 % at age 50-69. Belgium reports an increase of part-time work by 10.1 p.p. and United Kingdom by 9.4 p.p. In comparison the share of part-time work actually decreases in Italy (by 3.8 p.p.) passing from 17.5 % to 13.6 %. Spain and Greece are the only other countries which report a decrease.
In some countries the increase of part-time work is very different for men and women. For instance in Finland it's mostly the men who move into part-time work as they get older, passing from a 4.7 % share at age 25-49 to 13.9 % at age 50-69. In Ireland it's mostly the women, passing from a 29.7 % share at age 25-49 to 44.2 % at age 50-69.
Pensions

Source: Eurostat (lfso_12agepens)
When people retire they frequently start receiving a pension. This approach to measure retirement is different from the self-perceived status used in Graph 1, having the advantage of being more objective. This pension aspect is studied in the Labour Force Survey with special set of additional variables from the ad-hoc module 2012.
Different types of pensions exist, not all of them related to retirement, so it is important to distinguish between them. The LFS ad-hoc module 2012 discriminates between old-age pensions and other types of pensions (disability pensions, survivors-pensions or early retirement benefits). Only old-age pensions are related to retirement from employment (see definitions at the bottom of the article). People can receive simultaneously several pensions, even pensions of several types.
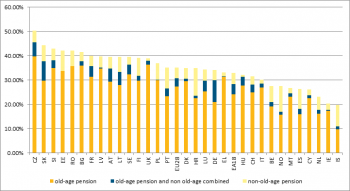
35.1 % of people aged 50-69 in the EU-28 received a pension in 2012 (see Figure 2) [1]. This figure does not encompass all sources of income nor social coverage of older population, as it does not include benefits different from pensions (like unemployment benefits, medical care and care allowances specific to disability or old-age, benefits during temporary incapacity to work due to sickness or injury, family allowances, long term savings and life insurance contracts not specifically for pension purpose) nor pensions received by persons outside the target group1. Because of the relative importance of those sources of income across countries, country differences in Graph 2 must be taken with caution.
Out of the types of pension showed in Graph 2, old-age pensions are the most frequent ones, as 29.4 % of people aged 50-69 in the EU28 receive exclusively old-age pensions, whereas 3.3 % more combine an old-age pension with another type of pension. In countries such as Greece and the United Kingdom, most pensioners receive solely old-age pensions, whereas in Germany and Slovakia, for instance, there are more people who also receive another type of pension.
Now we will focus only on the old-age pensions, because they are the pension entitlements built up during the working life and are aimed to maintain the beneficiary's income after retirement from employment.
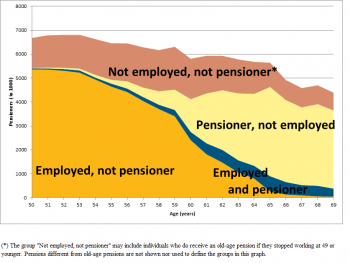
The share of population receiving an old-age pension increases with age as the employed population shrinks (see Figure 3). Figure 3 provides a picture consistent with Figure 1 but there are some notable differences. First, there is an overlap between employment status and reception of an old-age pension (group labelled "employed and pensioner"). This overlap did not exist with the self-perceived retirement measurement approach in Figure 1. It means there is a group of people who continue working after they start receiving their old-age pension. They are 15.9 % of old-age pensioners in the EU28 in 2012. The size and reasons for this phenomenon depend on the country and are analysed in the next section of this article.
Secondly, the border between the groups labelled "pensioner, not employed" and "not employed, not pensioner" is measured more objectively because it is not exposed to subjective assessment of whether oneself is retired, disabled, fulfilling domestic tasks, etc. Because of it, the flows between these groups in particular at ages 60-65 do not occur like in Graph 1.
Figure 1 and 3 confirm that starting to receive an old-age pension is the main driver for employed people to stop working and to start considering themselves as retired.
The age at which people start to receive their old-age pension varies among countries. The EU28 average is 59 years of age. On average, the span ranges from 57 years of age to 65 (see Map 1. Note that Map 1 reports the age at which the respondents first started to receive their old-age pension whereas the age reported in Figure 3 is their present age). There is no obvious geographical pattern, but south eastern countries have generally a lower pension age than the others. There is a relation between Map 1 and Table 1 as countries with lower age to start receiving old-age pensions tend to be those with lower employment rate for people aged 50-69.
Pensions and work
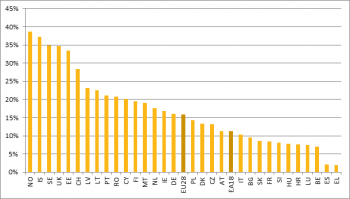
As shown in Figure 3, a number of people continue working after they start receiving a pension. On average in the EU28, they are 15.9 % of the people aged 50-69 receiving an old-age pension. They may be working for only a few hours (see ILO employment definition at the bottom of the article).
This share is very different across countries. The highest values are reported in Norway (38.7 %), Iceland (37.2 %) and Sweden (34.9 %). These are also among the countries with highest employment rates 50-69 (see Table 1). The lowest shares are reported in Greece (1.9 %), Spain (2.1 %) and Belgium (7.0 %), countries also having low employment rates 50-69. Old-age pensioners who continue working are more common in northern Europe than in the south, though there are exceptions, such as Portugal and Romania.
There are two main types of reasons why people continue working after receiving a pension: financial reasons and non-financial reasons. The first group includes establishing or increasing future retirement pension entitlements, providing sufficient personal/household income, or a combination of both. The second group includes reasons like job satisfaction or motivation.
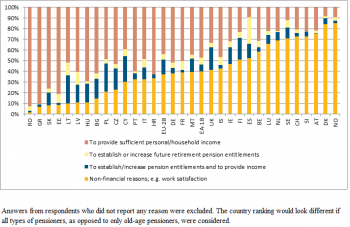
On average, in the EU28, 62.8 % of old-age pensioners who continue working do it mainly for financial reasons, whereas 37.2 % do it for non-financial reasons. Among the first group 43.8 % do it to provide sufficient personal or household income, 13.8 % to establish or increase future retirement pension entitlements, and 5.1 % a combination of both. Providing sufficient personal or household income is by far the most important financial reason.
Figure 5 shows a neat division of countries between these two types of reasons. More than 80 % of old-age pensioners who continue working in Norway and Denmark report they do so mainly for non-financial reasons e.g. job satisfaction. Instead, in Romania and Greece, the main reason for more than 80% of respondents is financial. There is a geographical pattern, with northern countries showing work satisfaction as one of the main reasons to go on working, while in central and eastern countries, this is not the case. Estonia and Germany are exceptions, as they combine high employment rates with preponderantly financial reasons to go on working, even while receiving a pension.
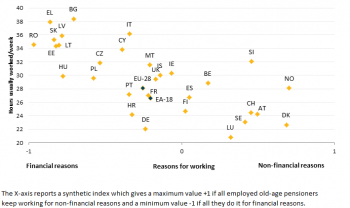
Another aspect is the work intensity of old-age pensioners who continue to work. There is a clear relation with the reasons to continue working: old-age pensioners who continue to work for financial reasons typically work longer hours than those who do it for non-financial reasons (see Figure 6). Employed old-age pensioners usually work 22 weekly hours in Denmark and 28 weekly hours in Norway, countries where non-financial reasons are predominant. In Greece and Romania, where financial reasons are prevalent, the number of usual hours worked is 38 and 34, respectively.
Early retirement
There are a number of policy measures targeted to facilitate early retirement for some groups of employed people, in particular those who have not reached retirement age yet or those who have not built up full retirement entitlements. Early retirement schemes take different forms, including anticipated old age pensions, disability pensions, early retirement pensions in case of reduced ability to work, early retirement pensions due labour market reasons, long career or long contribution period, family reasons, etc.
The ad-hoc module 2012 studied early retirement for people receiving old-age pensions. In the EU28, as many as 40.9 % of old-age pensioners benefitted from an early retirement scheme. In 22 EU Member States the share of old-pensioners receiving an early retirement is higher than 20 %. The highest shares are reported in Italy (73.9 %), Ireland (68.5 %) and Spain (59.9 %). The lowest shares are reported in Bulgaria (5.2 %), Czech Republic (5.3 %) and Estonia (10.9 %).
People in early retirement schemes may continue doing some work, even for a few hours: as many as 12.9 % of people in the EU28 early retirement continue to do some work. This share is 47.7 % in Norway, 42.9 % in Iceland and 36.4 % in the United Kingdom.
Besides, there is the question of the age at which people retire when they use early retirement schemes. On average in the EU28, persons aged 50-69 who are receiving an old-age pension and used an early retirement scheme reported to have 58.3 years at the time they retired. Those receiving an old-age pension who did not use an early retirement scheme had on average 59.6 years, i.e. 1.3 years of age later (see Figure 8).
This difference is indicative of how many years they anticipated their retirement because of the early retirement scheme. However this difference must be considered with care, as there may be other factors who explain it too. For instance, a statutory change of retirement entitlements would lead to a break in data comparability, e.g. if the legal change increases the retirement age, those in early retirement after the legal change could be older than those not retired early before the legal change. A big share of non-response to this survey question may also bias the results.
By countries this difference is biggest in Italy (4.7 years, namely the difference between retiring 61.5 years old and 56. 8 years old), Ireland (4.6 years, namely 64.1 vs. 59.5) and Spain (4.3 years, namely 64.3 vs. 60.1). See Figure 8. These countries are also among those having a higher percentage of early retirements in Figure 7.
Data sources and availability
Source: Ad-hoc module 2012 ‘Transition from work to retirement’ of the European Union Labour Force Survey (EU-LFS) and other EU-LFS data. The EU-LFS is a large sample, quarterly survey providing results for the population in private households in the EU, EFTA and the candidate countries.
Reference period: 2012.
Coverage: The data for France cover the metropolitan territory (excluding overseas regions)
Country codes: Belgium (BE), Bulgaria (BG), the Czech Republic (CZ), Denmark (DK), Germany (DE), Estonia (EE), Ireland (IE), Greece (EL), Spain (ES), France (FR), Croatia (HR), Italy (IT), Cyprus (CY), Latvia (LV), Lithuania (LT), Luxembourg (LU), Hungary (HU), Malta (MT), the Netherlands (NL), Austria (AT), Poland (PL), Portugal (PT), Romania (RO), Slovenia (SI), Slovakia (SK), Finland (FI), Sweden (SE), the United Kingdom (UK), Iceland (IS), Norway (NO), Switzerland (CH), the former Yugoslav Republic of Macedonia (MK), Turkey (TR). The abbreviation MK used for the former Yugoslav Republic of Macedonia is a provisional code which does not prejudice in any way the definitive nomenclature for this country, which will be agreed following the conclusion of negotiations currently taking place on this subject at the United Nations.
European aggregates: EU refers to the sum of EU-28 Member States and EA to the sum of the 18 euro area Member States. If data are unavailable for a country, the calculation of the corresponding aggregates takes into account the data for the same country for the most recent period available. Such cases are indicated.
Target population of the survey: The LFS ad-hoc module for 2012 includes those persons who live in private households, are aged 50 – 69 and who are either a) working at the time of the survey or b) not working at time of the survey but who did work after the age of 50.
Definitions:
Employment: The concepts and definitions used to determine the labour status of individuals in the EU-LFS follow the guidelines of the International Labour Organisation. Employed persons comprise persons aged 15 years and more who were in one of the following categories:
- (a) persons who during the reference week worked for at least one hour for pay or profit or family gain.
- (b) persons who were not at work during the reference week but had a job or business from which they were temporarily absent.
This definition is applicable to employees, self-employed persons and family workers. Pay includes cash payments or 'payment in kind'(payment in goods or services rather than money), whether payment was received in the week the work was done or not.
Full-time/part-time: This variable refers to the main job. The distinction between full-time and part-time work is based on a spontaneous response by the respondent (except in the Netherlands, Iceland and Norway were part-time is determined if the usual hours are fewer than 35 hours and full-time if the usual hours are 35 hours or more, and in Sweden where this criterion is applied to the self-employed).
Retirement: The retirement is based on each person’s self-perception regarding his/her activity status “retirement or early retirement or has given up business”. For the reference definitions, please consult the EU-LFS explanatory notes variable MAINSTAT.
Pension: The classification of a pension and the type of pension is based on each person’s self-perception regarding whether the type of benefit he or she receives is a pension. Only one general condition is required: the payment considered as pension has to be a regular and periodic benefit in cash -apart from salaries or wages- and including bank transfers, cheques and similar payments. The target definition includes pensions which are of any of the types: public or private, voluntary or mandatory, defined contribution or defined benefit. Afterwards the specific types of pensions are investigated: Old-age pension, unemployment pension, disability pension, survivor’s pension or other pensions. For the reference definitions, please consult explanatory notes and the mapping of pensions for the EU-LFS ad hoc module 2012.
For an overview of the EU-LFS concepts, classifications, questionnaires and other methodological issues, please see: EU Labour Force Survey – methodology (Statistics Explained) and for the ad hoc module 2012 “Transition from work to retirement”, please see: EU labour force survey - ad hoc modules (Statistics Explained).
Context
The EU-LFS is the largest European household sample survey providing quarterly and annual results on labour participation of people aged 15 and over as well as on persons outside the labour force. It covers residents in private households. The EU-LFS is an important source of information about the situation and trends in the EU labour market. Since 1999 the EU-LFS is supplemented every year with so called EU-LFS ad-hoc modules. There is a different ad-hoc module every year. The aim of the ad-hoc module is to provide users with statistics on a specific topic concerning the labour market by adding each year a set of variables to supplement the core EU-LFS. The ad-hoc module 2012 "transition from work to retirement" aimed at answering the following main questions:
- how people leave the labour market,
- why they left the labour market,
- why they did not stay longer and,
- how long the active population, aged 50 to 69, expects to be in the labour market.
The results of the ad-hoc module are intended for use in the framework of the Open Method of Coordination in the field of pensions, for the Joint Social Protection, Social Inclusion report, and in the framework of the Europe 2020 Strategy, in particular for the monitoring of the employment guideline on increasing labour market participation.
See also
Further Eurostat information
Publications
- Labour market statistics - Pocketbook - 2011 edition
- European Union Labour force survey - annual results 2013 (Statistics Explained)
Main tables
Database
Dedicated section
Methodology / Metadata
- EU Labour force survey
- EU Labour force survey - ad hoc moduloes
- Statistical working papers / Manuals and guidelines
Notes
- The target group for the ad-hoc module 2012 were the resident persons aged 50 to 69 years which were employed or unemployed until 50 years old. ↑
[[Category:<subtheme category name(s)>|Name of the statistical article]] [[Category:<statistical article>|Name of the statistical article]]

