Archive:Foreign direct investment between the European Union and BRIC
- Data from July 2014. Most recent data: Further Eurostat information, Main tables and Database. Planned article update: (dd) Month YYYY(, hh:00).
This article presents the foreign direct investment (FDI) between the European Union (EU) and the BRIC countries – Brazil, Russia, India and China (including Hong Kong)[1]

FDI flows
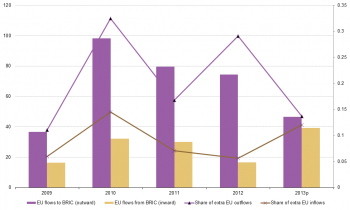
The preliminary figures for 2013 based on annualised quarterly balance of payments data for outward FDI flows to those countries show a slight decline from the previous year, and a 52.56 % decrease compared to the peak levels of 2010. (Figure 1) The respective share in total Extra-EU flows also dropped likewise.
As regard inward flows, both absolute and relative contribution of the BRIC countries to total extra EU FDI flows were less volatile during the studied period. They doubled in 2013 to minimise the gap in the bilateral FDI balance with the EU.
Figure 1 FDI flows between the EU and BRIC countries, 2009-2013p, EUR billion
Over the period 2009-2013, the main BRIC destination of EU FDI flows was Brazil (EUR 146 bn), followed by China and Hong Kong combined (EUR 106 bn).
Table 1 FDI flows from the EU to BRIC countries, 2009-2013p, EUR billion
Table 2 FDI flows from BRIC countries to the EU, 2009-2013p, EUR billion
In 2013, the main EU investor in Brazil and Russia was Luxembourg[2] , while Germany dominated the EU investment in India and China (including Hong Kong). France was among the top four EU investors in all BRIC countries. (Figures 2a, 2b, 2c and 2d)
Figure 2a Main EU investors in Brazil, FDI flows, 2013p
Figure 2a Main EU investors in Russia, FDI flows, 2013p
Figure 2a Main EU investors in India, FDI flows, 2013p
Figure 2a Main EU investors in China (incl. Hong Kong), FDI flows, 2013p
FDI stocks
The FDI stocks between the EU stocks and the BRIC countries doubled between 2008 and 2012 both directions. Similar to FDI flows, the EU is a net investor vis-à-vis those countries. (Figure 3)
Figure 3 FDI stocks between the EU and BRIC countries, 2009-2012, EUR billion
In 2012, 14 % of total outward stocks in extra EU were located in the BRIC countries. (Table 3) One third (EUR 251 bn) of these were positioned in China (incl. Hong Kong) and another third (EUR 247 bn) – in Brazil. The highest growth between 2008 and 2012 was recorded for India (135%).
Table 3 EU FDI stocks in BRIC countries, 2008-2012, EUR billion
In 2012, the BRIC countries held EUR 261 bn in the EU, Brazil being the main FDI holder with EUR 98 bn. (Table 4) The Russian FDI positions in the EU increased by 155% during the studied period.
Table 4 BRIC FDI stocks in the EU, 2008-2012, EUR billion
Table 5 shows the EU FDI stocks by main activity in BRIC countries over the period 2008-2011. Overall, the EU invested predominantly in the Service sectors. Exceptions were China (excluding Hong Kong) and India, where the Manufacturing sector held about 40% and 60%, respectively, of total EU FDI stocks in those economies at the end of 2011. The financial sector attracted more than half of the EU investments in Hong Kong and one third in Russia in 2011. The latter almost tripled from 2008.
The EU investments in Brazil were mainly held the Service sector, in particular in financial services and telecommunications. Mining (including extraction of petroleum and gas) and the related manufacturing activities were also an important location of the EU FDI stocks in that country.
Table 5 EU FDI stocks in BRIC countries by main activity, 2008-2011, EUR billion
See also
- Name of related Statistics Explained article
- Name of related online publication in Statistics Explained (online publication)
- Name of related Statistics in focus article in Statistics Explained
- Subtitle of Statistics in focus article=PDF main title - Statistics in focus x/YYYY
Further Eurostat information
Data visualisation
- Regional Statistics Illustrated - select statistical domain 'xxx' (= Agriculture, Economy, Education, Health, Information society, Labour market, Population, Science and technology, Tourism or Transport) (top right)
Publications
Publications in Statistics Explained (either online publications or Statistics in focus) should be in 'See also' above
Main tables
- Title(s) of second level folder (if any)
- Title(s) of third level folder (if any)
Database
- Title(s) of second level folder (if any)
- Title(s) of third level folder (if any)
Dedicated section
Methodology / Metadata
<link to ESMS file, methodological publications, survey manuals, etc.>
- Name of the destination ESMS metadata file (ESMS metadata file - ESMS code, e.g. bop_fats_esms)
- Title of the publication
Source data for tables, figures and maps (MS Excel)
Other information
<Regulations and other legal texts, communications from the Commission, administrative notes, Policy documents, …>
- Regulation 1737/2005 (generating url [http://eur-lex.europa.eu/LexUriServ/LexUriServ.do?uri=CELEX:32005R1737:EN:NOT Regulation 1737/2005]) of DD Month YYYY on ...
- Directive 2003/86/EC (generating url [http://eur-lex.europa.eu/LexUriServ/LexUriServ.do?uri=CELEX:32003L0086:EN:NOT Directive 2003/86/EC]) of DD Month YYYY on ...
- Commission Decision 2003/86/EC (generating url [http://eur-lex.europa.eu/LexUriServ/LexUriServ.do?uri=CELEX:32003D0086:EN:NOT Commission Decision 2003/86/EC]) of DD Month YYYY on ...
<For other documents such as Commission Proposals or Reports, see EUR-Lex search by natural number>
<For linking to database table, otherwise remove: {{{title}}} ({{{code}}})>
External links
Notes
[[Category:<Subtheme category name(s)>|Name of the statistical article]] [[Category:<Statistical article>|Name of the statistical article]]