Archive:Foreign direct investment between the European Union and BRIC
This Statistics Explained article has been archived - for recent articles on Foreign direct investment statistics see here.
- Data from September 2016. Most recent data: Further Eurostat information, Main tables and Database. Planned update: January 2018.
This article presents foreign direct investment (FDI) between the European Union (EU) and the BRIC countries – Brazil, Russia, India and China (including Hong Kong)[1]. The analysis covers the period 2010–14 for the EU-28; note that from 2013 onwards figures are based on new methodological standards — Balance of payments manual, 6th edition (BPM6), and Benchmark definition of FDI, 4th edition (BD4) — therefore, the statistics from 2013 onwards are not directly comparable with previous years.


Main statistical findings
Key points
Both EU inward flows (direct investments in EU Member States from BRIC countries) and outward flows (EU Member States’ direct investments in BRIC countries) fell sharply in 2014 and were at their lowest levels during the period 2010–14. These big falls were mainly due to lower EU investments in Brazil and China (including Hong Kong) as well as a fall in investments from Brazil, Russia and China in the EU. Main EU investors in BRIC countries were Netherlands, Italy, UK and Luxembourg.
FDI stocks increased steadily in 2014 and followed the trend from previous years. Brazil continued to be the main destination of EU stocks as well as the main holder of FDI stocks in the EU. Manufacturing and financial & insurance activities were the main sectors of EU investments in BRIC countries accounting for just above half of the total EU FDI stock in BRIC.
FDI flows
FDI flows declined sharply in 2014
EU Member States’ direct investments in BRIC countries (outward flows)
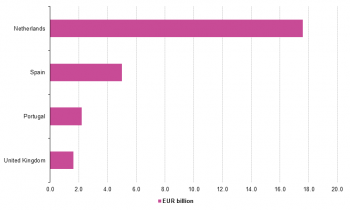
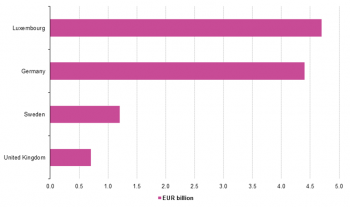
After having increased during the years 2011–13 the EU Member States’ direct investments in BRIC declined sharply in 2014 and were at their lowest level during the period 2010–14 (see Figure 1) [2]. Nevertheless the BRIC countries' percentage of total EU outflows increased to 52 %, thus the fall was not as significant as for other countries outside the EU (see Statistics Explained article Foreign direct investment statistics). This big fall was mainly due to lower EU investments in Brazil and China (including Hong Kong) – see Table 1. Over the period 2010-2014, the main BRIC destination of EU FDI flows was Brazil (EUR 179.7 bn), followed by China and Hong Kong combined (EUR 120.1 bn). In 2014, the main EU investor in Brazil was the Netherlands, in Russia was Italy, in India was the United Kingdom while in China Luxembourg had the largest investments. (see Figures 2a, 2b, 2c and 2d)
Direct investments in EU Member States from BRIC countries (inward flows)
Direct investments in the EU also fell in 2014, thus mirroring the development for outward flows. Again this was largely due to a fall in investments from Brazil, Russia and China in the EU (see Table 2). The main investor into the EU during the period 2010-2014 was China and Hong Kong (EUR 57.5 bn) followed by Brazil (EUR 44.2 bn).
FDI stocks
Continued growth in 2014
Both inward and outward FDI stocks continued to grow in 2013 and 2014 (see Figure 3). Between end 2013 and end 2014, EU-28 outward stocks grew 8.6 % and inward stocks grew 14.9 %. In 2014, 14.0 % of total outward stocks in extra EU were located in the BRIC countries (see Table 3). During the whole period, the EU-28 had a positive FDI balance — in other words, outward stocks of FDI exceeded inward stocks, thus the EU was a net investor in the BRIC countries.
Brazil was the main location of EU-28 FDI outward stocks in BRIC countries
At the end of 2014, Brazil had the biggest share (42.7 %) of EU-28 FDI stocks in BRIC countries. Second came China including Hong Kong with 31.2 %. In the period 2010-14 Brazil had the highest growth of 72.7 %. The EU invested predominantly in the service sectors in BRIC (see Table 5). Exceptions were China (excluding Hong Kong) and India, where the Manufacturing sector held about 54 % and 59 %, respectively, of total EU FDI stocks at the end of 2013. The financial sector attracted more than half of the EU investments in Hong Kong and one third in Russia in 2013. The EU investments in Brazil were mainly held by the service sector, in particular in financial services and telecommunications.
Brazil was the main holder of inward FDI stocks in the EU-28 from BRIC countries
At the end of 2014, Brazil held close to 40 % of total EU-28 FDI inward stocks from BRIC countries (see Table 4). Brazil invested mainly in the financial services sector in the EU accounting for 88 % of its FDI stock in the EU. Second came China including Hong Kong with 32.1 % of all FDI stock from BRIC countries in the EU. Those were mainly invested in the services sector. China also had the highest growth during the period 2010-14 with 93.2 %
Data sources and availability
FDI statistics in the EU are collected in accordance with Regulation (EC) No 184/2005 of the European Parliament and of the Council on Community statistics concerning balance of payments, international trade in services and foreign direct investment, and the amending Commission Regulation (EU) No 555/2012.
The methodological framework used is that of the OECD benchmark definition of foreign direct investment — third edition, which provides a detailed operational definition that is fully consistent with the IMF’s balance of payments manual (fifth edition).
This article is based on FDI data that were available in Eurostat’s database in September 2016. The series in the database covered the period from 2010 to 2014, analysed by partner and activity. The FDI figures that are presented in this article for 2013 and 2014 are based on the new international standards — Balance of Payments Manual, 6th edition (BPM6) and Benchmark Definition of FDI, 4th edition (BD4). EU aggregates include special-purpose entities, which are a particular class of enterprises (often holding companies).
Context
In a world of increasing globalisation, where political, economic and technological barriers are rapidly disappearing, the ability of a country to participate in global activity is an important indicator of its performance and competitiveness. In order to remain competitive, modern-day business relationships extend well beyond the traditional international exchange of goods and services, as witnessed by the increasing reliance of enterprises on mergers, partnerships, joint ventures, licensing agreements, and other forms of business cooperation. FDI may be seen as an alternative economic strategy, adopted by those enterprises that invest to establish a new plant/office, or alternatively, purchase existing assets of a foreign enterprise. These enterprises seek to complement or substitute international trade, by producing (and often selling) goods and services in countries other than where the enterprise was first established. There are two kinds of FDI: the creation of productive assets by foreigners (so-called green field investments), or the purchase of existing assets by foreigners (for example, through acquisitions, mergers, takeovers). FDI differs from portfolio investments because it is made with the purpose of having control, or an effective voice, in the management of the enterprise concerned and a lasting interest in the enterprise. Direct investment not only includes the initial acquisition of equity capital, but also subsequent capital transactions between the foreign investor and domestic and affiliated enterprises.
See also
- Balance of payments and international investment position manual (BPM6)
- Foreign direct investment statistics
Further Eurostat information
Main tables
- Balance of payments - International transactions (t_bop)
- European Union direct investments (t_bop_fdi)
- Balance of payments - International transactions (t_bop_6)
- European Union direct investments (t_bop_q6)
Database
- Balance of payments - International transactions (bop)
- European Union direct investments (bop_fdi)
- EU direct investments - main indicators (bop_fdi_main)
- European Union direct investments (bop_fdi)
- Balance of payments - International transactions (bop_6)
- European Union direct investments (bop_fdi6)
- EU direct investments - main indicators (bop_fdi6_pos)
- European Union direct investments (bop_fdi6)
Dedicated section
Methodology / Metadata
- European Union direct investments (ESMS metadata file — bop_fdi_esms)
Source data for tables, figures and maps (MS Excel)
Other information
External links
- OECD Benchmark Definition of Foreign Direct Investment
- United Nations Conference on Trade and Development (UNCTAD) - FDI Statistics
Notes
- ↑ The high share of Hong Kong over China figures is due to the fact that investment to/from China are often channeled through Hong Kong
- ↑ The figures from 2013 onwards have been compiled according to the new international standards (BPM6 and BD4) and therefore they cannot be directly compared with figures for previous years.