Archive:Sustainable development - public health
- Data from October 2013. Most recent data: Further Eurostat information, Database.
This article provides an overview of statistical data on sustainable development in the area of public health. They are based on the set of sustainable development indicators the European Union (EU) agreed upon for monitoring its sustainable development strategy. Together with similar indicators for other areas, they make up the report 'Sustainable development in the European Union - 2013 monitoring report of the EU sustainable development strategy', which Eurostat draws up every two years to provide an objective statistical picture of progress towards the goals and objectives set by the EU sustainable development strategy and which underpins the European Commission’s report on its implementation.
The table below summarises the state of affairs of in the area of public health. Quantitative rules applied consistently across indicators, and visualised through weather symbols, provide a relative assessment of whether Europe is moving in the right direction, and at a sufficient pace, given the objectives and targets defined in the strategy.

Overview of main changes
Public health indicators are strongly linked to economic activity. The nature of this interlinkage depends on the respective indicator group. The headline indicators of life expectancy and healthy life years as well as the sub-indicators on health and health inequalities improve with economic growth. This can be observed over time, during economic crises and across countries. In general life expectancy is increasing over time and improvements in the reduction of deaths due to chronic diseases, suicides and access to health care since 2000 are visible. During the current economic crisis a reversal of the downward trend can be observed for the suicide death rate and the number of people reporting problems of access to health care. Furthermore the sub-indicators production of toxic chemicals, exposure to air pollution by particulate matter and ozone, being negative determinants of health, can increase with economic activity or production growth respectively. This implies that economic growth can have both positive and negative effects on public health and points out to the importance of the sustainability of economic growth.
Main statistical findings
Headline indicator
 Life expectancy and healthy life years
'1.7 years (women) and 2.2 years (men) increase in life expectancy in the EU between 2004 and 2011. However, people do not necessarily live

longer in good health In 2004 the average number of years women could expect

to live at their birth in the EU was 81.5. This was 6.3 more years than men could expect. Between 2004 and 2011 life expectancy for both women and men increased moderately. The increase was slightly stronger for men with

an annual growth rate of 0.4 % compared to 0.3 % for women. This development indicates that the gap in life expectancy between women and men

is closing over time.
- How life expectancy and healthy life years vary between Member States
Women had the highest life expectancy in France (85.7) where they became on average 2.5 years older than the EU average and almost eight years older than in Bulgaria, which is the country in Europe with the lowest life expectancy. In 2011 there were nine Member States from Eastern Europe where the life expectancy of women was still lower than the EU average of 2004.
For men, the disparities in life expectancy between countries are even larger. In 2011 men lived the longest in Italy (80.1 years) and were on average 2.7 years older than the EU average and 12 years older than in the country with the lowest life expectancy for men, which is Lithuania with 68.1 years. In the same nine Eastern European countries as above the life expectancies for men in 2011 were still lower than the EU average of 2004. The reasons for the lower life expectancies in these Eastern European countries are mostly poorer socioeconomic conditions combining with poorer nutrition, worse health literacy or stress as well as higher unemployment rates that may for example be associated with high risk alcohol consumption.
Disparities between the EU countries are even higher with respect to healthy life years [1]. The country with the highest number of healthy life years is Malta; in this country, women and men can expect to spend 8.5 more years of their lives in good health than on average in the EU. On the other end of the scale, people in Slovakia spend about 10 fewer years in good health than people do on average in the EU. Hence comparing the first and the last country reveals a county gap in healthy life years across the EU of over 18 years.
- Regional disparities in life expectancy
The top 10 EU regions with respect to life expectancy are all located in countries heading the life-expectancy-list (France, Spain, Italy) and are either urban regions like the greater cities of Madrid and Paris (Île de France) or wine-growing districts. The bottom 10 regions are located in Bulgaria (the wheat-growing northern regions of Severozapaden, Severna and Yugoiztochna Bulgaria, Severen tsentralen and Severoiztochen and the southeastern district Yugoiztochen), Latvia, Lithuania, Romania (Vest, Sud-Muntenia,Sud-Est, Nord-vest, Macroregiunea doi, Macroregiunea patru) and Hungary (the north and north-eastern districts of Alföld és Észak, Észak-Magyarország and Észak-Alföld) where life expectancies at the national level are the lowest within Europe.
The dispersion of life-expectancy within countries across regions is relatively low. In most countries it lies between 0 % and 4 %. In six countries however (Belgium, Spain, France, Poland, Portugal and the UK) some regions have life-expectancies that are 6 % higher than other regions in the same country. Interestingly, France, Spain and Portugal — having the highest life expectancies at the national level — belong to these high-dispersion-countries. However regions where life-expectancy is especially low in these countries are geographically remote regions like the Azores or Madeira in Portugal, the autonomic cities Ceuta and Melilla of Spain (situated in North Africa) and the French overseas territory Guiana.
- Life expectancy is lowest in most Central and Eastern European Member States
Growing life expectancy reflects improved living conditions in the EU in terms of economic welfare, social security and health care resources. Nevertheless, there are differences between Member States. Some of the Central and Eastern European Member States tend to have shorter life expectancies mostly due to poorer socio-economic conditions in these countries, especially higher unemployment rates.
- Health inequalities in the EU
Over the last years the gap in male life expectancy at birth between Member States has narrowed by about 17 % — from 14.2 years in 2007 to 11.8 years in 2011. For the period 2006-2011 the female gap has also improved by about 4 % (from 8.2 to 7.9 years). The Gini coefficient for differences in life expectancy at birth also points to an overall reduction in health inequalities between Member States — it has reduced by 3.5 % for males and 10.4 % for females [2].
Health inequalities between groups of people are a result of social and economic differences that affect a wide range of health factors such as living and working conditions, health-related behaviour such as smoking, drinking and diet, and access to and quality of healthcare. In general, economic conditions, as measured by GDP, tend to be more strongly associated with health outcomes in less prosperous countries and regions. However, higher levels of GDP do not necessarily result in better health due to the importance of other factors such as income distribution, consumption, services and impact of public policies on health. Both at Member State and regional level social gradient in health exists across educational, income and occupational groups, where those at the lower levels tend to have lower life expectancy and higher incidence of health problems. For example, in 2010 the gap in life expectancy at 30 years of age between males with basic lower or secondary education and those with higher level education ranged from three to 17 years across the EU. For females the gap varied from one to nine years. Similarly, the level of poor health, long-term illness and restrictions on daily living activities are about twice as high (or higher) among the lowest educational and income groups compared to the highest income and education categories [3].
Health and health inequalities
 Deaths due to chronic diseases

18 % drop in the death rate due to chronic diseases in the EU between 2000 and 2009. However, chronic diseases remain the most frequent cause of death among people aged under 65

Deaths due to chronic diseases occurring when people are less than 65 years old can be considered as premature. They are the most

frequent causes of death among this age-group in high- and middle income countries. In fact, almost 60 % of all cases of deaths of the less than 65 year olds are due to chronic diseases.
- The fall in deaths due to chronic diseases is partly a result of the declining overall death rate
Explanations for the downward trend of the death rate due to chronic diseases are twofold. On the one hand reasons for the improvement could be the increased public awareness for healthier lifestyles, such as healthy eating, regular exercise, better managing stress and combating risk factors such as smoking and excessive alcohol consumption. These are assisted by national and EU level awareness initiatives as well as increasing efforts in implementing chronic disease management programmes in primary care. On the other hand the ratio of deaths due to chronic diseases in all deaths remained more or less stable over time, with only a marginal decrease of 0.2 % per year on average. This suggests that the decrease of the death rate due to chronic diseases is at least in part a result of the declining overall death rate.
- How deaths due to chronic disease vary between Member States
Wide disparities of death rates due to chronic disease exist across the 27 EU Member countries. While in 2009 in Sweden about 80 people per 100 000 inhabitants died due to chronic diseases, the same number amounted to more than 250 in Hungary, which is more than three times as high. Overall, in nine countries the chronic disease death rates lie above the EU-27 average and still above 140 per 100 000 inhabitants. All of these nine countries are lower-income countries, but in five of these countries the ratios of chronic disease deaths on all deaths figure among the lowest in the whole EU (around 46 % to 52 % of all deaths in these countries are due to chronic diseases). This suggests that high chronic disease death rates are a result of the overall high death rates which in return are associated with lower development statuses in these countries.
In all countries except for Lithuania the chronic disease death rates decreased between 2000 and 2009. Countries that experienced especially high improvements were Estonia, Denmark, Ireland and the Czech Republic.
- Differences remain between lower and higher income Member States
During the period 2000 to 2002 death rates rose in several Member States, as is particularly evident from the small peak in 2002. One reason for this short-lived phenomenon could be the economic downturn at that time. However, between 2000 and 2009, death rates due to chronic diseases have declined in almost all countries in the EU. Nevertheless in some lower-income Member States death rates due to chronic diseases remain high and still more than 150 people out of 100 000 people died from these diseases.
Suicides
14 % drop in the suicide rate in the EU between 2000 and 2010. However, the decline has stopped since the onset of the economic crisis, in particular among men

- Has the economic crisis taken its toll on suicide rates?
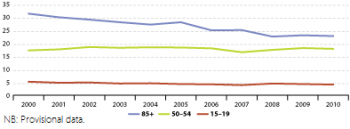 Figure 8: Suicide death rate, by age group (crude death rate), EU-27 (per 100 000 persons) - Source: Eurostat (tsdph240)

About 10 out of 100 000 people committed suicide in 2010 [4]. Between 2000 and 2010 the suicide death rate recorded an overall average decrease of 1.4 %. However, most of this decrease took place in the period 2000 to 2007, when it fell by an annual average of 2.5 %. The suicide death rate started to increase after 2007, by 2 % in 2007 and 3 % in 2008 compared with the respective previous year. This trend coincides with the onset of the economic crisis and its negative impacts on unemployment starting in 2007 [5].
- Suicides more common in older age groups
The suicide death rates also vary with respect to age, with deaths due to suicide more common in older age groups. However the gap between the oldest and the youngest group is closing over time. In the year 2000 among people aged 85 and older almost 32 people per 100 000 committed suicide with a fatal outcome, while among the youngest age group (people aged 15 to 19) only about six out of 100 000 people died due to suicide. Until 2010 the suicide death rate among people aged 85 and over substantially reduced down to about 23 people per 100 000. One possible explanation for the observed age gap is a higher probability of survival for young people attempting to commit suicide. Also the decline of the suicide death rate among old people could be explained by an increasing probability of survival over time [6].
Unmet needs for healthcare
1.4 percentage point drop in the share of people perceiving unmet needs for medical health care in the EU between 2005 and 2011. However, since the onset of the economic crisis more people

have felt unable to afford medical expenses. Differences between income groups persist
In 2011, 2.3 % of the EU population reported that they were not able to afford medical treatment or examination in the last 12 months [7]. Between 2005 and 2009 this share had fallen continuously, by 1.8 percentage points. After 2009, however, the trend experienced a turnaround, growing slightly by 0.4 percentage points until 2011. This coincides with the impacts of the economic crisis, showing that increasing economic constraints can lead to less access to medical care.
- The more people are economically constrained, the more often they report unmet medical needs
This observation becomes also apparent by means of the differences in perceived access to health care across people from different income quintiles. Only few people from the highest income quintile report unmet needs for medical care; in 2011 this share stood at 0.6 %. With falling income levels, the proportion of those who consider expense as an obstacle to access medical care increases. Among those from the lowest income quintile almost 5 % of the people reported unmet medical needs in 2011.
In the period before the crisis, the proportion of people reporting unmet needs for healthcare did not only fall overall, but for all income groups. This trend was reversed in 2010 when only the lowest income group reported an improvement of some 2 %. Comparing the pre-crisis levels reported in 2008 with 2011, evidence suggests that the crisis has been relatively harsher for the higher and middle income groups. For the three upper quintiles, rates increased between 18 % and 30 % in this period while for the two lowest income groups the relative increase was about 7–8 %. Yet, throughout the period the number of people in the lowest income group was significantly higher than the number in each of the other groups.
- Are health inequalities within the EU improving?
At the same time the gap between the lowest and the highest income groups decreased, at least in absolute terms. While the gap accounted for 6.5 percentage points in 2005, it was only 3.7 percentage points in 2009 and 3.6 percentage points in 2010. However in relative terms the relation between the richest and the poorest did not improve substantially in the examined period. In 2005 and 2006 the share of people perceiving unmet medical needs among the lowest income group was seven times higher than in the highest income group. In 2008 people reporting unmet needs for healthcare from the lowest income group were 9 times more than those with highest income and in 2011 the proportion was 8 to 1.
Determinants of health
 Production of toxic chemicals
204 million tonnes of toxic chemicals produced in the EU in 2011. Production reached a low in 2009 but climbed back to pre-crisis levels until 2011

In 2011 around 350 million tonnes of chemicals were produced in the EU. This is some 50 million tonnes more than two years before and represents an increase of the production volume of almost 20 % within two years.
The overall share of produced industrial chemicals that are toxic to human health followed a modest downward path over the last ten years. From a peak of 62 % of total chemicals production in 2002, the share of toxic chemicals fell (despite a temporary rise in 2009) to 61 % in 2010 and to 59 % in 2011. The shares of the different types of toxic chemicals shown in Figure 5.10 remained rather stable throughout the whole time period.
- Share of toxic chemicals produced fell however their production level has remained largely unchanged in absolute terms
The overall reduction in this share may be attributed to output levels for toxic chemicals remaining largely unchanged between 2002 and 2011 (– 0.5 %), while there was an expansion in the production of non-toxic chemicals (13.9 %). This also underlies the fall in the share of toxic chemicals in 2011. The time series from 2002 to 2011 therefore provides little indication that the production of chemicals toxic to human health and/or harmful to ecosystems has been significantly decoupled from overall chemicals production. Thus the regulation for the registration, evaluation, authorisation and restriction of chemicals (REACH) [8] which entered into force in June 2007, does not seem to have contributed to a reduction of the total volume of toxic chemical production [9].
 Exposure to air pollution by particulate matter
One microgram per cubic metre reduction in exposure to air pollution by particulate matter in the EU between 2000 and 2011. The 2010 target has not been met

Between 2000 and 2011 air pollution by particulate matter decreased by 1 microgram per cubic metre. However, given the substantial year-on-year variations it is difficult to discern any clear trend. The so-called first Daughter Directive [10], adopted in 1999, had set annual limit targets for 2005 and 2010 regarding the annual mean concentrations of particulate matter in micrograms per cubic metre. While the 2005 target of 40 micrograms per cubic metre was easily met, the 2010 target of 20 micrograms could not be achieved. In 2010 the emission of particulate matter constituted 26 micrograms per cubic metre, which is 6 micrograms above the target. The increase in 2011 has moved the EU even further away from this target.
The peaks in 2003 and 2006 were partially due to severe heat waves during those summers. The hot, dry conditions led to stagnant air in which pollutants accumulated. In 2003, at least, conditions were exacerbated by the prevalence of wildfires in south-western Europe producing large quantities of particulates which were then transported to the northern and eastern parts of Europe [11]. Furthermore the ‘El Nino’ phenomenon might have had an impact on particulate matter concentration and contributed to the peaks in 2003 and 2006.
In addition to sporadic wildfires, the Member States bordering the Mediterranean also suffer from dust blown from North Africa.
Exposure to air pollution by ozone
About 770 micrograms per cubic metre day increase in exposure to air pollution by ozone in the EU between 2000 and 2011. Changing weather patterns contribute to yearly and

regional differences in ozone concentrations
Overall exposure to air pollution by ozone rose at an annual average rate of 1.7 % between 2000 and 2011. However the development was very volatile. The high exposure in the year 2003 is related to the heat wave in that summer [12]. A smaller peak also occurred in 2006 for similar reasons.
Urban exposure to ozone widely varied between countries, partly due to differences in climate and vegetation. In general, southern countries with higher summer temperatures show higher exposure levels than the cooler northern countries. Nevertheless, peaks occurred throughout the EU in 2003 and 2006 due to exceptionally high temperatures in those years. This increase was most pronounced in the northern countries, which showed higher relative increases compared to the southern countries.
See also
Further Eurostat information
Publications
- Health and safety at work in Europe (1999-2007) – A statistical portrait
- Health statistics - Atlas on mortality in the European Union
- Perception of health and access to health care in the EU-25 in 2007 - Statistics in Focus 24/2009
- Sustainable development in the European Union - 2011 monitoring report of the EU sustainable development strategy
Main tables
- Public Health
Dedicated section
Methodology
- More detailed information on public health indicators, such as indicator relevance, definitions, methodological notes, background and potential linkages, can be found on page 191-213 of the publication Sustainable development in the European Union- 2011 monitoring report of the EU sustainable development strategy.
Other information
- Commission communication COM(2009) 567 - Solidarity in health: reducing health inequalities in the EU
- European Commission - Major and chronic diseases - Report 2007
- European Commission - White paper - together for health: a strategic approach for the EU 2008-2013
External links
- Commission on Social Determinants of Health (WHO) - Closing the gap in a generation: Health equity through action on the social determinants of health, Geneva
- World Health Organization - WHO
Notes
- ↑ The county breakdown of the indicator healthy life years must be handled with care as treatment and use of medical care as well as mortality registration methods may vary across countries,
- ↑ The Gini coefficient is used as an indicator of inequality. Although it is mainly used to measure income inequality, it can also be applied to health. It can take values from 0 (perfect equality) to +1 (perfect inequality). For details on the method of calculation, see Regidor E, ‘Measures of health inequalities: part 1’, Journal of Epidemiology and Community Health 2004; 58: pp. 858–861; also see Report on Health Inequalities in the European Union. Commission Staff Working Document, SWD(2013) 328 final, p. 3.
- ↑ European Commission, Report on Health Inequalities in the European Union, SWD(2013) 328 final.
- ↑ Figures should be interpreted with care as suicide registration methods vary between countries and over time. Moreover, the figures do not include deaths from events of undetermined intent (part of which should be considered as suicides)
- ↑ See Platt S, Hawton K, Suicidal behaviour and the labour market. The International Handbook of Suicide and Attempted Suicide, 2000 (pp. 309–383) for an analysis of the relationship between suicides and the labour market.
- ↑ Antonio Preti, Trends in suicide case fatality in Italy, 1983–2007, Psychiatry Research 196 (2012): 255–260.
- ↑ The comparability of the indicator between countries is limited as national questions on self-reported unmet need for medical care are not completely harmonised, differences in national health systems limit the comparability and indicators based on self-reporting incorporate individual subjective cultural effects and perceptions. The indicator should be interpreted carefully.
- ↑ Regulation (EC) No 1907/2006 concerning the Registration, Evaluation, Authorisation and Restriction of Chemicals (REACH), establishing a European Chemicals Agency.
- ↑ ECHA, Implementing REACH in practice; see http://www.eubusiness.com/topics/chemicals/echa-reach-guide/.
- ↑ Directive 2008/50/EC on ambient air quality and cleaner air for Europe.
- ↑ Hodzic A., Madronich, S., Bohn, B., Masiie, S., Menut, L., and Wiedinmyer, C., Wildfire particulate matter in Europe during summer 2003: meso-scale modeling of smoke emissions, transport and radiative effects, Atmospheric Chemistry and Physics, 2007, Vol. 7, pp. 4 705–4 760.
- ↑ Johnson H., Kovats S., McGregor, G., Stedman, J., Gibbs, M., and Walton, H., The impact of the 2003 heatwave on daily mortality in England and Wales and the use of rapid weekly mortality estimates, Euro Surveillance, 2005, Vol. 10, pp. 168-171.