Archive:Travel agency and tour operator statistics - NACE Rev. 2
- Data from April 2013. Most recent data: Further Eurostat information, Main tables and Database.
This article presents an overview of statistics for the travel agency and tour operator reservation and related service activities sector in the European Union (EU), as covered by NACE Rev. 2 Division 79, hereafter referred to as travel agency and related services.



(% share of sectoral total) - Source: Eurostat (sbs_sc_1b_se_r)
Main statistical findings
Structural profile
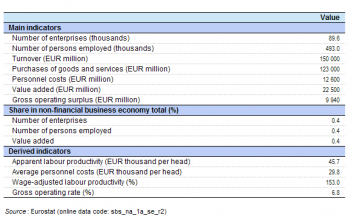
There were 90 thousand enterprises operating within the travel agency and related services (Division 79) sector in the EU-27 in 2010. Together they employed 493 thousand persons, equivalent to 0.4 % of the total workforce in the non-financial business economy (Sections B to J and L to N and Division 95) and 3.8 % of those employed within administrative and support services (Section N). Travel agency and related services generated EUR 22.5 billion of value added which was 0.4 % of the non-financial business economy total or 5.9 % of the added value for administrative and support services. As such, in both employment and value added terms, travel agency and related services were the smallest of the six NACE divisions that form the administrative and support services sector. Given the nature of travel agency and related services it is not surprising to find that they had relatively high turnover, some EUR 150 billion across the EU-27 in 2010, which was equivalent to 0.6 % of the non-financial business economy total or 19.0 % of the turnover generated within administrative and support services.
The somewhat higher share of non-financial business economy value added compared with employment for the travel agency and related services sector meant that the apparent labour productivity of EUR 45.7 thousand per person employed in this sector in 2010 was slightly above the non-financial business economy average of EUR 44.8 thousand and also much higher than the administrative and support services average of EUR 29.0 thousand. Average personnel costs within the EU-27’s travel agency and related services sector were EUR 1 100 per employee lower than the non-financial business economy average, as they stood at EUR 29.8 thousand per employee in 2010, considerably above the average for administrative and support services (EUR 21.6 thousand per employee). The wage-adjusted labour productivity ratio for EU-27 travel agency and related services in 2010 was 153.0 %, somewhat higher than the non-financial business economy average (144.8 %) or the administrative and support services average (137.0 %).
The gross operating rate (the relation between the gross operating surplus and turnover) is one measure of operating profitability; it stood at 6.8 % for the EU-27’s travel agency and related services sector in 2010, which was about two thirds of the non-financial business economy average (10.1 %) and considerably lower than the administrative and support services average (16.0 %). Indeed, the gross operating rate for travel agency and related services was the lowest among the six NACE divisions within administrative and support services and the tenth lowest among any of the NACE divisions that constitute the non-financial business economy.
Sectoral analysis
The EU-27 travel agency and related services sector can be divided into two subsectors, the largest of which — by far — was the travel agency and tour operator activities subsector (Group 79.1). It accounted for 90.9 % of sectoral value added in 2010 and for 88.2 % of sectoral employment; the residual shares being attributed to other reservation services and related activities (Group 79.9). Given the relative weight of the travel agency and tour operator activities subsector there was little difference between it and the whole of the travel agency and related services sector for a range of productivity and profitability measures.
For apparent labour productivity, the latest information available shows that both subsectors recorded productivity levels that were close to the EU-27 non-financial business economy average, with persons employed in the travel agency and tour operator activities subsector generating, on average, EUR 46.7 thousand of added value in 2010, while for other reservation services and related activities the corresponding ratio stood at EUR 40.0 thousand in 2009. EU-27 average personnel costs for the travel agency and tour operator activities subsector were EUR 29.7 thousand per employee in 2010, which was just EUR 300 per employee less than the average recorded for the other reservation services and related activities subsector. Wage-adjusted labour productivity ratios —apparent labour productivity divided by average personnel costs — were also close to the non-financial business economy average. This was particularly true for the travel agency and tour operator activities subsector (157.3 % in 2010), while the ratio was somewhat lower for other reservation services and related activities (120.0 %).
The relatively low gross operating rate (6.5 %) for the EU-27’s travel agency and tour operator activities subsector in 2010 reflects, to some degree, the trading nature of these activities and the high volume of buying and reselling travel and tourism services.
Country analysis
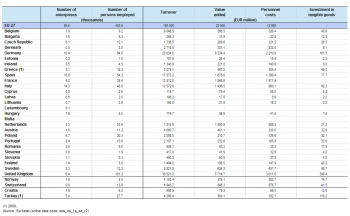
More than half of the EU-27’s value added within the travel agency and related services sector in 2010 was generated in either Germany (27.7 %) or the United Kingdom (25.4 %); these figures reflect the high tourism demand in these two countries. The data also suggest that these two countries have relatively large enterprises in this sector, as there were less travel agency and related services enterprises operating in Germany or the United Kingdom than in either Spain or Italy, which in turn accounted for 8.3 % and 6.4 % of EU-27 value added.
The relative importance of travel agency and related services in terms of their contribution to non-financial business economy value added was highest in Cyprus, attaining a 0.9 % share in 2010. This was much higher than in any of the other EU Member States for which data are available, as the second most specialised Member State was the United Kingdom, where 0.6 % of non-financial business economy value added was generated in the travel agency and related services sector. At the other end of the range, there were three Member States where less than 0.2 % of non-financial business economy value added was generated within the travel agency and related services sector — these were Romania, Poland and Hungary. Among the non-member countries presented in Table 4a, the travel agency and related services sector generated 0.4 % of non-financial business economy value added in Croatia and Turkey (data are for 2009), while lower shares were reported in Switzerland (0.3 %) and Norway (0.2 %).
In employment terms, the travel agency and related services sector’s workforce was less concentrated than for value added. There were as many as 101.2 thousand persons employed within travel agency and related services in the United Kingdom in 2010 (a 20.5 % share of the EU-27 total). Germany had the second largest workforce (17.0 % of the EU -27 total), while Spain (11.0 %) also recorded a double-digit share.
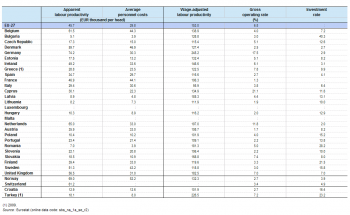
Most EU Member States reported wage-adjusted labour productivity ratios for travel agency and related services in 2010 that were below their national averages for the whole of the non-financial business economy. However, there were five countries —the two largest in terms of value added, Germany and the United Kingdom, as well as Belgium, the Netherlands and Slovakia — that did not follow this pattern; four out of these five Member States (Belgium was the exception) recorded wage-adjusted labour productivity ratios that were over 165 %, as did Latvia and Romania. The highest wage-adjusted labour productivity ratio was recorded for Germany (245.2 %). Turkey also recorded a relatively high wage-adjusted labour productivity ratio for travel agency and related services, at 226.5 % in 2009. At the other end of the range, the lowest ratio — falling below 100 % — was recorded in Italy, showing that, on average, the value added generated per person employed did not cover personnel costs per employee.
Gross operating rates for travel agency and related services were relatively low across the EU Member States, being situated below non-financial business economy averages in 2010 for all of the Member States except for Cyprus, Germany and the Netherlands. Gross operating profitability rose between 2009 and 2010 in most of the Member States, reaching a peak of 21.1 % in Cyprus and 17.5 % in Germany. By contrast, the gross operating rate for travel agency and related services fell to less than 2.0 % in Lithuania, Austria and France (where the lowest rate was recorded, 1.3 %).
Size class analysis
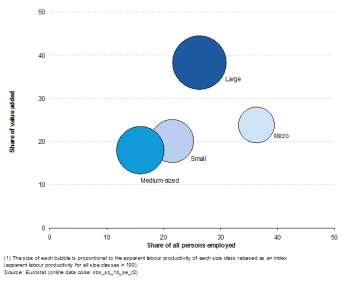
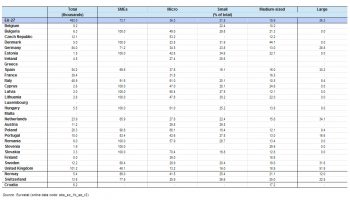
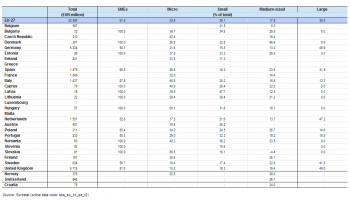
There were 145 large enterprises (employing 250 or more persons) active within the EU-27’s travel agency and related services sector in 2010. Together they generated EUR 8.6 billion of added value, equivalent to 38.2 % of the sectoral total. However, in terms of employment, micro enterprises (employing less than 10 persons) accounted for the highest share (36.3 %) of the travel agency and related services workforce, while large enterprises employed just over one quarter (26.3 %) of the sectoral workforce.
These different shares of value added and employment were evident when analysing EU-27 apparent labour productivity for the different enterprise size classes within the travel agency and related services sector. The relationship between the average size of enterprises and their apparent labour productivity demonstrates that within the travel agency and related services sector there were increasing returns to scale, as the highest productivity ratios were recorded for large enterprises, where, on average, each person employed generated EUR 66.4 thousand of added value. Medium-sized enterprises (employing 50 to 249 persons) also reported apparent labour productivity that was above the travel agency and related services sector average, while this productivity ratio fell to a low of EUR 29.9 thousand per person employed for micro enterprises.
Large enterprises were particularly prevalent among those EU Member States which had some of the highest levels of activity within the travel agency and related services sector in 2010. In value added terms, large enterprises accounted for almost half of the activity within this sector in Germany (49.9 %) and the United Kingdom (49.0 %), while the Netherlands recorded a share (47.2 %) that was almost as high. Just over half (51.9 %) of the workforce in the United Kingdom’s travel agency and related services sector was employed by large enterprises; this was considerably above the next highest share (34.1 %) which was recorded for the Netherlands.
The relative importance of micro enterprises was, in employment terms, particularly marked in several of the Member States that joined the EU in 2004 or 2007, as well as in Italy. Micro enterprises accounted for 70.4 % of those employed within the travel agency and related services sector in Slovakia in 2010, while upwards of 6 out of 10 persons who worked in the travel agency and related services sector in Poland, Italy, Hungary and Latvia were employed by a micro enterprise; Romania and the Czech Republic were the only other EU Member States to report that in excess of 50 % of their travel agency and related services workforce were employed by a micro enterprise.
Data sources and availability
The analysis presented in this article is based on the main dataset for structural business statistics (SBS) and size class data, all of which are published annually.
The main series provides information for each EU Member State as well as a number of non-member countries at a detailed level according to the activity classification NACE. Data are available for a wide range of variables.
In structural business statistics, size classes are generally defined by the number of persons employed. A limited set of the standard structural business statistics variables (for example, the number of enterprises, turnover, persons employed and value added) are analysed by size class, mostly down to the three-digit (group) level of NACE. The main size classes used in this article for presenting the results are:
- small and medium-sized enterprises (SMEs): with 1 to 249 persons employed, further divided into;
- micro enterprises: with less than 10 persons employed;
- small enterprises: with 10 to 49 persons employed;
- medium-sized enterprises: with 50 to 249 persons employed;
- large enterprises: with 250 or more persons employed.
Context
This article presents an overview of statistics for the travel agency and tour operator reservation and related service activities sector in the EU-27, as covered by NACE Rev. 2 Division 79. This division includes the activity of agencies, primarily engaged in selling travel, tour, transportation and accommodation services and the activity of arranging and assembling tours; other travel-related services are also included. Travel agencies activities are primarily engaged in selling travel, tour, transportation and accommodation services on a wholesale or retail basis to the general public and commercial clients. Tour operators arrange and assemble tours that are sold through travel agencies or directly by tour operators. The tours may include any or all of the following: transportation, accommodation, food, and visits to museums, historical or cultural sites, theatrical, musical or sporting events. Other reservation services and related activities include: marketing and promoting of services for conventions and visitors by providing information and assistance to organisations to locate accommodation, convention centres and entertainment venues; tourist guide services; condominium time-share exchange services; travel-related reservation services; ticket sales for theatrical, sports and all other amusement and entertainment events.
This NACE division is composed of two groups:
- travel agency and tour operator activities (Group 79.1);
- other reservation service and related activities (Group 79.9).
Note that the information presented in this article does not cover accommodation and food service activities, such as the running of hotels, campsites, restaurants, bars or cafés, but is rather restricted to selling, organising and reserving services that are sourced from these (and other) providers.
Further Eurostat information
Publications
- European business - facts and figures (online publication)
Main tables
Database
- SBS – services (sbs_serv)
- Annual detailed enterprise statistics - services (sbs_na_serv)
- Annual detailed enterprise statistics for services (NACE Rev.2 H-N and S95) (sbs_na_1a_se_r2)
- Preliminary results on services, main indicators (NACE Rev.2) (sbs_sc_r2preli)
- SMEs - Annual enterprise statistics broken down by size classes - services (sbs_sc_sc)
- Services broken down by employment size classes (NACE Rev.2 H-N and S95) (sbs_sc_1b_se_r2)
- Annual detailed enterprise statistics - services (sbs_na_serv)
- SBS - regional data - all activities (sbs_r)
- SBS data by NUTS 2 regions and NACE Rev.2, from 2008 onwards (sbs_r_nuts06_r2)
Dedicated section
Source data for tables and figures (MS Excel)
Other information
- Decision 1578/2007/EC of 11 December 2007 on the Community Statistical Programme 2008 to 2012
- Regulation 295/2008 of 11 March 2008 concerning structural business statistics