Archive:Air transport services statistics - NACE Rev. 2
- Data from April 2012. Most recent data: Further Eurostat information, Main tables and Database.
This article presents an overview of statistics for air transport services in the European Union (EU), as covered by NACE Rev. 2 Division 51.


(% share of sectoral total) - Source: Eurostat (sbs_na_1a_se_r2)


Main statistical findings
Structural profile
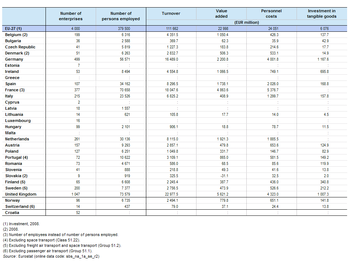
There were approximately four thousand enterprises operating within the air transport services sector (Division 51) in the EU-27 in 2009. Together they employed almost 380 thousand persons, equivalent to 0.3 % of the non-financial business economy (Sections B to J and L to N and Division 95) workforce or 3.6 % of the total number of persons employed in transportation and storage services (Section H). EU-27 air transport services generated EUR 23 000 million of value added in 2009, which was 0.4 % of the non-financial business economy total and 5.3 % of the transportation and storage total.
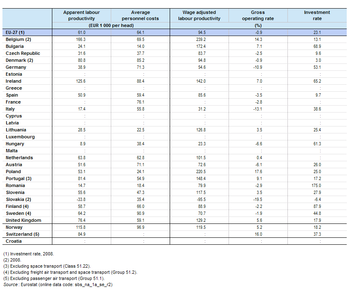
The apparent labour productivity of the EU-27's air transport services sector in 2009 was EUR 61 thousand per person employed, which was considerably higher than either the non-financial business economy average of EUR 41.6 thousand per person employed or the transportation and storage average of EUR 41 thousand per person employed. Although apparent labour productivity was relatively high, the EU-27’s air transport services sector had even higher average personnel costs, which rose to EUR 64.1 thousand per employee in 2009. These high average personnel costs were more than twice the non-financial business economy average (EUR 30.0 thousand per employee) and ranked third highest across the NACE divisions that make-up the non-financial business economy. The high level of average personnel costs impacted upon the wage-adjusted labour productivity ratio which combines the two previous indicators and shows the extent to which value added per person employed covers average personnel costs per employee. This ratio was below parity and stood at 94.5 % for the EU-27’s air transport services sector in 2009; this was the lowest wage-adjusted labour productivity ratio for any of the NACE divisions within the non-financial business economy and considerably lower than the non-financial business economy average of 138.8 %.
The gross operating rate measures the relation between the gross operating surplus and turnover and is one measure of operating profitability; it stood at -0.9 % for the EU-27’s air transport services sector in 2009. This was also the lowest value recorded for this rate among any of the NACE divisions within the non-financial business economy, as the air transport services sector was the only NACE division to record a negative rate. The negative gross operating rate resulted from total personnel costs being higher than the value added generated by the air transport services sector in 2009.
Sectoral analysis
The air transport services sector is divided within NACE into passenger air transport (Group 51.1) on the one hand, and freight air transport and space transport (Group 51.2) on the other. By far the largest of these two subsectors – no matter which measure of size is used – was the passenger air transport subsector. It accounted for 94.1 % of the added value of the EU-27’s air transport services sector in 2009 and 94.8 % of its workforce. There were more than five times as many passenger air transport enterprises as there were freight and space transport enterprises, a ratio that rose to 16:1 when based on value added and more than 18:1 in relation to the air transport services workforce.
Although the size of the two subsectors was quite different, their performance in relation to a range of different structural business indicators was comparable. For example, the apparent labour productivity of the EU-27’s passenger air transport subsector was EUR 60 thousand per person employed in 2009, while that for freight air transport and space transport was EUR 69 thousand per person employed. Average personnel costs were at a similar level between the two subsectors, with the freight air transport and space transport subsector again reporting a somewhat higher level (EUR 69.2 thousand per employee) compared with EUR 63.8 thousand per employee for passenger air transport. The resulting wage-adjusted labour productivity ratios (which combine the results of the first two indicators) were below parity for both subsectors, standing at 99.6 % for the freight air transport and space transport subsector and 94.2 % for the passenger air transport subsector. As such, the two air transport services subsectors were among the nine NACE groups within the non-financial business economy to report a wage-adjusted labour productivity ratio below 100 %, indicating that the apparent labour productivity of each person employed was not covered by average personnel costs per employee.
Both of the air transport services subsectors recorded gross operating rates that were very low when compared with the non-financial business economy average (9.7 %) in 2009. The gross operating rate for the EU-27’s passenger air transport subsector was -1.0 %, which was the second lowest value across all of the NACE groups within the non-financial business economy. The gross operating rate for the freight air transport and space transport subsector was only slightly higher, at 0.2 %.
Country analysis
Compared with many activities, the air transport services sector remains relatively concentrated within a few Member States, reflecting the distribution and economic performance of Europe’s main airlines and those airports that serve as hubs between inter-continental and European services. Nevertheless, in the last couple of decades there has been a significant change in the make-up of the air transport services sector away from a model that was dominated by large, national carriers that often had a monopoly. With deregulation, market entry (principally from low-cost carriers), increased choice concerning the routes available to consumers and downward price pressure, the air transport services sector in the EU-27 witnessed an expansion in passenger numbers.
The United Kingdom had the highest share (24.9 %) of EU-27 value added for the passenger air transport subsector in 2009, while France also accounted for a relatively high share (21.8 %); none of the remaining Member States for which data are available recorded a share that was into double-digits. For the freight air transport and space transport subsector, Germany recorded the highest share (27.9 %) of EU-27 value added in 2009, while the United Kingdom (17.1 %) and France (11.5 %) were the only other Member States to account for double-digit shares.
While the air transport services sector was dominated by the larger Member States, there were relatively high degrees of specialisation in a limited number of other countries. For example, Ireland and Portugal reported that the contribution of their respective passenger air transport subsectors to national non-financial business economy added value in 2009 was around three times as high as the EU-27 average (specialisation ratios of 318.4 % and 297.9 %). Within the freight air transport and space transport subsector Lithuania was the most specialised country, as this activity contributed approximately four times as much added value to the national non-financial business economy total as the average across the whole of the EU-27; Bulgaria was also relatively specialised (288.4 %).
As noted, the economic performance (as measured by the wage-adjusted labour productivity ratio and the gross operating rate) of the EU-27’s air transport services sector was relatively weak. Just nine of the 20 Member States for which data are available reported wage-adjusted labour productivity ratios above 100 % in 2009 (latest data is for 2008 for some Member States). Germany, Spain and Italy were among those Member States where average personnel costs were not covered by apparent labour productivity, while in Slovakia (2008) the air transport services sector recorded negative value added. The highest gross operating rate for air transport services was registered in Poland, at 17.6 % in 2009, while Belgium (14.3 % in 2008) was the only other Member State to record a double-digit rate. Indeed, there were only seven other Member States that reported positive gross operating rates in 2009, while 12 Member States had negative values for this measure of operating profitability, with the lowest being recorded for Germany (-10.9 %), Italy (-13.1 %) and Slovakia (-19.5 %, 2008).
Data sources and availability
The analysis presented in this article is based on the main dataset for structural business statistics (SBS) which are disseminated annually. The series provides information for each Member State as well as a number of non-member countries at a detailed level according to the activity classification NACE. Data are available for a wide range of variables.
Context
This article presents an overview of statistics for the air transport services sector in the EU, as covered by NACE Rev. 2 Division 51. This division includes transport services by air or via space; it excludes own account transport. For air transport a distinction is made between the transport of passengers and freight transport. Included are scheduled and non-scheduled (charter) flights, as well as scenic and sightseeing flights. Also included are general aviation activities such as transport of passengers by aero clubs for instruction or pleasure. Space transport includes the launching of satellites and space vehicles and space transport of freight and passengers.
This NACE division is composed of two groups:
- passenger air transport (Group 51.1);
- freight air transport and space transport (Group 51.2).
The following activities are excluded from the statistics presented in this article: crop spraying (which is part of Division 01, crop and animal production, hunting and related service activities – which does not form part of the non-financial business economy), the operation of airports (part of Division 52, warehousing and support activities for transportation) and the renting of air transport equipment without an operator (part of Division 77, the renting and leasing of goods).
Further Eurostat information
Publications
Main tables
Database
- SBS – services (sbs_serv)
- Annual detailed enterprise statistics - services (sbs_na_serv)
- Annual detailed enterprise statistics for services (NACE Rev.2 H-N and S95) (sbs_na_1a_se_r2)
- Preliminary results on services, main indicators (NACE Rev.2) (sbs_sc_r2preli)
- SMEs - Annual enterprise statistics broken down by size classes - services (sbs_sc_sc)
- Services broken down by employment size classes (NACE Rev.2 H-N and S95) (sbs_sc_1b_se_r2)
- Annual detailed enterprise statistics - services (sbs_na_serv)
- SBS - regional data - all activities (sbs_r)
- SBS data by NUTS 2 regions and NACE Rev.2, from 2008 onwards (sbs_r_nuts06_r2)
Dedicated section
Source data for tables, figures and maps (MS Excel)
Other information
- Regulation 58/1997 of 20 December 1996 concerning structural business statistics
- Decision 2367/2002/EC of 16 December 2002 on the Community statistical programme 2003 to 2007
- Regulation 295/2008 of 11 March 2008 concerning structural business statistics