Search results
Page title matches

File:EnergyMixDependencyImportsRussia-10MARCH2022 REV update.xlsx (132 KB) - 12:33, 11 March 2022File:Tourism employment 2024 rev 2.xlsx null ...(366 KB) - 15:53, 27 May 2024File:Construction (NACE Rev. 2).xls (539 KB) - 18:30, 21 September 2011File:Manufacturing (NACE Rev. 2).xls (1.12 MB) - 18:34, 21 September 2011File:SBS NACE Rev. 2 B.xls (793 KB) - 11:31, 8 May 2013File:SBS NACE Rev. 2 09.xls (435 KB) - 11:10, 8 May 2013File:SBS NACE Rev. 2 05.xls (423 KB) - 11:06, 8 May 2013File:SBS NACE Rev. 2 06.xls (429 KB) - 11:06, 8 May 2013File:SBS NACE Rev. 2 07.xls (379 KB) - 11:06, 8 May 2013File:SBS NACE Rev. 2 08.xls (450 KB) - 11:07, 8 May 2013File:SBS NACE Rev. 2 C.xls (959 KB) - 11:31, 8 May 2013File:SBS NACE Rev. 2 D.xls (1.26 MB) - 11:32, 8 May 2013File:SBS NACE Rev. 2 E.xls (798 KB) - 11:31, 8 May 2013File:SBS NACE Rev. 2 F.xls (792 KB) - 11:31, 8 May 2013File:SBS NACE Rev. 2 G.xls (804 KB) - 11:32, 8 May 2013File:SBS NACE Rev. 2 H.xls (812 KB) - 11:32, 8 May 2013File:SBS NACE Rev. 2 I.xls (782 KB) - 11:32, 8 May 2013File:SBS NACE Rev. 2 J.xls (1.17 MB) - 11:33, 8 May 2013File:SBS NACE Rev. 2 L.xls (1.11 MB) - 11:34, 8 May 2013File:SBS NACE Rev. 2 M.xls (1.18 MB) - 11:34, 8 May 2013
Page text matches
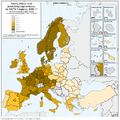
File:Hourly labour cost (excluding apprentices), by NUTS 1 regions, 2008.PNG :(EUR per employee in full-time units in business economy (NACE Rev. 2 B to N)) ==Map created with data from March 2011== ... title=Labour cost, wages and salaries, direct remuneration - Regional data - Nace Rev. 2 (Source LCS 2008)|code=lc_r08cost_r2 ...(811 × 812 (172 KB)) - 16:48, 11 November 2011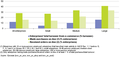
File:E-commerce among enterprises by size-class, EU-27, 2008 (1).PNG title=Value of purchases and sales by Internet and/or networks other than Internet (NACE Rev. 1.1)|code=isoc_ec_eval title=Enterprises purchasing via Internet and/or networks other than Internet (NACE Rev. 1.1)|code=isoc_ec_ebuy ...(607 × 290 (18 KB)) - 13:50, 27 April 2010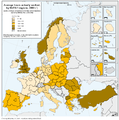
File:Average hours actually worked, by NUTS 1 regions, 2008.PNG :(yearly average per person in full-time unit in business economy (NACE Rev. 2 B to N)) ==Map created with data from March ... title=Number of hours actually worked and paid per employee - Regional data - Nace Rev. 2 (Source LCS 2008)|code=lc_r08num2_r2 ...(809 × 814 (172 KB)) - 16:59, 11 November 2011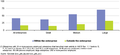
File:Enterprises sharing information automatically within the enterprise for different functions and outside the enterprise on supply chain management, by size-class, EU-27, January 2008 (1) (% of enterprises).PNG title=Integration of internal business processes (NACE Rev. 1.1)|code=isoc_pibi_ibp title=Integration with suppliers and/or customers (NACE Rev. 1.1)|code=isoc_pibi_isc ...(607 × 279 (13 KB)) - 11:47, 27 April 2010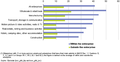
File:Enterprises sharing information automatically within the enterprise for different functions and outside the enterprise on supply chain management, by economic activity, EU-27, January 2008 (1) (% of enterprises).PNG title=Integration of internal business processes (NACE Rev. 1.1)|code=isoc_pibi_ibp title=Integration with suppliers and/or customers (NACE Rev. 1.1)|code=isoc_pibi_isc ...(610 × 316 (11 KB)) - 13:35, 27 April 2010
File:Annual growth rates for construction, 2004-2008 (%).PNG title=Construction production index - annual data - (2005=100) (NACE Rev. 2)|code=sts_copr_a title=New residential buildings prices index - annual data - (2005=100) (NACE Rev. 2)|code=sts_copi_a ...(627 × 549 (29 KB)) - 09:54, 23 April 2010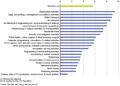
File:Average annual growth rate of turnover, selected services, EU-27, 2003-2008 (1) (%).PNG title=Other services turnover index - annual data - (2005=100) (NACE Rev. 2)|code=sts_setu_a title=Wholesale and retail trade turnover and volumes of sales - annual data - (2005=100) (NACE Rev. 2)|code=sts_trtu_a ...(607 × 435 (42 KB)) - 11:12, 26 April 2010
File:Annual growth rates for industry (excluding construction), 2004-2008 (%).PNG title=Industry production index - annual data - percentage change (NACE Rev. 2)|code=sts_inprgr_a title=Industry producer prices index, domestic market - annual data - percentage change (NACE Rev. 2)|code=sts_inppdgr_a ...(626 × 591 (31 KB)) - 09:36, 23 April 2010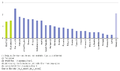
File:Job vacancy rate, 2009 (1) (%).PNG title=Job vacancy statistics, annual data - NACE Rev. 1.1|code=jvs_a_nace1 title=Job vacancy statistics, annual data - NACE Rev. 2|code=jvs_a_nace2 ...(789 × 464 (8 KB)) - 13:40, 10 December 2010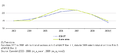
File:Job vacancy rate, 2003-2009 (%).PNG title=Job vacancy statistics, annual data - NACE Rev. 1.1|code=jvs_a_nace1 title=Job vacancy statistics, annual data - NACE Rev. 2|code=jvs_a_nace2 ...(703 × 314 (4 KB)) - 13:39, 10 December 2010
File:Index of turnover, selected service activities, EU-27 (1), 2000-2008 (2005=100).PNG title=Wholesale and retail trade turnover and volumes of sales - monthly data - (2005=100) (NACE Rev. 2)|code=sts_trtu_m title=Other services turnover index - monthly data - (2005=100) (NACE Rev. 2)|code=sts_setu_m ...(600 × 284 (10 KB)) - 11:30, 26 April 2010
File:Annual growth rates for the index of turnover, selected services (1), 2007-2008 (%).PNG title=Other services turnover index - annual data - (2005=100) (NACE Rev. 2)|code=sts_setu_a title=Wholesale and retail trade turnover and volumes of sales - annual data - (2005=100) (NACE Rev. 2)|code=sts_trtu_a ...(623 × 564 (34 KB)) - 11:20, 26 April 2010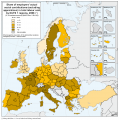
File:Share of employers actual social contributions (excluding apprentices) in total labour cost, by NUTS 1 regions, 2008.PNG title=Structure of labour cost as % of total cost - Nace Rev. 2 (Source LCS 2008)|code=lc_n08struc_r2 title=Structure of labour cost as % of total cost - Nace Rev. 1.1 (Source LCS 2008)|code=lc_n08struc_r1 ...(810 × 816 (172 KB)) - 10:02, 4 February 2013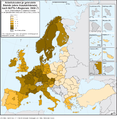
File:Hourly labour cost (excluding apprentices), by NUTS 1 regions, 2008-de.PNG in Vollzeitäquivalenten in der gewerblichen Wirtschaft (NACE Rev. 2 B bis N)) - Quelle: Eurostat (online Datenkode: lc_r08cost_r2 und lc_n08cost_r1) ...(1,217 × 1,243 (294 KB)) - 13:38, 6 February 2012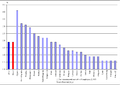
File:Job vacancy rate, 2007 (1)(%).PNG title=Job vacancy statistics, annual data - NACE Rev. 1.1|code=jvs_a_nace1 ...(902 × 640 (12 KB)) - 14:43, 22 September 2009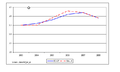
File:Job vacancy rate (1)(%).PNG title=Job vacancy statistics, annual data - NACE Rev. 1.1|code=jvs_a_nace1 ...(725 × 432 (5 KB)) - 14:40, 22 September 2009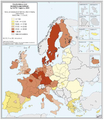
File:Hourly labour cost (excluding apprentices), by NUTS 1 regions, 2004 Euro, per employee in full-time units in industry and services (NACE Rev. 1.1 C to K).PNG :per employee in full-time units in industry and services (NACE Rev. 1.1 C to K) ==Map created with data from March 2008== ...(752 × 869 (465 KB)) - 12:04, 9 October 2009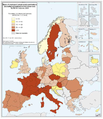
File:Share of employers’ actual social contributions (excluding apprentices) in total labour cost, by NUTS 1 regions, 2004 Percentage, in industry and services (NACE Rev. 1.1 C to K).PNG :by NUTS 1 regions, 2004 Percentage, in industry and services (NACE Rev. 1.1 C to K) ==Map created with data from March 2008== ...(752 × 872 (466 KB)) - 15:17, 9 October 2009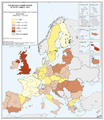
File:Average hours actually worked, by NUTS 1 regions, 2004 Yearly average per person in full-time unit in industry and services (NACE Rev. 1.1 C to K).PNG :Yearly average per person in full-time unit in industry and services (NACE Rev. 1.1 C to K) ==Map created with data from March 2008== ...(753 × 871 (461 KB)) - 15:14, 9 October 2009
File:Human resources in science and technology (1), 2004-2007.PNG title=Annual data on HRST and sub-goups, employed, by sector of economic activity (1994-2008, NACE Rev. 1.1)|code=hrst_st_nocc ...(627 × 607 (35 KB)) - 11:11, 26 November 2010
,_by_NUTS_1_regions,_2008.PNG)
.PNG)

_(%25_of_enterprises).PNG)
_(%25_of_enterprises).PNG)
.PNG)
_(%25).PNG)
,_2004-2008_(%25).PNG)
_(%25).PNG)
.PNG)
,_2000-2008_(2005%3D100).PNG)
,_2007-2008_(%25).PNG)
_in_total_labour_cost,_by_NUTS_1_regions,_2008.PNG)
,_by_NUTS_1_regions,_2008-de.PNG)
(%25).PNG)
(%25).PNG)
,_by_NUTS_1_regions,_2004_Euro,_per_employee_in_full-time_units_in_industry_and_services_(NACE_Rev._1.1_C_to_K).PNG)
_in_total_labour_cost,_by_NUTS_1_regions,_2004_Percentage,_in_industry_and_services_(NACE_Rev._1.1_C_to_K).PNG)
.PNG)
,_2004-2007.PNG)