Search results
Page title matches
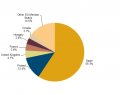
File:Third-country nationals refused entry at the external borders of the most affected EU Member States and other Member States, 2013.png (588 × 467 (15 KB)) - 16:48, 16 November 2014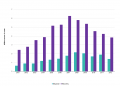
File:F1 EU-27 treatment of hazardous waste shipped out of EU Member States to other EU Member States or out of the EU, 2001 - 2012.png (1,077 × 776 (37 KB)) - 18:35, 27 January 2015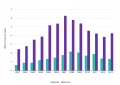
File:EU-28 treatment of hazardous waste shipped out of EU Member States to other EU Member States or out of the EU, 2001-13.png (800 × 565 (17 KB)) - 17:16, 28 January 2016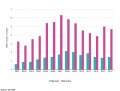
File:EU-28 treatment of hazardous waste shipped out of EU Member States to other EU Member States or out of the EU, 2001-14.png (805 × 613 (26 KB)) - 18:09, 9 December 2016
File:EU-28 treatment of hazardous waste shipped out of EU Member States to other EU Member States or out of the EU, 2001-2015.png (805 × 613 (26 KB)) - 16:03, 6 December 2017
File:EU-28 treatment of hazardous waste shipped out of EU Member States to other EU Member States or out of the EU, 2001-2016.png (805 × 672 (36 KB)) - 20:09, 19 February 2019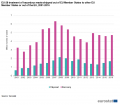
File:EU-28 treatment of hazardous waste shipped out of EU Member States to other EU Member States or out of the EU, 2001-2016lb.png (805 × 707 (54 KB)) - 22:01, 12 March 2019
File:EU-27 treatment of hazardous waste shipped out of EU Member States to other EU Member States or out of the EU.png (537 × 272 (3 KB)) - 12:16, 13 February 2012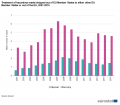
File:Treatment of hazardous waste shipped out of EU Member States to either other EU Member States or out of the EU, 2001-2015.png (805 × 707 (35 KB)) - 14:22, 5 March 2018
File:Difficulties experienced when making web sales to other EU Member States, EU-28, 2016 (% of enterprises with web sales to other EU Member States) FP18.png (1,005 × 664 (21 KB)) - 18:29, 23 March 2018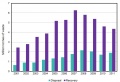
File:EU-27 treatment of hazardous waste shipped out of EU Member States to other EU Member States or out of the EU 2001 to 2010.JPG (1,086 × 742 (77 KB)) - 13:57, 25 November 2013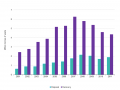
File:EU-27 treatment of hazardous waste shipped out of EU Member States to other EU Member States or out of the EU 2001 to 2010.png (800 × 603 (24 KB)) - 10:25, 23 December 2013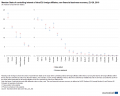
File:Member State of controlling interest of intra-EU foreign affiliates, non-financial business economy, EU-28, 2016 (% of total for all EU Member States) GL2019.png (1,024 × 821 (43 KB)) - 16:59, 21 August 2019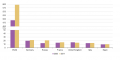
File:GDP at PPP of Russia and top 5 EU Member States in relation to the United States, by country, 2005 and 2011.png (854 × 427 (12 KB)) - 14:15, 8 July 2015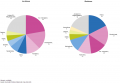
File:Share of EU Member States in international trade in services with non-member countries (extra-EU), 2016 (% of EU-28 total) YB17-de.png (1,070 × 744 (34 KB)) - 11:25, 2 November 2017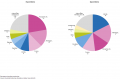
File:Share of EU Member States in international trade in services with non-member countries (extra-EU), 2016 (% of EU-28 total) YB17-fr.png (1,127 × 744 (34 KB)) - 11:35, 2 November 2017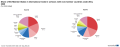
File:Share of EU Member States in international trade in services with non-member countries (extra-EU), 2020 (% of EU total) F3 new .png (2,221 × 875 (261 KB)) - 16:32, 28 January 2022
File:Share of EU Member States in international trade in services with non-member countries (extra-EU), 2015 (% of EU-28 total) YB16.png (1,198 × 747 (39 KB)) - 16:21, 26 April 2017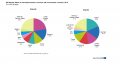
File:Share of EU Member States in international trade in services with non-member countries (extra-EU), 2016 (% of EU-28 total).png (1,565 × 824 (72 KB)) - 16:31, 18 March 2019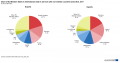
File:Share of EU Member States in international trade in services with non-member countries (extra-EU), 2017 (% of EU-28 total).png (1,160 × 605 (58 KB)) - 13:13, 19 March 2019


_FP18.png)


_GL2019.png)

,_2016_(%25_of_EU-28_total)_YB17-de.png)
,_2016_(%25_of_EU-28_total)_YB17-fr.png)
,_2015_(%25_of_EU-28_total)_YB16.png)
,_2016_(%25_of_EU-28_total).png)
,_2017_(%25_of_EU-28_total).png)
Page text matches
File:Extra-EU-28 trade in chemicals, EU Member States, 2003 and 2011 13.png File:Extra-EU-28 trade in chemicals, EU Member States, 2007 and 2014-16.png ...(1,230 × 603 (69 KB)) - 15:41, 15 May 2017
File:Business economy overview. Three most specialised Member States, 2007 (%, specialisation relative to the EU-27).PNG Business economy overview. Three most specialised Member States, 2007 (%, specialisation relative to the EU-27) ...(1,132 × 430 (60 KB)) - 11:04, 24 December 2010
File:Naturalisation rate at EU-27 Member States level(¹) by sex, in 2013 (%).png Naturalisation rate at EU-27 Member States level(¹) by sex, in 2013 (%) ...(805 × 392 (23 KB)) - 16:11, 26 April 2016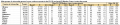
File:PermitsCitiz10.PNG Main groups of citizenship granted a new residence permit in the EU-28 and main EU Member States issuing the permit, 2013 ...(905 × 190 (9 KB)) - 15:11, 17 October 2014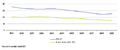
File:Price convergence between EU Member States (%, coefficient of variation of comparative price levels of final consumption by private households including indirect taxes).png ==Price convergence between EU Member States== :(%, coefficient of variation of comparative price levels of final consumption by private households ...(547 × 230 (3 KB)) - 11:28, 12 April 2011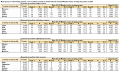
File:PermitsCitizReason10.PNG Main groups of citizenship granted a new residence permit in the EU-28 and main EU Member States issuing the permit, by reason, 2013 ...(905 × 546 (21 KB)) - 15:16, 17 October 2014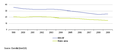
File:Price convergence between EU Member States 1998-2008 (%, coefficient of variation of comparative price levels of final consumption by private households including indirect taxes).PNG ==Price convergence between EU Member States 1999-2009== :(%, coefficient of variation of comparative price levels of final consumption by private ...(582 × 243 (4 KB)) - 11:10, 11 October 2010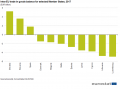
File:Intra-EU trade in goods balance for selected Member States, 2017 (EUR billion).png File:Intra-EU trade in goods balance for selected Member States, 2016 (EUR billion).png ...(842 × 621 (62 KB)) - 11:34, 12 March 2018
File:Main groups of citizenship granted a first residence permit in the EU-28 and main EU Member States issuing the permit, in 2014.png Main groups of citizenship granted a first residence permit in the EU-28 and main EU Member States issuing the permit, in 2014 ...(925 × 293 (29 KB)) - 19:14, 16 October 2015
File:Main groups of citizenship granted a first residence permit in the EU-28 and main EU Member States issuing the permit, in 2014 V1.png Main groups of citizenship granted a first residence permit in the EU-28 and main EU Member States issuing the permit, in 2014 ...(925 × 293 (29 KB)) - 14:46, 19 October 2015
File:Main groups of citizenship granted a first residence permit in the EU-28 and main EU Member States issuing the permit, by reason, in 2014.png Main groups of citizenship granted a first residence permit in the EU-28 and main EU Member States issuing the permit, by reason, in 2014 ...(925 × 787 (69 KB)) - 19:13, 16 October 2015
File:Main groups of citizenship granted a first residence permit in the EU-28 and main EU Member States issuing the permit, by reason, in 2014 V1.png Main groups of citizenship granted a first residence permit in the EU-28 and main EU Member States issuing the permit, by reason, in 2014 ...(925 × 787 (68 KB)) - 14:58, 19 October 2015
File:Total livestock density, 2016 (LSU per ha UAA).xlsx Interactive figure on total livestock density in the EU-28 and the Member States, 2016 ...(13 KB) - 20:11, 31 January 2019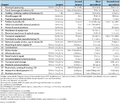
File:Business economy overview. Largest and most specialised Member States (on the basis of value added for sectoral chapter headings and value added specialisation ratios relative to the EU-27 for sectoral chapter headings), 2006 (1).PNG Business economy overview. Largest and most specialised Member States (on the basis of value added for sectoral chapter headings and value added ...(1,132 × 967 (135 KB)) - 12:34, 23 December 2010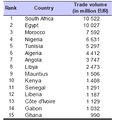
File:Top 15 African partners in trade in services with EU-27, 2008.PNG ==Top 15 African partners in trade in services with EU-27, 2008== ... title=Total services, detailed geographical breakdown by EU Member ...(320 × 323 (12 KB)) - 15:40, 10 January 2011
File:Minimum wages in EU Member States, Turkey and the USA.PNG ==Minimum wages in EU Member States, Croatia, Turkey and the USA== ==Graph created with data from June 2010== ...(977 × 561 (33 KB)) - 09:53, 9 July 2010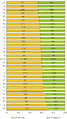
File:HRST by age group, EU member states and selected countries, 2006.PNG : EU member states and selected countries 2006 ==Graph created with data from August 2008== ...(1,031 × 1,829 (101 KB)) - 14:48, 2 October 2009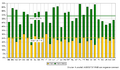
File:Old age dependency ratio for the EU Member States, Norway and Switzerland - 2008, 2060.PNG == Old age dependency ratio for the EU Member States== :Norway and Switzerland - 2008, 2060 ==Graph created with data from June 2008== ...(756 × 442 (26 KB)) - 11:42, 6 October 2009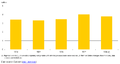
File:Migration flows 2004-2008.png ==Total immigrants to EU Member States, 2004-2008== ==Figure created with data from October 2010== == Most recent data available now, see: == ...(854 × 453 (6 KB)) - 18:13, 17 December 2010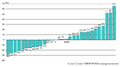
File:Projected total population change over the projection period 2008-2060 (2008=100) for the EU Member States, Norway and Switzerland.PNG :EU Member States, Norway and Switzerland ==Graph created with data from June 2008== ...(760 × 422 (15 KB)) - 11:09, 6 October 2009

_by_sex,_in_2013_(%25).png)
.png)

.PNG)
.png)


,_2006_(1).PNG)


_for_the_EU_Member_States,_Norway_and_Switzerland.PNG)
,_2020_(%25_of_EU_total)_F3_new_.png)
.PNG)
.png)