Search results
Page title matches

File:T8 Extra EU-28 Export of potatoes, 2014 (1 000 EUR, 1 000 tonnes) (1 000 EUR, 1 000 tonnes) .png (715 × 573 (29 KB)) - 09:37, 10 May 2016
File:Infant mortality (1)(per 1 000 live births).PNG :(per 1 000 live births) == Source data from September 2008== == Most recent data, see: == title=Infant mortality rates|code=demo_minfind ...(664 × 308 (26 KB)) - 14:12, 17 September 2009
File:Air freight transport, 2007 (1)(1 000 tonnes).PNG :(1 000 tonnes) ==Graph created with data from September 2008== ... {{Stable link|title=Air transport of goods - (1 000 t) |code=ttr00011}} ...(676 × 326 (24 KB)) - 15:33, 15 October 2009
File:Air freight transport, 2008 (1) (1 000 tonnes).PNG ==Air freight transport, 2008 (1)== :(1 000 tonnes) ==Graph created with data from September 2009== ==Most recent data available now, see:== ...(670 × 294 (22 KB)) - 11:50, 6 April 2010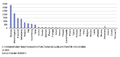
File:Air freight transport, 2009 (1) (1 000 tonnes).png (547 × 260 (6 KB)) - 19:37, 14 December 2010
File:Trade in services (1) (EUR 1 000 million).png (107 KB) - 17:04, 5 December 2011
File:Population, EU-27 (1) (at 1 January, million).png ==Population, EU-27 (1)== : (at 1 January, million) ==Figure created with data from September 2011== ==Most recent data available now, see:== ...(532 × 233 (2 KB)) - 14:36, 17 October 2011
File:Production of grapes, 2012 (1) (1 000 tonnes) AgriPB13.png (1,005 × 635 (16 KB)) - 13:22, 28 October 2013
File:Protected marine area, 2010 (1) (1 000 km²) YB14.png (1,005 × 441 (17 KB)) - 08:47, 26 February 2014
File:Air freight transport, 2012 (1) (1 000 tonnes) YB14.png (1,005 × 422 (12 KB)) - 12:14, 11 March 2014
File:Immigrants, 2012 (1) (per 1 000 inhabitants) YB14 II.png (989 × 445 (22 KB)) - 11:14, 8 May 2014
File:EUROPOP2023 Table 1 Demographic balances, 1 January 2022-2100.png null ...(1,233 × 1,068 (709 KB)) - 11:00, 13 April 2023File:STS covid services figures 1 - 3 table 1-update.xls (431 KB) - 12:47, 19 June 2020
File:Immigrants, 2009 (1) (per 1 000 inhabitants).png (545 × 295 (6 KB)) - 19:52, 25 November 2011
File:Immigrants, 2009 (1) (per 1 000 inhabitants)-de.png Abbildung 1: Einwanderer, 2009 (1)(pro Tsd. Einwohner) - Quelle: Eurostat title=|code=migr_imm1ctz und title=|code=migr_pop1ctz ...(567 × 351 (11 KB)) - 15:51, 2 July 2012
File:Immigrants, 2009 (1) (per 1 000 inhabitants)-fr.png Graphique 1: Immigrants, 2009 (1)(pour 1 000 habitants) - Source: Eurostat title=|code=migr_imm1ctz et title=|code=migr_pop1ctz ...(564 × 324 (10 KB)) - 14:20, 3 July 2012
File:Immigrants, 2010 (1) (per 1 000 inhabitants).png (523 × 290 (10 KB)) - 10:51, 4 February 2013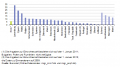
File:Immigrants, 2010 (1) (per 1 000 inhabitants)-de.png (523 × 290 (11 KB)) - 11:49, 22 July 2013
File:Immigrants, 2010 (1) (per 1 000 inhabitants)-fr.png (523 × 290 (10 KB)) - 13:40, 22 July 2013
File:Immigrants, 2011 (1) (per 1 000 inhabitants) YB14.png (1,005 × 542 (25 KB)) - 16:00, 4 December 2013
_(1_000_EUR,_1_000_tonnes)_.png)
(per_1_000_live_births).PNG)
(1_000_tonnes).PNG)
_(1_000_tonnes).PNG)
_(1_000_tonnes).png)
_(EUR_1_000_million).png)
_(at_1_January,_million).png)
_(1_000_tonnes)_AgriPB13.png)
_(1_000_km%C2%B2)_YB14.png)
_(1_000_tonnes)_YB14.png)
_(per_1_000_inhabitants)_YB14_II.png)

_(per_1_000_inhabitants).png)
_(per_1_000_inhabitants)-de.png)
_(per_1_000_inhabitants)-fr.png)
_(per_1_000_inhabitants).png)
_(per_1_000_inhabitants)-de.png)
_(per_1_000_inhabitants)-fr.png)
_(per_1_000_inhabitants)_YB14.png)
Page text matches

File:Population, EU-27, 1960-2011 (1) (at 1 January, million persons)-de.png Abbildung 1: Gesamtbevölkerung, EU-27, 1960-2011 (1)(Stand 1. Januar, in Mio.) - Quelle: Eurostat title=|code=demo_gind ...(573 × 237 (6 KB)) - 15:56, 25 June 2012
File:National and international road transport of goods, 2010 (1) (% based on million tkm of laden transport)-de.png Abbildung 1: Nationaler und internationaler Straßengüterverkehr, 2010 (1)(in % auf Basis von 1 Mio. tkm geladene Güter) – Quelle: Eurostat ...(573 × 335 (14 KB)) - 14:28, 27 September 2012
File:Students in tertiary education, by field of education and gender, EU-27, 2009 (1) (1 000)-de.png Abbildung 1: Studierende im Bereich der tertiären Bildung nach Studienfächern und Geschlecht, EU-27, 2009 (1)(1 000) – Quelle: Eurostat ...(573 × 207 (7 KB)) - 16:41, 31 August 2012
File:Exchange rates against the euro, 2001-2010 (1) (1 EUR=… national currency)-de.png Tabelle 1: Wechselkurse gegenüber dem Euro, 2001-2010 (1)(1 EUR = ... Landeswährung) – Quelle: Eurostat title=|code=tec00033 und ...(602 × 355 (26 KB)) - 09:02, 7 September 2012File:Immigrants, 2009 (1) (per 1 000 inhabitants)-fr.png Graphique 1: Immigrants, 2009 (1)(pour 1 000 habitants) - Source: Eurostat title=|code=migr_imm1ctz et title=|code=migr_pop1ctz ...(564 × 324 (10 KB)) - 14:20, 3 July 2012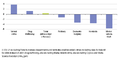
File:CRIME STATISTICS Figure 1.png Figure 1: Recorded crimes, EU-27, 2000-2007 (1) (%, average annual change) ...(548 × 276 (5 KB)) - 18:27, 20 October 2010
File:Exchange rates against the euro, 2001-2010 (1) (1 EUR=… national currency)-fr.png Tableau 1: Taux de change par rapport à l’euro, 2001-2010 (1)(1 EUR=… monnaie nationale) - Source: Eurostat title=|code=tec00033 ...(618 × 355 (26 KB)) - 09:10, 7 September 2012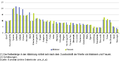
File:Unemployment rate, 2010 (1) (%)-de.png Abbildung 1: Arbeitslosenquote, 2010 (1) (in %) - Quelle: Eurostat title=|code=une_rt_a ...(573 × 292 (11 KB)) - 12:31, 31 July 2012
File:Fishing fleet, 2010 (1)-de.png Abbildung 1: Fischereiflotte, 2010 (1) – Quelle: Eurostat title=|code=fish_fleet ...(573 × 292 (11 KB)) - 14:30, 22 July 2013
File:Current healthcare expenditure, 2009 (1)-de.png Abbildung 1: Laufende Gesundheitsausgaben, 2009 (1) – Quelle: Eurostat title=|code=hlth_sha_hf ...(573 × 338 (14 KB)) - 09:52, 30 July 2013
File:Fishing fleet, 2010 (1)-fr.png Graphique 1: Flotte de pêche, 2010 (1) - Source: Eurostat title=|code=fish_fleet ...(573 × 335 (12 KB)) - 16:42, 7 September 2012
File:Current healthcare expenditure, 2009 (1)-fr.png Graphique 1: Dépenses de santé courantes, 2009 (1) - Source: Eurostat title=|code=hlth_sha_hf ...(573 × 339 (14 KB)) - 09:26, 30 July 2013
File:Unemployment rate, 2010 (1) (%)-fr.png Graphique 1: Taux de chômage, 2010 (1)(en %) - Source: Eurostat title=|code=une_rt_a ...(573 × 307 (11 KB)) - 13:05, 1 August 2012
File:Researchers, by institutional sector, 2009 (1)-fr.png Tableau 1: Chercheurs, par secteur institutionnel, 2009 (1) - Source: Eurostat title=|code=tsc00004 ...(528 × 611 (37 KB)) - 12:33, 11 September 2012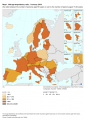
File:Map 1 OADR 2019.png Map 1: Old-age dependency ratio, 1 January 2019 (%) Source: Eurostat (online data code: proj_19ndbi) ...(1,348 × 1,908 (408 KB)) - 13:23, 15 September 2020
File:Immigration by main citizenship group, 2009 (1)-de.png Tabelle 1: Einwanderung nach den wichtigsten Staatsangehörigkeitsgruppen, 2009 (1) - Quelle: Eurostat title=|code=migr_imm1ctz ...(696 × 533 (40 KB)) - 08:15, 13 July 2012
File:Researchers, by institutional sector, 2009 (1)-de.png Tabelle 1: Forscher nach institutionellen Sektoren, 2009 (1) – Quelle: Eurostat title=|code=tsc00004 ...(550 × 611 (38 KB)) - 12:25, 11 September 2012
File:Immigration by main citizenship group, 2009 (1)-fr.png Tableau 1: Immigration par grand groupe de nationalités, 2009 (1) - Source: Eurostat title=|code=migr_imm1ctz ...(675 × 533 (39 KB)) - 16:02, 13 July 2012
File:Public expenditure on education, 2008 (1) (% of GDP)-fr.png Graphique 1: Dépenses publiques d’éducation, 2008 (1)(en % du PIB) - Source: Eurostat title=|code=tsiir010 ...(573 × 331 (12 KB)) - 16:36, 31 August 2012
File:Median gross annual earnings of full-time employees, 2006 (1) (EUR)-de.png.PNG Abbildung 1: Mittlere durchschnittliche jährliche Bruttoverdienste Vollzeitbeschäftigter, 2006 (1)(in EUR) - Quelle: Eurostat title=|code=earn_ses_a ...(611 × 364 (15 KB)) - 11:17, 22 August 2012
_(at_1_January,_million_persons)-de.png)
_(%25_based_on_million_tkm_of_laden_transport)-de.png)
_(1_EUR%3D%E2%80%A6_national_currency)-de.png)

_(1_EUR%3D%E2%80%A6_national_currency)-fr.png)
_(%25)-de.png)
-de.png)
-de.png)
-fr.png)
-fr.png)
_(%25)-fr.png)
-fr.png)

-de.png)
-de.png)
-fr.png)
_(%25_of_GDP)-fr.png)
_(EUR)-de.png.PNG)
_(1_000)-de.png)