Search results
Page title matches
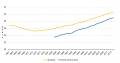
File:Figure 8 Evolution of median age of mothers at birth in Austria 2000-2014 half of mothers are younger, half of mothers are older.png (761 × 399 (17 KB)) - 15:25, 19 January 2016
File:Average distance on which goods are carried, 2016.png (865 × 459 (16 KB)) - 11:59, 30 November 2017
File:Average distance on which goods are carried, 2010 - kilometres.PNG (841 × 467 (19 KB)) - 11:00, 18 October 2011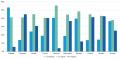
File:Number of regions to which manufacturing enterprises are exporting.png (1,000 × 491 (24 KB)) - 10:42, 21 November 2014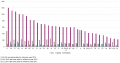
File:Average distance on which goods are carried, 2012 (km).png (835 × 436 (12 KB)) - 15:35, 31 July 2013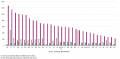
File:Average distance on which goods are carried, 2013 (km).png (856 × 421 (24 KB)) - 15:27, 30 October 2014
File:Prisoners who are citizens of the reporting country 2008–2013.PNG (910 × 771 (65 KB)) - 09:21, 9 December 2015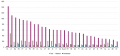
File:Average distance on which goods are carried, 2014 (km).png (816 × 383 (8 KB)) - 12:25, 5 January 2016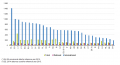
File:Average distance on which goods are carried, 2015 (kilometres).png (851 × 459 (22 KB)) - 12:33, 4 November 2016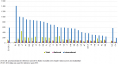
File:Average distance on which goods are carried, 2015 (kilometres) F7.png (1,063 × 564 (35 KB)) - 11:29, 11 January 2017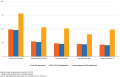
File:Share of enterprises that are innovative, EU-28, 2012–2014 (%) YB17.png (1,005 × 647 (24 KB)) - 09:18, 31 March 2017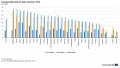
File:Young people who are daily smokers, 2014 (% share) BYIE18.png (1,005 × 570 (60 KB)) - 13:29, 25 April 2018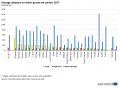
File:Average distance on which goods are carried, 2017 (kilometres).png (805 × 591 (28 KB)) - 14:24, 27 August 2018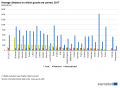
File:Average distance on which goods are carried, 2017 (kilometres)-up.png (805 × 591 (28 KB)) - 10:18, 12 November 2018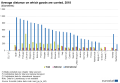
File:Average distance on which goods are carried, 2018 (kilometres).png (1,000 × 695 (61 KB)) - 12:26, 14 January 2020
File:Average distance on which goods are carried for total transport - kilometres.PNG (577 × 592 (21 KB)) - 10:59, 18 October 2011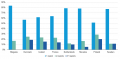
File:Number of regions to which manufacturing enterprises are sourcing internationally .png (801 × 394 (20 KB)) - 10:26, 21 November 2014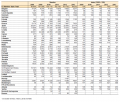
File:Prisoners who are foreign citizens in the reporting country 2008–2013.PNG (906 × 771 (63 KB)) - 09:22, 9 December 2015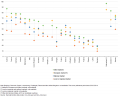
File:Share of enterprises that are innovative, by largest market, 2012–2014 (%) YB17.png (1,005 × 808 (37 KB)) - 09:18, 31 March 2017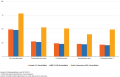
File:Share of enterprises that are innovative, EU-28, 2012–2014 (%) YB17-de.png (1,005 × 647 (25 KB)) - 11:20, 10 August 2017


.png)
.png)

.png)
.png)
_F7.png)
_YB17.png)
_BYIE18.png)
.png)
-up.png)
.png)


_YB17.png)
_YB17-de.png)
Page text matches
File:Social awareness of the agrarian landscape, EU 27, NUTS 2 .jpg For the sub-component “rural tourism”, FSS data are missing for Eastern and South Western Scotland, Highlands and Islands ... FADN data are not available or incomplete for Spain, Romania and Bulgaria. == Map created with data from 1996 - 2005 == ...(4,094 × 5,786 (3.69 MB)) - 12:35, 14 November 2012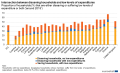
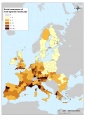
File:Dissaving households and low levels of expenditures 2015.png Proportion of households that are either dissaving or suffering low levels of expenditure or both ('around 2015'). ...(856 × 524 (78 KB)) - 16:35, 31 March 2023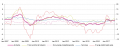
File:Euro area annual inflation and its main components, January 2007-November 2017.png The file has the same contents given that the estimates and the real data are equal. ...(767 × 308 (27 KB)) - 12:28, 18 December 2017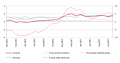
File:Euro area annual inflation and its main components (%), December 2015-November 2017.png The file has the same contents given that the estimates and the real data are equal. ...(676 × 354 (47 KB)) - 12:29, 18 December 2017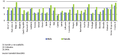
File:Persons living in jobless households, by gender, 2007 (1)(% of respective gender aged 18-59 who are living in households where no-one works).PNG :% of respective gender aged 18-59 who are living in households where no-one works ==Graph created with data from September 2008== ... title=Jobless households by gender - Share of persons aged 18 - 59 who are living in households where no-one works|code=tsisc090 ...(685 × 322 (22 KB)) - 10:32, 8 October 2009
File:List of 63 targeted habitat types of Annex I of the Habitats Directive which are dependent on, or associated with a continuation of extensive agricultural practices. .png == List of 63 targeted habitat types of Annex I of the Habitats Directive which are dependent on, or associated with a continuation of extensive agricultural practices. == ...(1,160 × 682 (58 KB)) - 17:30, 12 December 2012
File:List of 63 targeted habitat types of Annex I of the Habitats Directive which are dependent on, or associated with a continuation of extensive agricultural practices .png == List of 63 targeted habitat types of Annex I of the Habitats Directive which are dependent on, or associated with a continuation of extensive agricultural practices == ...(1,161 × 630 (57 KB)) - 17:37, 12 December 2012
File:Crimes recorded by the police - Total crime.PNG These figures include offences against the penal (or criminal) code. Less serious crimes (misdemeanours) are generally excluded. For exceptions to the standard definition, see the metadata files on the website. ...(709 × 935 (80 KB)) - 12:16, 17 June 2009
File:Total number of end of life vehicles ELV2006to2010.PNG The environmental impacts caused by the generation and treatment of waste are raising serious concerns. As waste generation ... for ELV enables different approaches to demonstrate that the targets are met. Thus not all detailed figures reported by the countries ...(508 × 688 (34 KB)) - 13:56, 25 September 2013
File:ESAW nbr all accidents2008.png Number of serious and fatal accidents at work happening in the EU in 2008. Data cover all economic activities for which data are available. Include accidents of male and female workers. ...(463 × 681 (16 KB)) - 18:31, 19 October 2011
File:Top 20 extra-EU-27 maritime transport trades (1) by gross weight of goods handled in EU-27 main ports during the 2nd quarter 2010.PNG impact on the maritime route followed. For example, the ports of the USA are grouped in two geographical areas: "East coast" ... :3. Type of cargo: the following thirteen cargo types are used in Table 4: liquefied gas, crude oil, oil products, other liquid ...(952 × 489 (53 KB)) - 12:18, 2 March 2011
File:Share of holdings with manure storage facilties for slurry which are covered EU-28, IS, NO, CH and ME, 2010.png == Share of holdings with manure storage facilties for slurry which are covered EU-28, IS, NO, CH and ME, 2010 == == Figure created with data from 2010 == == Data extracted at 12-09-2013, most recent data available now, see: == * code=ef_pmmanstoaa|title=ef_pmmanstoa ...(1,095 × 683 (16 KB)) - 15:27, 24 September 2013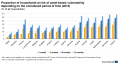
File:Proportion of households at risk of asset-based vulnerability.png data from the Eurosystem Household Finance and Consumption Survey. These data are only available for countries having conducted the 2014 wave of the survey. The HFCS is run by the National Central Banks of the Euro area and coordinated by the European Central Bank. ...(1,000 × 535 (66 KB)) - 14:34, 7 October 2020
File:Examples of map definitions in Excel NUTS 2010 updated 25012013.xls regions for Serbia has not yet been agreed, only the country code are used on all levels for the moment (January 2013). ...(309 KB) - 11:50, 25 January 2013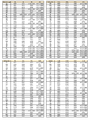
File:Years in which selected indicators' thresholds are crossed (projected years in italics).PNG ==Years in which selected indicators' thresholds are crossed== :(projected years in italics) ==Table created with data from April 2011== ...(838 × 1,107 (133 KB)) - 16:41, 9 June 2011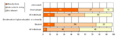
File:E-government participation by types of services and population group in EU-27, 2006.png With which of the following matters are you already dealing via Internet or would you like to deal via Internet? [ Scope: individuals ... The respondents who showed interest in e-government are asked for the types of services they would like to deal with on-line ...(626 × 203 (3 KB)) - 10:06, 16 October 2009


,_December_2015-November_2017.png)
(%25_of_respective_gender_aged_18-59_who_are_living_in_households_where_no-one_works).PNG)


_by_gross_weight_of_goods_handled_in_EU-27_main_ports_during_the_2nd_quarter_2010.PNG)


.PNG)