Search results
Page title matches
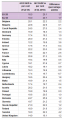
File:GFCF as percentage of GDP in ESA 95 and ESA 2010.png Table 3 ...(368 × 688 (27 KB)) - 11:42, 23 February 2015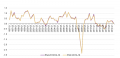
File:ESA 2010 versus ESA 95 GDP growth rates for EA18 1997Q1 to 2014Q2.png (800 × 387 (33 KB)) - 16:30, 16 October 2014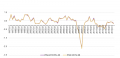
File:ESA 2010 versus ESA 95 GDP growth rates for EU-28 1997Q1 to 2014Q2.png (800 × 387 (28 KB)) - 16:36, 16 October 2014
File:Overview on changes between ESA 2010 and ESA 95 growth rates and levels new.png (598 × 203 (14 KB)) - 16:43, 16 October 2014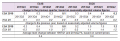
File:Overview on changes between ESA 2010 and ESA 95 growth rates and levels.png (598 × 203 (14 KB)) - 16:41, 16 October 2014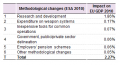
File:ESA 2010 - methodological changes.png (373 × 203 (10 KB)) - 11:14, 5 February 2015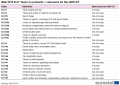
File:ESA 2010 D.21 Taxes on products ꟷ relevance for the HICP-CT.png (837 × 596 (35 KB)) - 18:52, 25 March 2022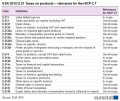
File:ESA 2010 D.21 Taxes on products ꟷ relevance for the HICP-CT-v1.png (606 × 510 (23 KB)) - 11:59, 19 February 2024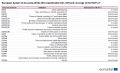
File:European System of Accounts (ESA) 2010 classification D21, D29 and coverage of the HICP-CT.png (876 × 533 (49 KB)) - 11:49, 7 February 2019
File:European System of Accounts (ESA) 2010 classification D21, D29 and coverage of the HICP-CT 2019.png (876 × 516 (52 KB)) - 14:52, 27 February 2020


_2010_classification_D21,_D29_and_coverage_of_the_HICP-CT.png)
_2010_classification_D21,_D29_and_coverage_of_the_HICP-CT_2019.png)