Archive:Freight transport statistics
- Data from September 2011, most recent data: Further Eurostat information, Main tables and Database.
The ability to move goods safely, quickly and cost-efficiently to markets is important for international trade, national distributive trades, and economic development. This article presents information on the freight transport sector in the European Union (EU), which includes the following transport modes: road, rail, air, maritime and inland waterways.
The rapid increase in global trade up to the onset of the financial and economic crisis and the deepening integration of the enlarged EU, alongside a range of economic practices (including the concentration of production in fewer sites to reap economies of scale, delocalisation, and just-in-time deliveries), may explain the relatively fast growth of freight transport within the EU. In contrast, strains on transport infrastructure (congestion and delays), coupled with constraints over technical standards, interoperability and governance issues may slow down developments within the freight transport sector.
Main statistical findings
(% of total inland tkm) - Source: Eurostat (tsdtr220)
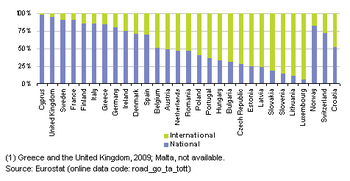
(% based on million tkm of laden transport) - Source: Eurostat (road_go_ta_tott)
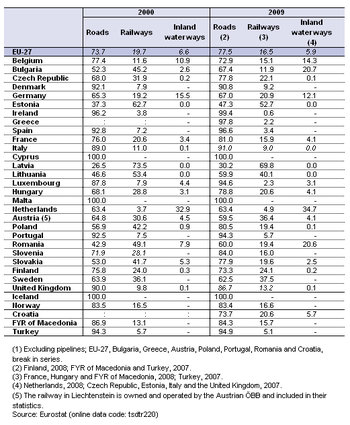
Total inland freight transport in the EU-27 was estimated to be close to 2 200 000 million tonne-kilometres (tkm) in 2009; a little over three quarters (77.5 %) of this freight total was transported over roads in 2009 (see Table 1). The relative importance of road freight transport, as a share of total inland freight transport, rose by 3.8 percentage points between 2000 and 2009. The volume of inland freight transported by road was a little over four times as high as the volume transported by rail (16.5 % of inland freight transported in the EU-27 in 2009), while the remainder (5.9 %) of the freight transported in the EU-27 was carried along inland waterways. It should be noted that this analysis refers only to inland freight transport and that considerable volumes of freight may be transported by maritime freight services and for some product groups by air transport or by pipelines.
The relative ascendancy of road freight transport was common in most of the Member States, with the exception of the Baltic Member States, Austria and Sweden, where at least one third of the inland freight transported took place on the railways in 2009; in Latvia and Estonia a majority of inland freight was transported by rail, 69.8 % and 52.7 % respectively. More than 10 % of total inland freight was transported on the inland waterways of Belgium and Germany in 2009, with this share increasing to just over 20 % in Bulgaria and Romania and to more than one third (34.7 %, 2008) of the total in the Netherlands.
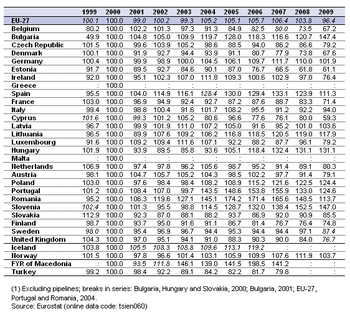
The volume of EU-27 inland freight transport grew at a slower pace than constant price GDP during the period from 2000 to 2009; this can be seen from the index shown in Table 2, as the index value in 2009 was 3.6 % lower than in 2000. Nevertheless, it should be noted that this was in large part due to the results for 2008 and 2009 when the index level fell sharply and that prior to this in 2007 the index had shown the volume of inland freight transport increasing more than GDP. Bulgaria and Slovenia recorded the greatest increase in inland freight transport relative to GDP, with their respective indices close to 50 % higher in 2009 than they had been in 2000. In contrast, the ratio of freight transport to GDP fell at its most rapid pace between 2000 and 2009 in Cyprus and Estonia, in both cases down by around two fifths.
Road freight
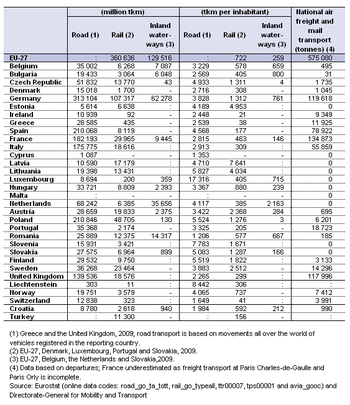
Relative to the size of their respective populations, the greatest volume of road freight transport was reported for Luxembourg, over 17 000 tonne-kilometres per inhabitant in 2010, around 2.2 times the next highest volume in Slovenia; in both cases, the vast majority of this road freight transportation was international, performed by vehicles registered in each of these Member States. Indeed, it is important to note that road freight statistics are generally based on movements in the registration country or abroad, of vehicles registered in the reporting country (‘nationality principle’).
Slightly more than two thirds of the goods transported on the EU-27’s roads in 2010 related to the transportation of goods on national road networks. However, this proportion varied considerably between the Member States (see Figure 1): the highest proportion of national road freight transport was in the islands of Cyprus (98.1 %) and the United Kingdom (94.3 % in 2009), while the relative importance of national freight was much lower in Slovakia (18.9 %), Slovenia (14.4 %), Lithuania (11.8 %) and Luxembourg (6.6 %). For most freight hauliers registered in the EU, international road freight transport mostly relates to exchanges with other EU Member States (intra-EU partners).
Air freight
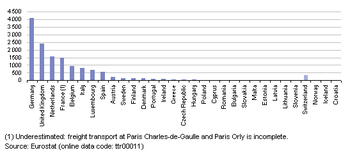
About 14.2 million tonnes of air freight (both national and international) was carried through airports within the EU-27 in 2010 (see Figure 2). Airports in Germany dealt with 4.1 million tonnes of air freight, considerably more than in any other EU Member State – the United Kingdom had the second highest amount of air freight at 2.4 million tonnes. Some of the smaller Member States are relatively specialised in air freight, notably all of the Benelux countries, and in particular, Luxembourg (which ranked as the seventh largest air freight transporter among the EU Member States).
Maritime freight
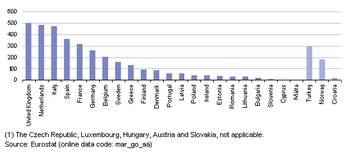
Maritime ports in the EU-27 handled 3 445 million tonnes of seaborne goods in 2009, which marked a reduction of 12.1 % when compared with 2008. Sea ports in the United Kingdom handled 501 million tonnes of goods in 2009, more than any other Member State and equivalent to 14.5 % of the EU-27 total. Among the smaller Member States, the quantity of goods handled in maritime ports of the Netherlands, Belgium and the Nordic Member States was particularly high (see Figure 3).
Data sources and availability
The development of freight transport statistics is based upon a raft of framework legislation and implementing legislation, generally broken down according to the mode of transport under consideration.
Information on inland freight transport is available with an annual frequency and the time series generally begin in the early 1990s. The majority of inland freight transport statistics are based on movements in each reporting country, regardless of the nationality of the vehicle or vessel involved (the ‘territoriality principle’). For this reason, the volume measure of tonne-kilometres is generally considered as a more reliable measure, as the use of tonnes entails a higher risk of double-counting, particularly for international transport. The methodology used across the EU Member States is not completely harmonised, for example, road freight statistics are generally based on all movements (in the registration country or abroad) of vehicles registered in the reporting country (the ‘nationality principle’). Therefore, the statistics presented, especially those for the smallest reporting countries, may be somewhat unrepresentative.
The modal split of inland freight transport is based on transportation by road, rail and inland waterways, and therefore excludes air, maritime and pipeline transport. It measures the share of each transport mode in total inland freight transport and is based on the volume of goods transported in tonne-kilometres, in other words, one tonne of goods travelling a distance of one kilometre.
The volume of inland freight transport may also be expressed in relation to gross domestic product (GDP); within this article the indicator is presented in constant prices for the reference year 2000, providing information on the relationship between the demand for freight transport and economic growth, with the series indexed on 2000=100, so that the annual intensity of freight transport demand can be monitored relative to economic developments.
Goods loaded are those goods placed on a road vehicle, a railway vehicle or a merchant ship for dispatch by road, rail or sea. The weight of goods transported by rail and inland waterways is the gross-gross weight. This includes the total weight of the goods, all packaging, and the tare weight of the container, swap-body and pallets containing goods; in the case of rail freight transport, it also includes road goods vehicles that are carried by rail. In contrast, the weight measured for maritime and road freight transport is the gross weight (in other words, excluding the tare weight).
Road freight
Road freight transport statistics are collected under the framework provided by Regulation 1172/98 on statistical returns in respect of the carriage of goods by road, amended by Regulation 399/2009 which details implementing powers conferred on the European Commission. The data are based on sample surveys carried out in the reporting countries and record the transport of goods by road, as undertaken by vehicles registered in each of the Member States. It is important to note that almost all of the Member States apply a cut-off point for carrying capacity under which vehicles are not surveyed; this should not be greater than 3.5 tonnes carrying capacity, or 6 tonnes in terms of gross vehicle weight; some of the Member States also apply a limit on the age of the vehicles surveyed.
Rail freight
Rail freight data are collected under the framework provided by Regulation 91/2003 on rail transport statistics. The data are collected for a quarterly frequency (usually limited to larger enterprises) and for an annual frequency (which covers enterprises of all sizes). Rail freight data are not available for Malta and Cyprus (or Iceland) as they do not have a railway infrastructure. Rail statistics are also collected every five years in relation to a regional breakdown (NUTS 2 level).
Aside from the mandatory collection of data based on legal acts, Eurostat also collects rail transport statistics through a voluntary data collection exercise. The questionnaire used for this exercise provides information in relation to railway transport infrastructures, equipment, enterprises, traffic and train movements.
Maritime freight
The legal framework for the collection of statistics on maritime freight transport is Directive 2009/42/EC on statistical returns in respect of carriage of goods and passengers by sea (Recast). Maritime transport data are available for most of the period from 2001 onwards, although some EU Member States have provided data since 1997. Maritime freight statistics are not transmitted to Eurostat by the Czech Republic, Luxembourg, Hungary, Austria and Slovakia as they have no maritime ports.
Inland waterways freight
The legal framework for the collection of statistics on inland waterway freight transport is Regulation 1365/2006 on statistics of goods transport by inland waterways. Data on inland waterways are only required for those Member States with an annual quantity of goods transported that exceeds one million tonnes, namely Belgium, Bulgaria, the Czech Republic, Germany, France, Luxembourg, Hungary, the Netherlands, Austria, Poland, Romania, Slovakia and the United Kingdom; Croatia also provides data. Data collection is based on an exhaustive survey of all inland waterway undertakings for all goods that are loaded or unloaded. In the case of transit, some countries make use of sampling methods in order to estimate the quantity of goods.
Air freight
The legal framework for air transport statistics is provided by Regulation 437/2003 on statistical returns in respect of the carriage of passengers, freight and mail by air. Air freight statistics are collected for freight and mail loaded and unloaded in relation to commercial air flights. The information is broken down to cover national and international freight transport.
Air transport statistics are collected at the airport level by the EU Member States, Norway, Iceland, Switzerland and candidate countries. Annual data are available for most of the EU Member States for the period from 2003 onwards, while some countries have provided data back to 1993. The statistics that are collected are also available for a monthly and a quarterly frequency. Air freight statistics are also collected for a regional breakdown (NUTS 2 level).
More detailed definitions of the statistical terms used within transport statistics are available in the Illustrated Glossary for Transport Statistics - 4th edition, 2010.
Context
One of the main challenges identified by the 2001 White paper, titled ‘European transport policy for 2010: time to decide’ (COM(2001) 370) was to address the imbalance in the development of different transport modes.
A mid-term review of the White paper, titled ‘Keep Europe moving – sustainable mobility for our continent’ (COM(2006) 314) made a number of suggestions for new policy developments, which have been subsequently expanded upon in the form of a series of European Commission Communications, these include:
- The EU's freight transport agenda: boosting the efficiency, integration and sustainability of freight transport in Europe (COM(2007) 606);
- A freight transport logistics action plan (COM(2007) 607);
- A move towards a rail network giving priority to freight COM(2007) 608);
- A European ports policy (COM(2007) 616);
- A ‘Greening transport’ package (COM(2008) 433);
- A set of strategic goals and recommendations for the EU’s maritime transport policy until 2018 (COM(2009) 8);
- A European maritime transport space without barriers (COM(2009) 10).
As the ten-year period covered by the White paper drew to an end, the European Commission adopted a Communication in mid-2009 titled ‘A sustainable future for transport: towards an integrated, technology-led and user friendly system’ (COM(2009) 279 final). Following on from this, in March 2011 the European Commission adopted a White paper titled ‘Roadmap to a single European transport area – towards a competitive and resource efficient transport system’ (COM(2011) 144 final). This comprehensive strategy contains a roadmap of 40 specific initiatives for the next decade to build a competitive transport system that aims to increase mobility, remove major barriers in key areas and fuel growth and employment. More information on the White paper is available in the transport introduced article.
Further Eurostat information
Publications
Main tables
- Regional transport statistics (t_tran_r)
- Maritime transport of freight, by NUTS 2 regions (tgs00076)
- Air transport of freight, by NUTS 2 regions (tgs00078)
- Transport, volume and modal split (t_tran_hv)
- Volume of freight transport relative to GDP (tsien060)
- Road share of inland freight transport (tsien080)
- Modal split of freight transport (tsdtr220)
- Railway transport (t_rail)
- Goods transport by rail (ttr00006)
- Road transport (t_road)
- Goods transport by road (ttr00005)
- Inland waterways transport (t_iww)
- Goods transport by inland waterways (ttr00007)
- Maritime transport (t_mar)
- Sea transport of goods (ttr00009)
- Air transport (t_avia)
- Air transport of goods (ttr00011)
Database
- Regional transport statistics (tran_r)
- Transport, volume and modal split (tran_hv)
- Railway transport (rail)
- Road transport (road)
- Inland waterways transport (iww)
- Oil pipeline transport (pipe)
- Maritime transport (mar)
- Air transport (avia)
Dedicated section
Methodology/Metadata
- Air transport infrastructure (ESMS metadata file - avia_if_esms)
- Inland waterways transport equipment (ESMS metadata file - iww_eq_esms)
- Maritime transport (ESMS metadata file - mar_esms)
- Modal split of freight transport (ESMS metadata file - tran_hv_frmod_esms)
- Oil pipeline transport (ESMS metadata file - pipe_esms)
- Railway transport infrastructure (ESMS metadata file - rail_if_esms)
- Regional transport statistics (ESMS metadata file - reg_tran_esms)
- Road freight transport methodology – volume 1:
reference manual for the implementation of Council Regulation No 1172/98/EC on statistics on the carriage of goods by road (publication) - Road freight transport methodology – volume 2:
methodologies used in surveys of road freight transport in Member States and Candidate Countries (publication) - Road transport infrastructure (ESMS metadata file - road_if_esms)
Other information
- Illustrated Glossary for Transport Statistics - 4th edition, 2010
- Regulation 1172/98 of 25 May 1998 on statistical returns in respect of the carriage of goods by road
