Social protection statistics - unemployment benefits
Data extracted in June 2024.
Planned article update: April 2025.
Highlights
In 2021, expenditure on unemployment-related benefits in the EU was €250 billion, which was equivalent to 1.7% of GDP.
In 2021, expenditure on unemployment-related benefits in the EU was 6.0% of total expenditure on social benefits.
EU expenditure on unemployment-related benefits was 9.9% higher (in constant prices) in 2021 than it had been in 2009, while the total number of unemployed people was 21.9% lower. The high level of expenditure in 2021 reflected the impact of the COVID-19 crisis.
Expenditure on unemployment-related benefits, 2021
Social protection benefits are transfers, in cash or in kind, made to relieve households and individuals of the burden of one or more social risks or needs. This article presents statistics on social protection benefits intended to address the risks and needs associated with unemployment. It covers not only unemployment benefits paid to unemployed people but also:
- other cash benefits such as partial unemployment benefits, early retirement benefits for labour market reasons, vocational training allowances and redundancy compensation
- benefits in kind such as mobility and resettlement benefits, vocational training, placement services and job search assistance.
Data on unemployment-related benefits are collected annually through the European system of integrated social protection statistics (ESSPROS).
Unemployment levels move in a cyclical manner, largely related to the general business cycle. However, other factors such as labour market policies and demographic changes may also influence the short and long-term development of unemployment and expenditure on unemployment-related benefits. It should be noted that the latest data in this article relate to 2021 and that the COVID-19 crisis greatly affected unemployment in both 2020 and 2021.
Full article
In 2021, expenditure across the EU on unemployment-related benefits was €250 billion, equivalent to 1.7% of GDP. The level of spending varied between EU countries, ranging from 3.0% of GDP in Austria to 0.4% in Hungary and Poland and 0.1% in Romania (see Figure 1).
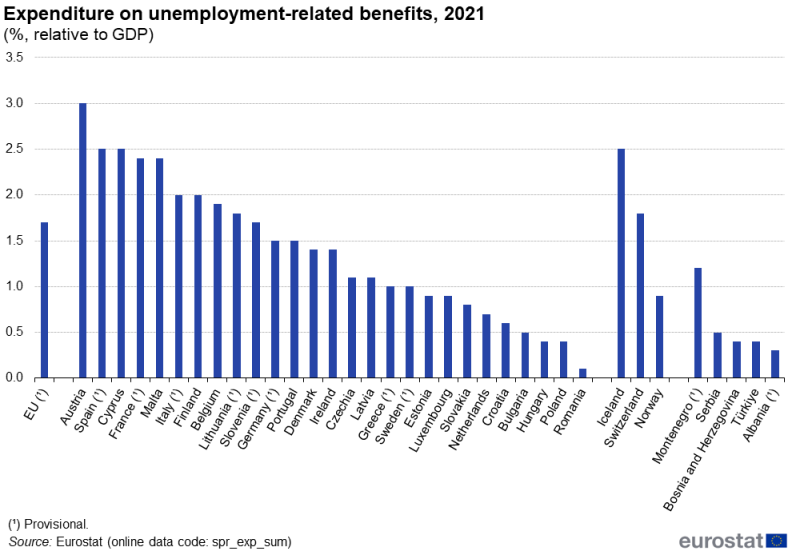
(%, relative to GDP)
Source: Eurostat (spr_exp_sum)
Expenditure on unemployment-related benefits in the EU amounted to 6.0% of all expenditure on social benefits in 2021, with this share ranging from 13.7% recorded in Malta and also more than 10.0% in Cyprus, Ireland and Lithuania down to less than 1.0% in Romania (see Figure 2).
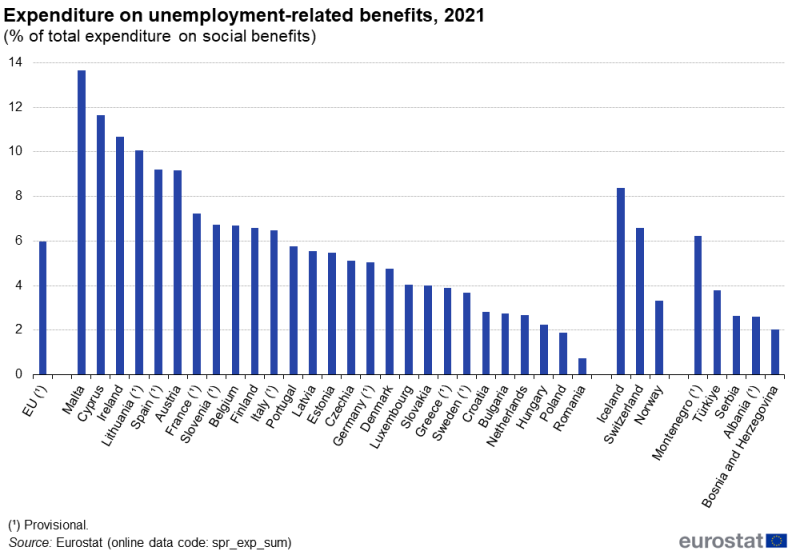
(% of total expenditure on social benefits)
Source: Eurostat (spr_exp_sum)
The proportion of social benefit expenditure allocated to unemployment does not necessarily provide an immediately useful basis for comparison between countries because of differences in the design of social protection systems. Expenditure on unemployment-related benefits is linked not only to the relative generosity of the system in terms of the types of benefits available and the level and duration of benefits provided but also to the way it is targeted and the size of the corresponding target groups.
Bearing in mind that expenditure is, at least in part, related to the number of unemployed people, expenditure per unemployed person (according to the ILO definition [1]) may provide a more meaningful comparison of expenditure on unemployment-related benefits. This comparison can be made in euro (€) terms or in purchasing power standards (PPS); the latter eliminates price level differences between countries (see Figure 3).

(€ and PPS per unemployed person)
Source: Eurostat (spr_exp_sum) and (une_rt_a)
Average expenditure on unemployment-related benefits in 2021 amounted to 16 604 PPS per unemployed person across the EU but varied considerably among the EU countries. The highest expenditure per unemployed person was recorded in Malta (41 612 PPS), while the lowest was recorded in Romania, at 1 294 PPS.
It should be noted that some high ratios may – in part – reflect benefits targeting unemployed people who are not part of the denominator used to measure per person expenditure. For example, this may be because they are non-resident and typically live in neighbouring countries (as is, for example, relatively common in Luxembourg). Another example is people who receive unemployment allowances as a pre-pension but have withdrawn either fully or partially from the labour market (as is, for example, relatively common in Belgium). As such, some care is required when analysing expenditure per unemployed person as the information presented may lack comparability due to differences between subpopulations receiving benefits. Indeed, as mentioned in the introduction, the unemployment function in ESSPROS covers not only unemployment benefits providing income replacement to the unemployed but also a range of other benefits targeted at wider groups, including people that may be employed. An example is partial unemployment benefits, which are paid to employees of enterprises implementing reduced working time or the temporary suspension of work due to economic, climatic or other difficulties; such payments were unusually common in 2020 and to a lesser extent in 2021 due to restrictions put in place during the COVID-19 crisis. The data also cover benefits in kind such as placement services and job search assistance, which are usually made available to anyone seeking work (not just the unemployed), including those who are already employed and/or those who are inactive.
Some of the principal methodological issues that need to be considered when comparing data on unemployment-related benefits between countries include the following.
- Registered unemployment: access to certain types of unemployment-related benefit is often conditional on being registered as unemployed with the public employment services (PES). The comparison of expenditure per unemployed person (as shown in Figure 3) is based on data from the EU’s labour force survey (LFS) [2] where the number of unemployed people is shown according to the ILO definition, which refers to people who are without work, currently available for work and actively seeking work. The population of unemployed people measured in this way does not necessarily correspond with the count of people registered as unemployed with the PES and who are therefore potentially eligible for unemployment benefits. Some unemployed people following the ILO definition do not register with the PES, while some of those registered may – depending on the rules in each country – have a part-time job or not be immediately available for work and would therefore not be counted as unemployed according to the ILO definition. The extent to which these 2 concepts overlap depends on national (or regional) regulations establishing the criteria for registering as unemployed. As a result, indicators on expenditure can vary considerably depending on the denominator used.
- Structure of unemployment: certain unemployment-related benefits are provided only for a limited duration. For example, the most generous unemployment insurance benefits (in terms of relaxed eligibility criteria and/or levels of income replacement) are usually time limited. After exhausting their entitlement to such benefits, people that remain unemployed are typically transferred to a means-tested unemployment assistance benefit or minimum income allowance, depending on the system in each country. The former would still be recorded in ESSPROS as an unemployment-related benefit but the latter would usually be recorded as expenditure to counter the risk of social exclusion [3], creating differences between countries when comparing data by function. Furthermore, the time limit for receipt of unemployment-related benefits varies between countries so the expenditure recorded as being unemployment-related (both in absolute terms and per unemployed person) is impacted not only by the design of the benefits system, but also by the structure of unemployment. Paradoxically, a country with a high number of long-term unemployed people could have relatively low expenditure on unemployment-related benefits, particularly when measured on a per unemployed person basis. This issue highlights the need for better data on the numbers of recipients of unemployment-related benefits.
- Family/children supplements: in principle, supplementary unemployment-related benefits that are granted for dependent children should be classified under the family/children function. However, this is often difficult in practice and the value of such supplements may remain as part of the unemployment function. As a result, countries that implement a universally available family allowance and do not use supplements may appear to have a lower level of expenditure on unemployment-related benefits than countries which implement a more restricted family allowance and rely on supplements to top-up the income of families confronted by unemployment.
- Impact of the fiscal system: with the exception of payable tax credits, unemployment-related benefits that are provided through the fiscal system are not included in the data presented. For example, tax exemptions, tax credits and higher tax-free allowances provided to unemployed people may reduce taxes paid by recipients but are not included in the expenditure recorded by the ESSPROS core system. Similarly, taxes and social contributions deducted from unemployment-related benefits and recouped by the government are included in benefits. Therefore, the gross expenditure data do not necessarily reflect the contribution of such benefits to the disposable income of beneficiaries. Indeed, expenditure net of taxes and social contributions in 2021 was more than 15.0% below the level of gross expenditure in Italy, Finland, Sweden, Denmark and the Netherlands (see Figure 4).

(PPS)
Source: Eurostat (spr_exp_sum), (spr_net_ben) and (une_rt_a)
EU expenditure on unemployment-related benefits (in constant price terms) was higher in 2021 than in 2009 (see Figure 5). The developments in this period can be split into 2 parts, namely those between 2009 and 2019 on one hand and the developments between 2019 and 2021 on the other.
Focusing on the period from 2009 to 2019, expenditure on unemployment-related benefits fell 23.4% in the EU; the number of unemployed people also fell, down 24.7%. During the same period, expenditure on all social benefits increased (up 14.3%) as did GDP (up 16.9%). The developments for expenditure on unemployment-related benefits, for expenditure on social benefits and for GDP were relatively regular compared with the development for the number of unemployed people: the level of unemployment grew strongly between 2009 and 2013 following the global financial and economic crisis and during the debt crisis and thereafter declined steadily to a low in 2019.
Rather than continuing the downward development observed since 2013, expenditure on unemployment-related benefits increased by 76.3% in 2020 and then fell by 18.6% in 2021. The extraordinary increase in 2020 reflects the impact of the COVID-19 crisis and its related restrictions on labour markets and consequently expenditure on unemployment-related benefits. During the same year (the change between 2019 and 2021), the number of unemployed people rose 4.7%, considerably less than the increase observed for expenditure on unemployment-related benefits.
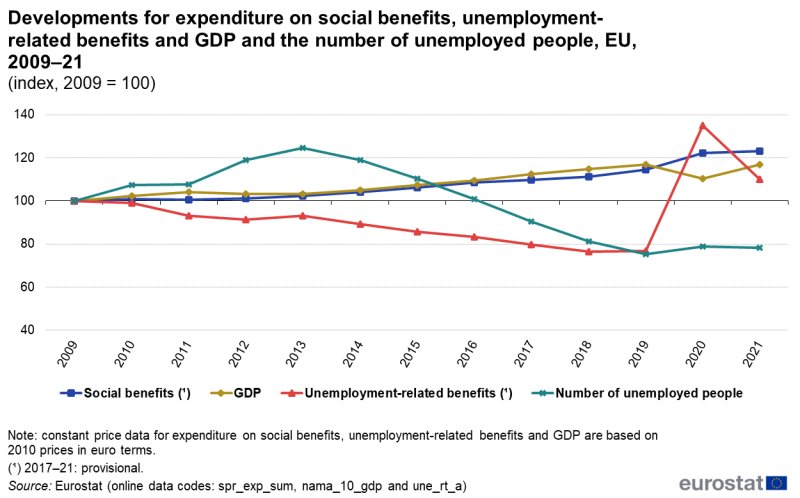
(index, 2009 = 100)
Source: Eurostat (spr_exp_sum), (nama_10_gdp) and (une_rt_a)
The number of unemployed people followed a fluctuating development between 2009 and 2021 across many EU countries. Between these years, the level of unemployment changed greatly, mainly because of the crises at the beginning of this period, the subsequent recovery and finally the COVID-19 crisis in the most recent years for which data are available. The overall change for the EU was a decrease of 21.9%. Lower rates were recorded in 2021 than in 2009 in most EU countries. Luxembourg and Cyprus were the most notable exceptions: in relative terms, the largest overall increase was recorded in Cyprus (see Figure 6) where there was an increase of 59.1%, followed by Luxembourg with an increase of 41.7%. The number of unemployed people in Greece, Italy, Sweden and Austria was also higher in 2021 than in 2009. By contrast, the largest relative decreases in the levels of unemployment between 2009 and 2021 were observed in Latvia, Poland and Czechia, all with decreases in excess of 55.0% Note that a fall or rise in the number of unemployed people may reflect changes in the overall size of the of population and/or labour force and this, for example, explains part of the large increase in Luxembourg and the relatively large decreases in some other countries.
A similar analysis for the overall change in constant price expenditure on unemployment-related benefits between 2009 and 2021 indicates that there was an overall increase in the EU of 9.9%, covering a generally downward path between 2009 and 2019, a sharp increase in 2020 and somewhat smaller decrease in 2021. Between 2009 and 2021, expenditure on unemployment-related benefits decreased in 8 EU countries; there were increases in the remaining 19 EU countries.
- The fastest growth over this period was recorded in Malta, where expenditure was more than 8 times higher in 2021 than in 2009 (growth of 769.9%); note that the change between 2009 and 2019 in Malta was a decrease of 40.0% and so this very high growth between 2009 and 2021 is dominated by the changes between 2019 and 2021.
- In Slovenia, overall growth between 2009 and 2021 was 259.4%, while in Cyprus it was 256.9%. Lithuania also recorded expenditure on unemployment-related benefits that was more than three times higher in 2021 than in 2009, while such expenditure also more than doubled in Austria.
- The countries where such expenditure was lower in 2021 than in 2009 were Romania, Greece, Hungary, Belgium, Spain, Slovakia, Latvia and the Netherlands.

(%)
Source: Eurostat (spr_exp_sum) and (une_rt_a)
The overall changes between 2009 and 2021 observed for the EU countries are often dominated by changes in 2020 and 2021 in the face of the COVID-19 crisis. In more normal times, changes in the total number of unemployed people and in expenditure on unemployment-related benefits may be expected to follow a broadly similar pattern; this is primarily due to the fact that the majority of unemployment-related expenditure relates to benefits that are received by the unemployed. However, there are several reasons why this might not happen.
- A substantial part of these differing developments between 2019 and 2020 and between 2020 and 2021 can be explained by the major change in the composition of unemployment-related expenditure. Between 2019 and 2020, there was a huge increase in the share of expenditure relating to partial unemployment, a benefit usually granted to people who are still employed. In other words, for this type of benefit there is no direct link between developments in the level of expenditure and developments in the number of people who are unemployed.
- Unemployment benefits, which constitute the majority of unemployment-related expenditure, usually become less generous (in terms of amounts paid and/or coverage) as the duration of unemployment extends. In periods of an increasing share of long-term unemployment (such as the aftermath of a prolonged crisis), the proportion of unemployed people who are eligible to receive full benefits declines.
- Redundancy compensation is not strictly linked with unemployment, but if a person does become unemployed as a result of redundancy, they may expect their compensation to be granted before, or soon after, they become unemployed. For this reason, expenditure on redundancy compensation is likely to correlate with increases in the number of unemployed people rather than with the overall number of unemployed people.
- In the aftermath of a prolonged period of high unemployment (such as after the global financial and economic crisis), government policies may be adapted in order to reduce the level of government spending, impacting on the level and/or coverage of unemployment-related benefits.
Composition of unemployment expenditure in 2021
Distribution by type of benefit
In 2021, 82.1% of expenditure on unemployment-related benefits in the EU was disbursed in the form of periodic cash benefits, while 13.0% was disbursed as lump sum cash benefits and the remaining 4.9% as benefits in kind (see Figure 7).
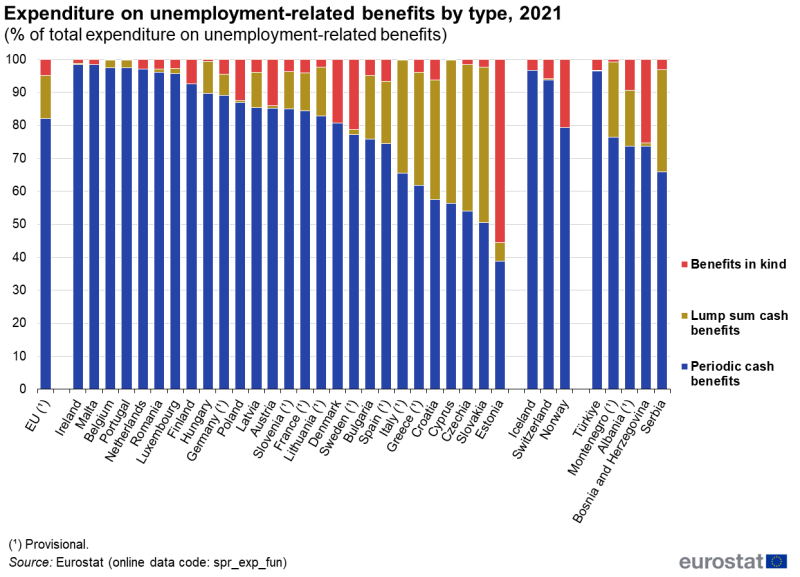
(% of total expenditure on unemployment-related benefits)
Source: Eurostat (spr_exp_fun)
Periodic cash benefits constituted an absolute majority of expenditure on unemployment-related benefits in all but 1 of the EU countries in 2021: in Estonia, benefits in kind accounted for a higher share (55.6%).
Lump sum cash benefits were the 2nd largest component in 16 of the EU countries. These benefits accounted for more than two fifths (47.0%) of expenditure on unemployment-related benefits in Slovakia, Czechia (44.5%) and Cyprus (43.5%) as well as more than a third in Croatia (36.4%), Italy (34.4%) and Greece (34.3%). By contrast, in 7 countries lump sum cash benefits accounted for less than 1.0% of the total, among which Denmark, Malta, the Netherlands and Finland where there were no such benefits (a share of 0.0%).
Benefits in kind, which include, for example, vocational training for the unemployed and placement services, accounted for less than a tenth of the total expenditure on unemployment-related benefits in all but 5 of the EU countries, the exceptions being Estonia (55.6%) – as already mentioned – Sweden (21.2%), Denmark (19.2%), Austria (14.0%) and Poland (12.4%).
Distribution by detailed benefit type
ESSPROS distinguishes 5 types of periodic unemployment cash benefits
- full unemployment benefits
- partial unemployment benefits
- early retirement benefits for labour market reasons
- vocational training allowance
- other cash benefits
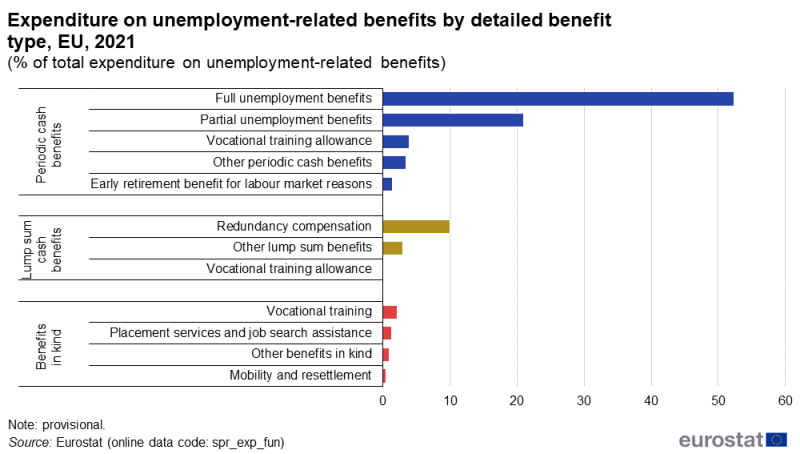
Full and partial unemployment benefits were, by far, the most common types of benefit in 2021, accounting for 52.3% and 21.0%, respectively, of all expenditure on unemployment-related benefits in the EU (see Figure 8). The high contribution of these 2 benefit types explains why periodic cash benefits as a whole were the most common form of disbursement. Indeed, all but 3 of the EU countries – Estonia, Croatia and Italy – reported that full or partial unemployment benefits were the most common form of disbursement. Vocational training (which is a benefit in kind) had the highest share of expenditure in Estonia while the most common form of disbursement in Croatia and Italy was redundancy compensation (a lump sum benefit).
(% of total expenditure on unemployment-related benefits)
Source: Eurostat (spr_exp_fun)
ESSPROS distinguishes 3 types of unemployment lump sum cash benefits:
- redundancy compensation
- vocational training allowance
- other cash benefits
Redundancy compensation, which accounted for 10.0% of total expenditure on unemployment-related benefits across the EU in 2021, was the most common type of lump sum cash benefit and the 3rd largest benefit (after full and partial unemployment benefits). Other types of lump sum cash benefits – vocational training allowance and other lump sum cash benefits – accounted for relatively small shares of total expenditure on unemployment-related benefits, 0.0% and 3.0%, respectively. In Croatia and Italy, redundancy compensation accounted for more than a third of total expenditure on unemployment-related benefits in 2021 and this share was also over a quarter in Slovakia and Greece.
Lastly, unemployment benefits in kind can be broken down into 4 detailed benefit types:
- mobility and resettlement benefits
- vocational training
- placement services and job search assistance
- other benefits in kind
None of these accounted for a large share of total EU expenditure on unemployment-related benefits in 2021; the largest was recorded for vocational training (2.1%), while each of the remaining benefits in kind accounted for1.3% or less of unemployment-related benefits.
Distribution by type of benefit
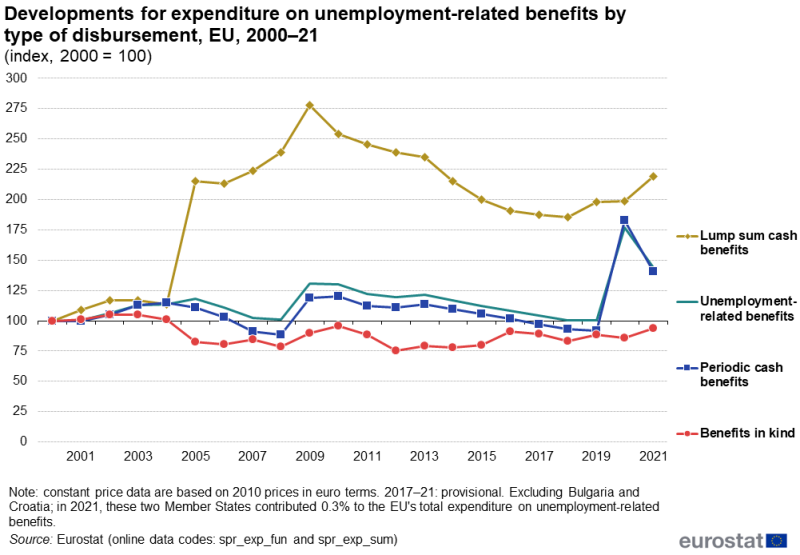
When measured in constant price terms (see Figure 9) EU (excluding Bulgaria and Croatia) expenditure on unemployment-related benefits was 44.2% higher in 2021 than in 2000. This overall change was pulled up by an increase of 119.1% for expenditure on lump sum cash benefits and supported by a 40.9% increase for expenditure on periodic cash benefits. By contrast, expenditure on benefits in kind was 6.2% lower in 2021 than in 2000.
From Figure 9, it can be seen that the overall rates of change for expenditure on lump sum cash benefits and benefits in kind in the EU (excluding Bulgaria and Croatia) were little affected in 2020 and 2021 by the impact of the COVID-19 crisis and its related restrictions. However, expenditure on periodic cash benefits had been 8.3% lower in 2019 than in 2000, in stark contrast to the 99.4% increase between 2019 and 2020 which dominated the overall change between 2000 and 2021.
Looking further back in time, expenditure on lump sum cash benefits in the EU (excluding Bulgaria and Croatia) followed a different pattern of development to the other types of benefit mainly due to a large increase in 2005 followed by sustained increases through until 2009. In part, this volatility reflects the relatively low overall level of expenditure. However, the large annual increase in 2005 may be attributed principally to an increase in Italy where there was a change in the classification of severance pay (trattamento di fine rapporto); previously this was classified under the old-age function but was then split between the old-age function and the unemployment function.
(index, 2000 = 100)
Source: Eurostat (spr_exp_fun) and (spr_exp_sum)
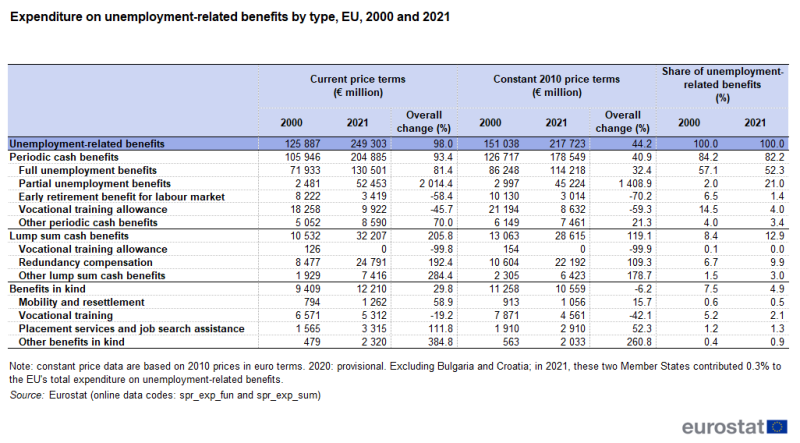
These changes in the levels of expenditure by type of disbursement have led to a shift in the composition of unemployment-related benefits between 2000 and 2021. The share of lump sum cash benefits in the EU (excluding Bulgaria and Croatia) rose during the period under consideration from 8.4% to 12.9%, while the contribution of periodic cash benefits decreased from 84.2% to 82.2%. Consequently, the share of benefits in kind fell from 7.5% to 4.9% (see Table 1). Again, it should be noted that this change in composition reflects the changes up to (and including) the COVID-19 crisis.
Distribution by detailed benefit type
Table 1 provides an analysis of expenditure levels for 2000 and 2021 for 12 detailed types of unemployment-related benefits within the EU (excluding Bulgaria and Croatia).
- There was a considerable increase in the level of expenditure for partial unemployment benefits, which was 21 times higher in 2021 than it had been in 2000. This particular detailed type of benefit was greatly impacted by measures to avoid full unemployment during the COVID-19 crisis.
- Other detailed types of unemployment-related benefits for which expenditure more than doubled in current price terms between 2000 and 2021 were: other benefits in kind (up 384.8%), other lump sum cash benefits (up 284.4%), redundancy compensation (up 192.4% [4]) and placement services and job search assistance (up 111.8%).
- Expenditure was lower in 2021 than in 2000 for several detailed types of unemployment-related benefits, mostly related to vocational training (vocational training benefits in kind down 19.2%, periodic allowances down 45.7% and lump sum allowances almost completely eliminated) but also to early retirement benefit for labour market reasons (down 58.4%).
It is unsurprising to observe a decline in the level of expenditure for early retirement benefits as EU employment policy has focused on extending working lives and encouraging older workers to remain active in the labour market rather than facilitating their premature withdrawal. Early-retirement benefits are therefore out of line with policy objectives and are generally being used less. Indeed, expenditure on such early-retirement benefits fell in the majority of EU countries where such benefits exist, with notable exceptions in Slovakia, Italy, Luxembourg, Germany and Portugal, where there was growth in current price terms.
Periodic cash payments for vocational training allowances had also stopped altogether by 2021 in a few EU countries where they had been made in 2000 (Czechia, Latvia and Finland) and there was a large decrease in such payments in Germany, Denmark, Ireland and Spain, all down by at least two thirds in current price terms between 2000 and 2021.
Source: Eurostat (spr_exp_fun) and (spr_exp_sum)
In real terms, EU (excluding Bulgaria and Croatia) expenditure on unemployment-related benefits was 44.2% higher in 2021 than it had been in 2000. A more detailed analysis (see Table 1) among 12 types of unemployment-related benefits reveals similar developments as in current price terms, but due to the increase in prices over the period studied, with somewhat lower rates of increase (among those headings which experienced increases) or somewhat higher rates of decrease for benefits related to vocational training or to early retirement benefit for labour market reasons. For example, the largest detailed type of benefit – full unemployment benefits – increased 32.4% in real terms, compared with 81.4% in current prices.
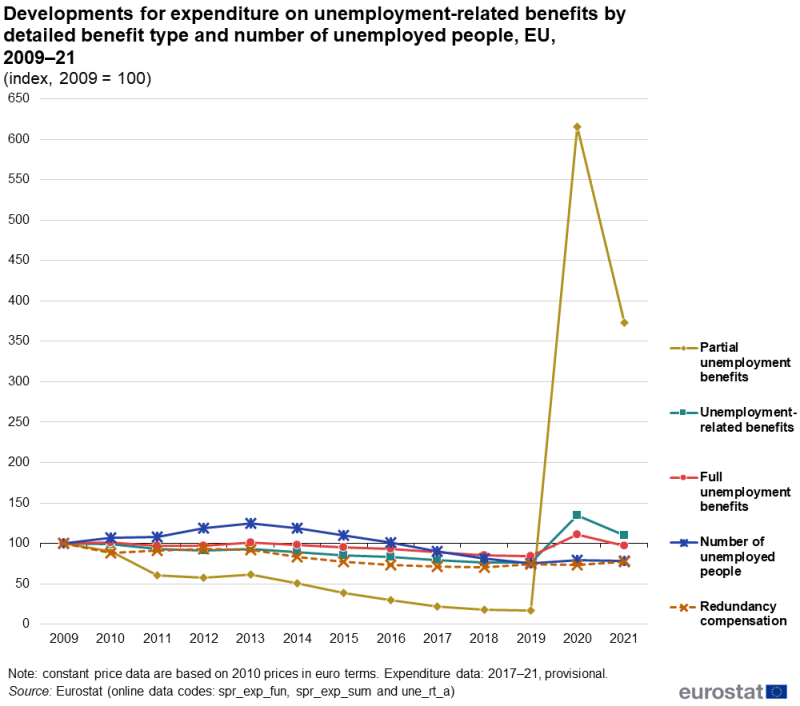
Figure 10 provides information on the development (in constant prices terms) for 3 detailed benefit types, the total of all unemployment-related benefits and for the total number of unemployed people. The period under consideration concerns 2009–21 as the EU time series for unemployment-related benefits starts in 2009. The development of unemployment-related benefits during the period 2009 to 2021 should be considered in light of overall changes to EU labour markets and especially those concerning the level of unemployment, with benefit payments often closely linked to the developments in the number of unemployed people. The early years of the period were influenced by the global financial and economic crisis and the European sovereign debt crisis, while the data for the final years, 2020 and 2021, should be considered in the context of the COVID-19 crisis.
In the EU, the number of unemployed people rose from 2009 through to 2013, after which there was a fall in the level of unemployment each year to a low in 2019, when it was nearly a quarter (24.7%) lower than it had been in 2009. The total number of unemployed people increased 4.7% in 2020 and then dropped back 0.9% in 2021. Although the total number of unemployed people in the EU didn’t peak until 2013, expenditure levels for the selected unemployment-related benefits were broadly stable or declining during this period, having often peaked in 2009.
(index, 2009 = 100)
Source: Eurostat (spr_exp_fun), (spr_exp_sum) and (une_rt_a)
Between 2009 and 2019, expenditure on unemployment-related benefits fell 23.4% in the EU in real terms, broadly in line with the 24.7% fall for the number of unemployed people. The fall was marginally greater for expenditure on redundancy compensation (down 25.6%) and notably greater for expenditure on partial unemployment benefits (down 83.4%). The fall in expenditure on full unemployment benefits was somewhat less than the average, down 15.4%.
In 2020, expenditure for redundancy payments continued to decline, down a further 2.0% before an increase of 5.9% in 2021. For expenditure on full and partial unemployment benefits, the downward development reversed dramatically, up 30.6% for full benefits and up 3 601.3% for partial benefits; both fell back strongly in 2021, down 12.1% for full benefits and down 39.4% for partial benefits.
Overall, expenditure on unemployment-related benefits in the EU increased 76.3% in 2020, far more than the 4.7% increase in the number of unemployed people. This substantial difference reflects the large increase in expenditure on partial unemployment benefits which is made to people who are still in employment and therefore not counted in the number of unemployed people. In a similar manner, expenditure on unemployment-related benefits in the EU decreased 18.6% in 2021, far more than the 0.9% decrease in the number of unemployed people.
Source data for tables and graphs
![]() Social protection statistics – unemployment benefits: tables and figures
Social protection statistics – unemployment benefits: tables and figures
Data sources
The data related to social protection presented in this article are from the European system of integrated social protection statistics (ESSPROS), specifically the core system. These data are collected from national statistical offices and/or ministries of social affairs in each country and are generally compiled from administrative sources.
Regulation (EC) No 0458/2007 of the European Parliament and of the Council provides the legal basis for the collection of this data and a series of Commission regulations provide further specifications for the implementation of this regulation.
Data for the EU cover all 27 EU countries, except where specified. For time series starting earlier than 2009 (Figure 9 and Table 1), the data presented for the EU in this article exclude Bulgaria and Croatia to ensure a consistent coverage (and therefore data comparability) for the whole period under consideration (2000–21). In 2021, these 2 countries contributed 0.3% to the EU’s expenditure on unemployment-related benefits.
Context
The organisation and financing of social protection systems is the responsibility of each of the EU countries. Nevertheless, the European Commission provides support to help reach these targets through flagship initiatives such as the European pillar of social rights.
The European pillar of social rights is built upon 20 principles, including:
- principle 4, which seeks to ensure that long-term unemployed people have the right to an in-depth assessment at the latest after 18 months of unemployment
- principle 13, which seeks to ensure that the unemployed have the right to adequate activation support from public employment services to (re)integrate into the labour market and adequate unemployment benefits of reasonable duration.
On 8 November 2019, the Council adopted the Recommendation on access to social protection for workers and the self-employed, a key initiative part of the roll-out of the European pillar of social rights.
On May 2021 the European Commission adopted The European Pillar of Social Rights Action Plan, which sets out concrete initiatives to turn the European Pillar of Social Rights into reality, proposing headline targets for the EU by 2030.
Furthermore, the European Commission provides guidance to EU countries to modernise their welfare systems through the social investment package.
Direct access to
- Social protection (spr) , see
- Social protection expenditure (spr_expend)
- Social protection receipts (spr_receipts)
- Pensions beneficiaries (spr_pension)
- Net social protection benefits (spr_net_ben)
- Social protection methodology
- Social protection (ESMS metadata file – spr_esms)
- Regulation (EC) No 458/2007 of the European Parliament and of the Council of 25 April 2007 on the European system of integrated social protection statistics (ESSPROS).
- Commission Regulation (EU) No 110/2011 of 8 February 2011 concerning the appropriate formats for the transmission of data, the results to be transmitted and the criteria for measuring quality for the ESSPROS module on net social protection benefits.
- Commission Regulation (EU) No 263/2011 of 17 March 2011 concerning the launch of full data collection for the ESSPROS module on net social protection benefits.
Notes
- ↑ People who are without work, currently available for work and seeking work; see unemployment.
- ↑ See http://ec.europa.eu/eurostat/web/lfs/overview.
- ↑ Minimum income allowance is reported in the expenditure on social exclusion in ESSPROS rather than as expenditure on unemployment related benefits unless specific provisions are made for the unemployed.
- ↑ The increase in expenditure for redundancy compensation is likely to be overstated due to the above-mentioned change in recording practices for severance pay in Italy.