Archive:ASEAN-EU - international trade in goods statistics
Data extracted in April 2021
Planned article update: 1 April 2022
Highlights
Manufactured goods dominated EU trade with ASEAN partners in 2020, with 84 % of total exports and 87 % of total imports.
Singapore was the largest ASEAN destination for EU exports of goods in 2020, while Vietnam was the largest ASEAN origin for EU imports of goods.
Germany was the largest EU exporter of goods to ASEAN countries in 2020, with €22 billion while the Netherlands was the largest importer of goods from ASEAN countries with a value of €31 billion.
EU trade in goods: Imports, exports and trade balance with ASEAN countries, 2010-2020
This article provides a picture of the international trade in goods between the European Union (EU) and ASEAN. It analyses the type of goods exchanged between them and the shares of each EU Member State in those exchanges. The countries belonging to ASEAN are Brunei, Cambodia, Indonesia, Laos, Malaysia, Myanmar, the Philippines, Singapore, Thailand and Vietnam.
This article is part of an online publication providing recent statistics on international trade in goods, covering information on the EU's main partners, main products traded, specific characteristics of trade as well as background information.
Full article
ASEAN countries trade in goods with main partners
The six largest trade in goods partners of ASEAN countries in 2019 are shown in Figure 1. China (22 %) is the largest import destination, followed closely by trade among ASEAN countries (22 %). Japan, the United States and the EU all have an 8 % share in ASEAN imports. 9 % of ASEAN exports originate in the EU, which places it fourth behind the United States (13 %), China (14 %) and trade among ASEAN countries (23 %).

EU trade in goods with ASEAN countries continues to be in deficit
Between 2010 and 2019, total EU trade with ASEAN countries grew considerably (see Figure 2) but both fell in 2020 due to the COVID-19 pandemic. Exports to ASEAN countries grew from EUR 54 billion in 2010 to EUR 85 billion in 2019 and then dropped EUR 16 billion to EUR 69 billion in 2020. Imports from ASEAN countries grew even more, from EUR 72 billion in 2019 to EUR 125 billion and then dropped EUR 5 billion to EUR 120 billion in 2020. Consequently, the trade deficit grew from EUR 18 billion in 2010 to EUR 51 billion in 2020.

(EUR billion)
Source: Eurostat - Comext DS-018995
Manufactured goods dominate trade with ASEAN partners
In 2010, 87 % of goods exported to ASEAN countries were manufactured goods (see Figure 3). This share fell to 84 % in 2020, while the share of primary goods rose from 11 % in 2009 to 15 % in 2020. Within manufactured goods there was a decline in the share of machinery and vehicles from 53 % in 2010 to 44 % in 2020 while chemicals rose from 15 % to 20 % in this period.

(shares of total exports in value)
Source: Eurostat - Comext DS-018995
Manufactured goods also dominate imports of goods from ASEAN countries (see Figure 4). Between 2010 and 2020 their share increased from 80 % to 87 % due to the increasing share of machinery and vehicles and of other manufactured goods. The six percentage points (pp) drop in the share of primary goods from 19 % in 2010 to 13 % in 2020 was caused mainly by the falling share of raw materials, although the shares of both other categories of primary goods also fell.

(shares of total imports in value)
Source: Eurostat - Comext DS-018995
Singapore largest ASEAN destination for EU exports of goods
Table 1 shows the exports, imports and trade balance for trade in goods between the EU and ASEAN countries. In 2020 total trade (exports + imports) of the largest two trade partners Vietnam (EUR 43 billion) and Singapore (41 billion) were quite close. Due to a surge in imports, total trade with Vietnam grew ten times as fast as total trade with Singapore between 2010 and 2020.

(EUR million and %)
Source: Eurostat - Comext DS-018995
Figure 5 shows the EU exports of goods to the six largest ASEAN trading partners (Vietnam, Singapore, Malaysia, Thailand, Indonesia and the Philippines). Among these six, Singapore was the largest destination for EU exports of goods in 2020 with EUR 24.0 billion, followed by Thailand (EUR 11.4 billion) and Malaysia (EUR 10.6 billion). Vietnam had the largest increase for EU exports doubling from EUR 4.4 billion in 2010 to EUR 8.8 billion in 2020 equivalent to an average annual growth rate of 7.3 %. Among the smaller ASEAN partners, Cambodia (20.8 %) and Brunei (15.9 %) had even higher growth rates (Figure 5b).
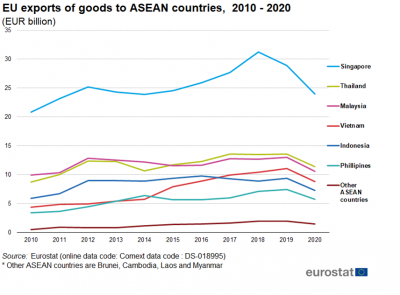
Figure 5a: EU exports of goods to ASEAN countries, 2010-2020
(EUR billion)
Source: Eurostat - Comext DS-018995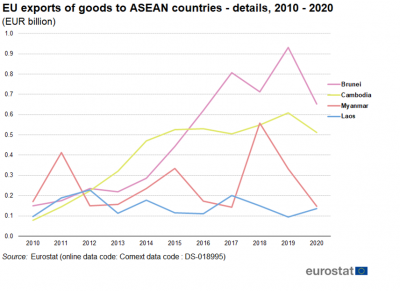
Figure 5b: EU exports of goods to ASEAN countries - details, 2010-2020
(EUR billion)
Source: Eurostat - Comext DS-018995


Vietnam largest ASEAN partner for EU imports of goods
The EU's largest partner for imports of goods among ASEAN countries in 2020 was Vietnam. The growth from EUR 8.3 billion in 2010 to EUR 34.4 billion in 2020 was equivalent to an average annual growth rate of 15.3 % (Figure 6). It thereby surpassed the imports from Indonesia, Thailand, Malaysia and Singapore whose average annual growth rates varied between 0.6 % and 5.1 %. Among the smaller ASEAN countries, Laos (10.6 %), Cambodia (17.4 %) and Myanmar (35.6 %) achieved double digit growth rates, but coming from absolute values that were much smaller (Figure 6b).
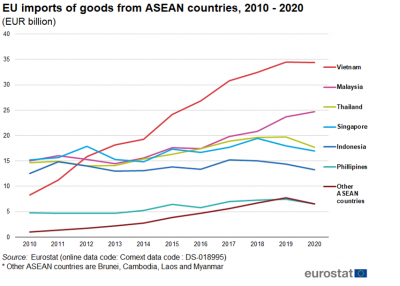
Figure 6a: EU imports of goods from ASEAN countries, 2010-2020
(EUR billion)
Source: Eurostat - Comext DS-018995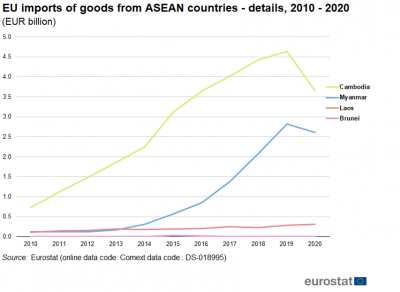
Figure 6b: EU imports of goods from ASEAN countries - details, 2010-2020
(EUR billion)
Source: Eurostat - Comext DS-018995


Vietnam's high growth in imports meant that the EU saw its trade in goods deficit with Vietnam increase from EUR 4.0 billion in 2010 to EUR 25.6 billion in 2020 (see Figure 7). The trade deficit with Malaysia also increased significantly from EUR 5.1 billion in 2010 to EUR 14.1 billion in 2020. With the exception of Brunei (+0.1 billion) and Singapore (+7.0 billion), the EU had trade deficits with all ASEAN countries.
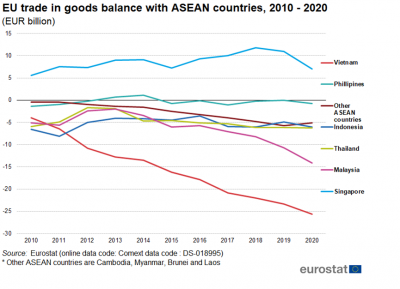
Figure 7a: EU trade in goods balance with ASEAN countries, 2010-2020
(EUR billion)
Source: Eurostat - Comext DS-018995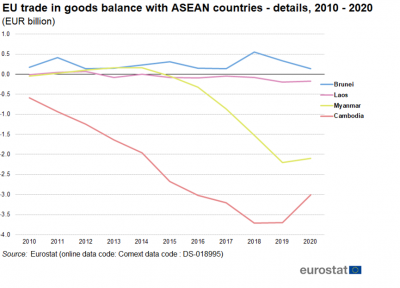
Figure 7b: EU trade in goods balance with ASEAN countries - details, 2010-2020
(EUR billion)
Source: Eurostat - Comext DS-018995


Germany largest trade in goods partner for ASEAN countries
The largest EU exporter of goods to ASEAN countries in 2020 was Germany. German exports of goods to ASEAN countries had a value of EUR 22 billion, making up 3.9 % of all their extra-EU exports. This share was highest in Malta where 16.5 % of extra-EU exports was destined for ASEAN countries.

Among the EU Member States, the Netherlands with EUR 31 billion was the largest importer of goods from ASEAN countries followed by Germany with EUR 27 billion. In Slovakia (12.7 %), Austria (10.8 %) and the Netherlands (10.2 %) more than 10 % of imports originated from ASEAN countries.

There were six Member States that had a modest trade in goods surplus with ASEAN countries in 2020. These were France (EUR 607 million), Finland (EUR 452 million) , Denmark (EUR 282 million) , Malta (EUR 106 million), Lithuania (EUR 43 million) and Luxembourg (EUR 25 million) . The other 22 Member States all had trade deficits with ASEAN countries, ranging from EUR 2 million for Estonia to EUR 23 billion for the Netherlands Other large deficits were seen in Belgium (EUR 6 billion), Germany (EUR 5 billion) and Spain (EUR 4 billion) .
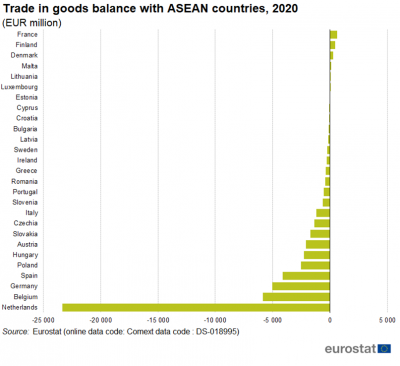
Figure 8a: Trade in goods balance with ASEAN countries, 2020
(EUR million)
Source: Eurostat - Comext DS-018995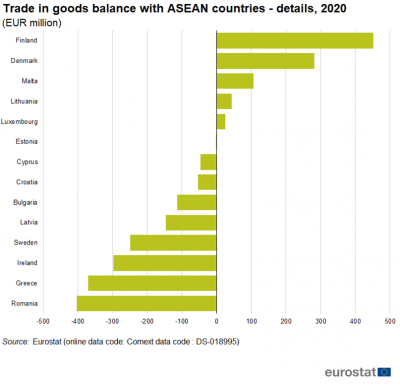
Figure 8b: Trade in goods balance with ASEAN countries - details, 2020
(EUR million)
Source: Eurostat - Comext DS-018995


Source data for tables and graphs
Data sources
EU data is taken from Eurostat's COMEXT database. COMEXT is the reference database for international trade in goods. It provides access not only to both recent and historical data from the EU Member States but also to statistics of a significant number of third countries. International trade aggregated and detailed statistics disseminated via the Eurostat website are compiled from COMEXT data according to a monthly process.
Data are collected by the competent national authorities of the Member States and compiled according to a harmonised methodology established by EU regulations before transmission to Eurostat. For extra-EU trade, the statistical information is mainly provided by the traders on the basis of customs declarations.
EU data are compiled according to Community guidelines and may, therefore, differ from national data published by the Member States. Statistics on extra-EU trade are calculated as the sum of trade of each of the 27 EU Member States with countries outside the EU. In other words, the EU is considered as a single trading entity and trade flows are measured into and out of the area, but not within it.
The United Kingdom is considered as an extra-EU partner country for the EU for the whole period covered by this article. However, the United Kingdom was still part of the internal market until the end of the transitory period (31 December 2020), meaning that data on trade with the United Kingdom are still based on statistical concepts applicable to trade between the EU Member States. Consequently, while imports from any other extra-EU trade partner are grouped by country of origin, the United Kingdom data reflect the country of consignment. In practice this means that the goods imported by the EU from the United Kingdom were physically transported from the United Kingdom but part of these goods could have been of other origin than the United Kingdom. For this reason, data on trade with the United Kingdom are not fully comparable with data on trade with other extra-EU trade partners.
Methodology According to the EU concepts and definitions, extra-EU trade statistics (trade between EU Member States and non-EU countries) do not record exchanges involving goods in transit, placed in a customs warehouse or given temporary admission (for trade fairs, temporary exhibitions, tests, etc.). This is known as ‘special trade’. The partner is the country of final destination of the goods for exports and the country of origin for imports.
Product classification Information on commodities exported and imported is presented according to the Standard international trade classification (SITC). A full description is available from Eurostat’s classification server RAMON.
Unit of measure Trade values are expressed in millions or billions (1 000 millions) of euros. They correspond to the statistical value, i.e. to the amount which would be invoiced in case of sale or purchase at the national border of the reporting country. It is called a FOB value (free on board) for exports and a CIF value (cost, insurance, freight) for imports.
Context
Trade is an important indicator of Europe’s prosperity and place in the world. The block is deeply integrated into global markets both for the products it sources and the exports it sells. The EU trade policy is one of the main pillars of the EU’s relations with the rest of the world.
Because the 27 EU Member States share a single market and a single external border, they also have a single trade policy. EU Member States speak and negotiate collectively, both in the World Trade Organization, where the rules of international trade are agreed and enforced, and with individual trading partners. This common policy enables them to speak with one voice in trade negotiations, maximising their impact in such negotiations. This is even more important in a globalised world in which economies tend to cluster together in regional groups.
The openness of the EU’s trade regime has meant that the EU is the biggest player on the global trading scene and remains a good region to do business with. Thanks to the ease of modern transport and communications, it is now easier to produce, buy and sell goods around the world which gives European companies of every size the potential to trade outside Europe.
Direct access to
- International trade in goods (t_ext_go), see:
- International trade in goods - long-term indicators (t_ext_go_lti)
- International trade in goods - short-term indicators (t_ext_go_sti)
- International trade in goods (ext_go), see:
- International trade in goods - aggregated data (ext_go_agg)
- International trade in goods - long-term indicators (ext_go_lti)
- International trade in goods - short-term indicators (ext_go_sti)
- International trade in goods - detailed data (detail)
- EU trade since 1988 by SITC (DS-018995)
- International trade in goods statistics - background
- International trade in goods (ESMS metadata file — ext_go_esms)
- User guide on European statistics on international trade in goods
- European Commission