Archive:Electric vehicles and energy generation statistics
Data extracted in February 2022.
Planned article update: XX XXXX 202X.
Highlights
This article sheds light to electricity generation and transport data of electric vehicles. It covers the European Union (EU) and when available, it also includes data from Iceland, Liechtenstein and Norway. The first part analyses electricity generation data. Electricity generation per country is a strong indicator of the energy source used for the electricity consumed for charging electric vehicles. However, electricity trade can affect this picture. The second part of the article describes electric vehicles' total consumption trends at county level.
Full article
Electricity sector data analysis
Gross electricity production
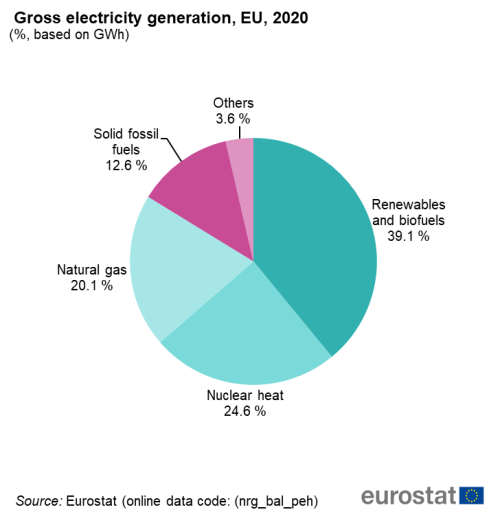
At EU level in 2020 (figure 1), Renewables and biofuels offered 39.1 % of the total gross electricity production, nuclear contributed by 24.6 %, natural gas and solid fossil fuels production corresponded to 20.1 % and 12.6 % respectively.
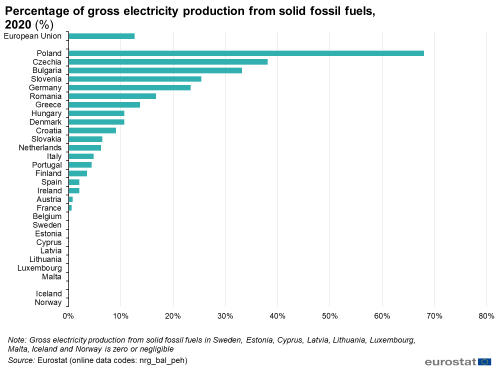
Figure 2 shows the percentage of gross electricity production from solid fossil fuels. Poland, Czechia and Bulgaria, with 68.0 %, 38.1 % and 33.2 % respectively, are the countries with the highest percentage of gross electricity production from fossil fuels. Gross electricity production from solid fossil fuels in Sweden, Estonia, Cyprus, Latvia, Lithuania, Luxembourg, Malta, Iceland and Norway is zero or negligible.
(%)
Source: Eurostat (nrg_bal_peh)
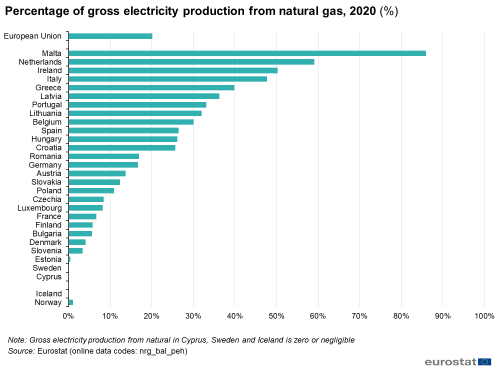
Figure 3 depicts the percentage of gross electricity production from natural gas. In the EU, the share of gross electricity production from natural gas is 20.1 %. Malta with 85.9 %, Netherlands (59.1 %) and Ireland (50.3 %) produce more than half of their gross electricity from natural gas. Gross electricity production from natural gas in Cyprus, Sweden and Iceland is zero or negligible.
(%)
Source: Eurostat (nrg_bal_peh)
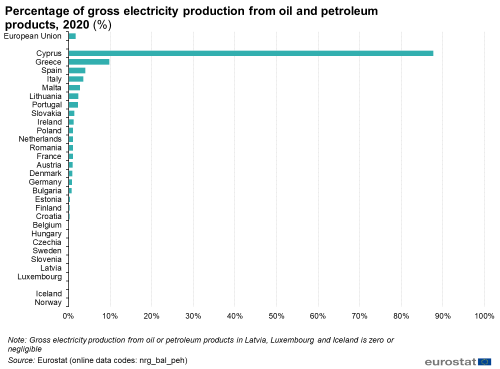
Figure 4 shows the percentage of gross electricity production from oil and petroleum products. Except from Cyprus, with 87.7 %, Greece with 9.8 % and Spain with 4.1 %, EU countries have low or negligible percentage of gross electricity production using oil and petroleum products. Oil and petroleum products are used for the electricity production in small islands isolated electricity systems. However the increasing penetration of renewables reduces their contribution.
(%)
Source: Eurostat (nrg_bal_peh)
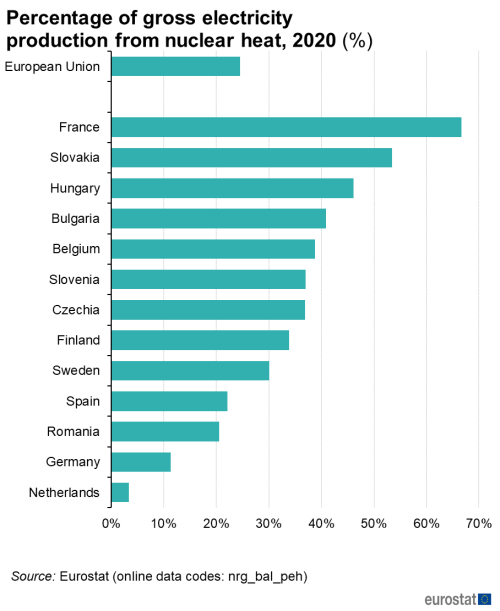
Figure 5 presents the share of nuclear in the gross electricity production. The countries that use nuclear energy in their mix are France, Slovakia, Hungary, Belgium, Bulgaria, Sweden, Slovenia, Czechia, Finland, Spain, Romania, Germany and Netherlands. The highest percentage was in France that produced in 2020, 66.9 % of its net electricity using nuclear when the lowest from the producing countries is in the Netherlands with 3.3 %.
(%)
Source: Eurostat (nrg_bal_peh)
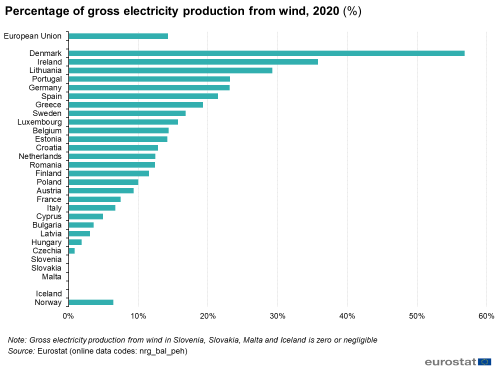
Regarding the percentage of wind production in 2020, Denmark, Ireland and Lithuania have the highest with 56.8 %, 35.8 % and 29.2 % respectively. Gross electricity production from wind in Slovenia, Slovakia, Malta and Iceland is zero or negligible.
(EUR per kWh)
Source: Eurostat (nrg_bal_peh)
Figure 7 shows the percentage of solar in gross electricity production in 2020. Malta, Greece and Italy have the highest percentage with 11.1 %, 9.2 %, 8.9 % respectively. The lowest is observed in Finland (0.3 %), Ireland (0.2 %) and Latvia (0.1 %). Gross electricity production from solar photovoltaics in Iceland and Norway is zero or negligible.
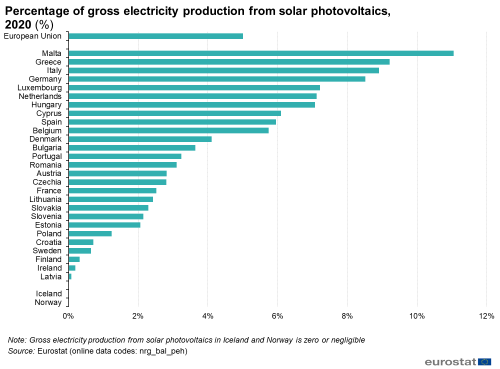
(EUR per kWh)
Source: Eurostat (nrg_bal_peh)
Electricity consumption for road transport
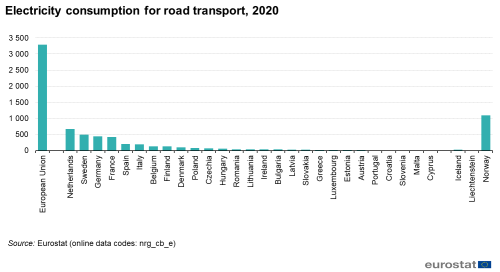
In the electricity consumption in the road sector, electric vehicles charging is included as well as the energy consumption of electric trolley busses. In absolute terms for 2020, we see the positive example of Norway, where 1 089 GWh are mostly used for charging electric vehicles. Other positive examples are the Netherlands and Sweden with the consumption of 673 GWh and 495 GWh respectively, mostly for electric vehicles charging. At this stage, electricity consumption in the road sector stays statistically under-reported. Therefore, the data are not yet stable, and their quality is lower than expected.
Transport sector data analysis
Development of electricity prices for non-household consumers
Figure 9 shows the change in electricity prices for non-household consumers including all non-recoverable taxes and levies from the first half of 2020 to the first half of 2021. For comparison purposes the national currencies were used. These prices dropped in eleven EU Member States. The biggest decreases were recorded in Slovenia (-6.5 %) and Portugal (-5.2 %), closely followed by Romania (-5.1 %). It increased in the other sixteen EU Member States. We recorded by far the largest increase in Denmark (29.8 %), with Bulgaria in the second place (18.0 %), followed by Estonia (16.3 %). Other countries with an increase of 10.0 % or more are Ireland (14.0 %), Lithuania (10.9 %) and Greece (10.0 %).
(%)
Source: Eurostat (nrg_pc_205)
Share of transmission & distribution costs for non-household electricity consumers
Figure 10 presents the share of transmission & distribution costs for non-household electricity consumers. Transmission and distribution costs are only reported once a year, at the end of the second semester. Therefore this section refers to 2020 data. As for households consumers, distribution costs account for the largest share, compared to transmission costs. This is normal for all types of networks including the electricity system. Transmission network is used for transmitting bulk amounts of energy in long distances. The distribution network is usually where the consumers are connected. The distribution network is denser than the transmission network, therefore, its share at the costs are expected to be higher.
Countries with lower population density more extensive transmission network to meet their needs. Its costs are higher, when compared to the countries with higher population density. Smaller, densely populated countries use mostly their distribution network.
However, several non-households consumers can be directly connected to the transmission network or use part of the distribution network (medium voltage only). Therefore, transmission cost share can be higher when compared to households consumers.
In 2020, Luxembourg, Czechia and Sweden have the highest share of distribution costs, with 91%, 90.8% (estimated) and 87.8% respectively. In 2020, Belgium, Italy and Denmark have the highest share of transmission costs with 57.6 %, 54.2 % and 48.0 % respectively.
|alt=100% vertical stacked bar chart on the share of transmission and distribution costs paid by non-household consumers for electricity in 2020 in the EU Member States and some EFTA countries, candidate countries, potential candidates and other countries. Each bar shows the share of transmission costs and the share of distribution costs.Source data for tables and graphs
Data sources
Defining household consumers
Throughout this article, references to household consumers relate to the medium standard household consumption band with an annual electricity consumption between 2 500 and 5 000 kWh. All figures are consumer retail prices and include taxes, levies and VAT. The full datasets for electricity prices for households consumers are available at:
- Electricity prices for household consumers - bi-annual data (from 2007 onwards) (nrg_pc_204)
- Electricity prices components for household consumers - annual data (nrg_pc_204_c)
and
Defining non-household consumers
Throughout this article, references to non-household consumers relate to the medium standard non-household consumption band with an annual consumption of electricity between 500 and 2 000 MWh. In this article, prices correspond to the price for electricity production, its supply, the network costs and includes all non-recoverable taxes and levies. The full datasets for electricity prices for non-households consumers are available at:
- Electricity prices for non-household consumers - bi-annual data (from 2007 onwards) (nrg_pc_205)
- Electricity prices components for non-household consumers - annual data (nrg_pc_205_c)
and
Methodology
Prices in national currencies are converted into euro using the average exchange rate of the period for which the prices were reported.
Prices are always compared with the prices of the same semesters (i.e. year on year) in order to avoid seasonal effects.
In 2016, Regulation (EU) 2016/1952 entered into force. It defines the obligation for the collection and dissemination of electricity prices for household and non-household consumers. Until 2016, the domain of non-household consumers was defined as industrial consumers, but reporting authorities were allowed to include other non-household consumers. Regulation (EU) 2016/1952 changed the definition from industrial to non-household consumers to have a unique methodology for all reporting countries. Until January 2017, the reporting authorities provided their price data for the household sector on a voluntary basis.
Electricity tariffs or price schemes vary from one supplier to another. They may result from negotiated contracts, especially for large non-household consumers. For smaller consumers, they are generally set according to a number of characteristics including the amount of electricity consumed. Most tariffs also include some form of fixed charge. There is, therefore, no single price for electricity. In order to compare prices over time and between EU Member States, this article shows information for consumption bands for household consumers and for non-household consumers. Electricity prices for household consumers are divided into five annual consumption bands and, for non-household consumers, into seven different consumption bands.
The prices collected cover average prices over a period of six months (a half-year or semester) from January to June (first semester) and from July to December (second semester) of each year. Prices include the basic price of electricity, transmission and distribution charges, meter rental, and other services. Electricity prices for household consumers presented in this article include taxes, levies, non-tax levies, fees and value added tax (VAT) as this generally reflects the total price paid by household consumers. As non-household consumers are usually able to recover VAT and some other taxes, prices for non-household consumers are shown without VAT and other recoverable taxes/levies/fees. The unit for electricity prices is that of euro per kilowatt-hour (EUR per kWh).
Context
The price and reliability of energy supplies, electricity in particular, are key elements in a country’s energy supply strategy. Electricity prices are of particular importance for international competitiveness, as electricity usually represents a significant proportion of total energy costs for industrial and service-providing businesses. Contrary to the price of fossil fuels, which are usually traded on global markets with relatively uniform prices, electricity prices vary widely among EU Member States. The price of primary fuels and, more recently, the cost of carbon dioxide (CO2) emission certificates influence, to some degree, the price of electricity.
Communication from the Commission to the European Parliament, the Council, the European Economic and Social Committee and the Committee of the Regions, Tackling rising energy prices: a toolbox for action and support, COM2021(0660) final, points out the observed increase of wholesale energy prices. It is expected that it will be reflected in the final consumer prices in the official statistics for this reference period. The energy prices evolution in the second semester 2021 will be available as European official statistics level in April 2022.
The EU has acted to liberalize electricity and gas markets since the second half of the 1990s. Directives adopted in 2003 established common rules for internal markets for electricity and natural gas. Up to now, significant barriers to entry remain in many electricity and natural gas markets as seen through the number of markets still dominated by (near) monopoly suppliers.
In 2019, the European Commission presented the Clean energy for all Europeans package. The Commission completed a comprehensive update of its energy policy framework to facilitate the transition away from fossil fuels towards cleaner energy and to deliver on the EU’s Paris Agreement commitments for reducing greenhouse gas emissions.
The Fit for 55 legislative proposals cover a wide range of policy areas including climate, energy, transport and taxation, setting out the ways in which the Commission will reach its updated 2030 target in real terms.
Regulation (EU) No 2016/1952 tackles data weaknesses led to the recommendation to improve the detail, transparency and consistency of energy price data collection. An energy prices and costs report would be prepared every 2 years. The European Commission thus published such a report also in 2016 and 2018.
The fourth report on energy prices and costs was published in October 2020, as part of the 2020 State of the energy union report, which focuses on progress made on the EU’s policies on the energy transition policies and initiatives related to the European Green Deal. It also assesses the impact of the COVID-19 pandemic on the recent and expected evolution of the analyzed indicators. The 2021 State of the Energy Union report is expected to be published at the end of October 2021.
Increased transparency for gas and electricity prices should help promote fair competition, by encouraging consumers to choose between different energy sources (oil, coal, natural gas and renewable energy sources) and different suppliers. Energy price transparency is more effective when publishing and broadcasting as widely as possible prices and pricing systems.
Direct access to
Other articles
Main tables
- Energy (t_nrg), see
- Energy statistics - main indicators (t_nrg_indic)
- Electricity prices by type of user (ten00117)
Database
- Energy (nrg), see:
- Energy statistics - prices of natural gas and electricity (nrg_price)
- Energy statistics - natural gas and electricity prices (from 2007 onwards) (nrg_pc)
- Energy statistics - natural gas and electricity prices (until 2007) (nrg_pc_h)
Dedicated section
Methodology
- Energy statistics — electricity prices for domestic and industrial consumers, price components (ESMS metadata file — nrg_pc_204_esms)
Visualisations
External links
- Eurelectric
- Europe's Energy Portal
- European Commission — Energy
- Weekly oil bulletin (weekly pump prices)
- State of the energy union reports (State of the energy union reports)
