Archive:Extra-EU trade in goods
Data from March 2019.
Planned update: March 2020.
Highlights
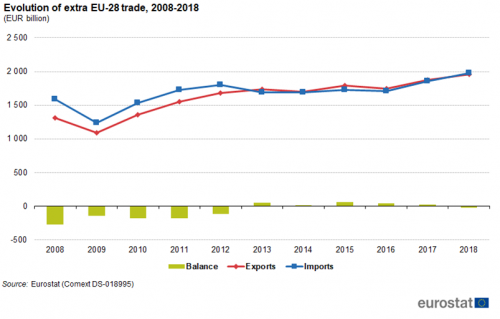
EU imports grew faster than exports and consequently the trade balance fell from EUR + 22 billion in 2017 to EUR - 25 billion in 2018.
The main destination for EU exports in 2018 was Asia accounting for about one third of the total, followed by North America (28 %) and other European countries (22 %).
International trade - especially the size and evolution of imports and exports - is an important indicator of the performance of the European Union (EU) economy, showing how it interacts with other countries and its position.
This article takes a close look at recent trends in imports and exports, focusing on extra-EU trade, the main trading partners, and the most traded products.
This article is part of an online publication providing recent statistics on international trade in goods, covering information on the EU's main partners, main products traded, specific characteristics of trade as well as background information.
Full article
Evolution of extra-EU trade
European Union trade in goods recovered in both imports and exports after the rapid decline in 2009, following the financial turmoil at the end of 2008 (see Figure 1). However, between 2012 and 2016 imports fell, while exports grew. As a result, from 2013 to 2017 the EU trade balance was positive, while between the beginning of the series in 2008 and 2012 it was negative. In 2018, imports grew more than exports and consequently the trade surplus of EUR 22 billion turned into a trade deficit of EUR 25 billion.
In 2018, about 44 % of EU imports came from Asian countries while other European countries accounted for 24 % and North America for 20 % (see Figure 2). The main destination for EU exports in 2018 was Asia with about one third of the total, followed by North America (28 %) and other European countries (22 %). The EU had a considerable deficit in trade with Asian countries, while the largest surplus is recorded in trade with North America.
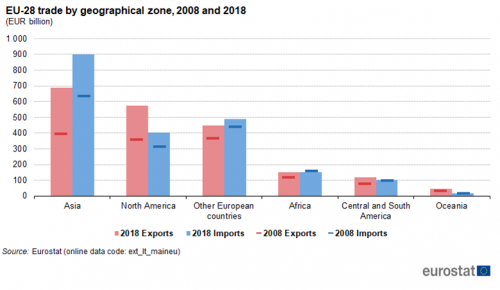
(EUR billion) - Source: Eurostat (ext_lt_maineu)
Main EU partners
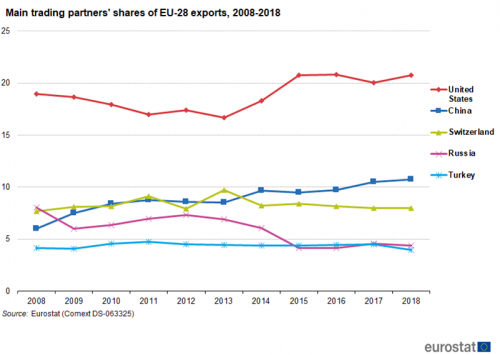
The USA has traditionally been the EU’s major trading partner in particular in exports (see Figure 3). Although its relative significance declined between 2008 (19 % of total extra-EU exports) and 2013 (17 %) it increased again until 2016 (21 %). It dropped slightly in 2017 (20 %) but in 2018 was back to 21 %. Between 2008 and 2018, China's share in extra-EU exports grew from 6 % to 11 %. Consequently, it overtook Switzerland as second largest export destination in 2014.
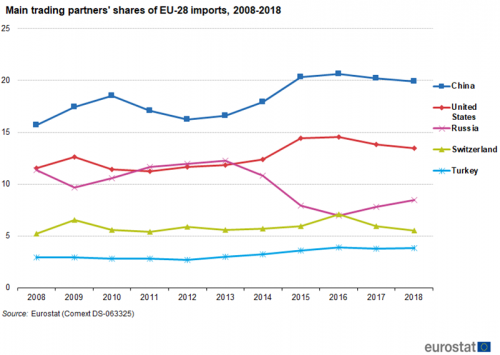
The EU's main import partner is China (see Figure 4). Its share increased from 16 % of total extra-EU imports in 2008 to 20 % in 2018. Imports from the United States were around 12 % between 2008 and 2014 but then started growing, peaking at 15 % in 2016 before dropping to 13 % in 2018. Imports from Russia fluctuate due to the price of energy products. From 2011 to 2013 (12 %) they were slightly higher than imports from the United States but they fell to 7 % in 2016 before growing slightly to 8 % in 2018.
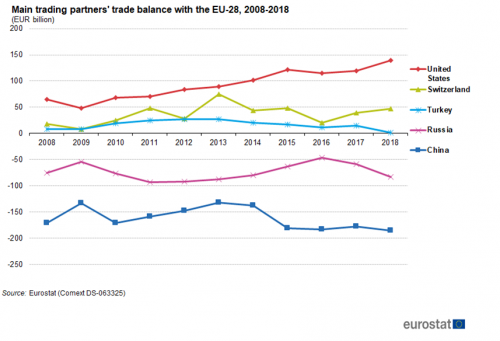
The EU trade surplus with the United States grew from EUR 65 billion in 2008 to a record high of EUR 139 billion in 2018. (see Figure 5). The EU also had trade surpluses with Switzerland and Turkey which in 2018 were EUR 48 billion and EUR 1 billion respectively. With Russia the EU had a trade deficit (EUR 83 billion in 2018) mainly due to the imports of energy products. The trade deficit with China was EUR 185 billion in 2018, largely due to trade surpluses for manufactured goods.
EU trade by main product groups
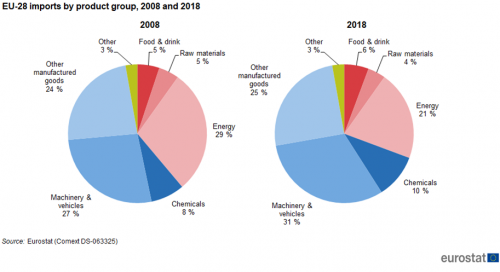
Figures 6 and 7 show exports and imports by product group. The primary products (food and drink, raw materials and energy) are shown in red colours while the manufactured products (chemicals, machinery and vehicles and other manufactured goods) are shown in blue colours.
The EU exports mainly manufactured products: from 2008 to 2018 their share decreased slightly from 83 % to 82 % of total EU exports (see Figure 6). In 2018, machinery and vehicles made up 41 % of the total exports while other manufactured goods accounted for 22 % and chemical products for 18 %. Primary products accounted for 15 % of total exports. This category is made up of food and drink (6 %), energy products (6 %) and raw materials (3 %).
The majority of EU imports are also manufactured goods (see Figure 7). Their share in total EU imports increased from 58 % in 2008 to 67 % in 2018. The breakdown diverges from exports: machinery and vehicles (31 %) and chemical products (10 %) have smaller shares while the share of other manufactured goods (25 %) is similar to that for exports. The share of energy in imports has significantly decreased in recent years. In 2008 it accounted for 29 % of imports, while in 2018 the share had fallen to 21 %. This decrease is closely related to the fall of the oil price in this period.
Source data for tables and graphs
Data sources
EU data come from Eurostat’s COMEXT database. COMEXT is the Eurostat reference database for international trade. It provides access not only to both recent and historical data from the EU Member States but also to statistics of a significant number of third countries. International trade aggregated and detailed statistics disseminated from Eurostat are compiled from monthly COMEXT data. Because COMEXT is updated on a daily basis, data published on the website may differ from data stored in COMEXT in case of recent revisions.
EU data are compiled according to community guidelines and may, therefore, differ from national data published by Member States. Statistics on extra-EU trade are calculated as the sum of trade of each of the 28 Member States with countries outside the EU. In other words, the EU is considered as a single trading entity and trade flows are measured into and out of the area, but not among EU Member States.
Unit of measure Trade values are expressed in billions (109) of euros. They correspond to the statistical value, i.e. to the amount which would be invoiced in case of sale or purchase at the national border of the reporting country. It is called a FOB value (free on board) for exports and a CIF value (cost, insurance, freight) for imports.
Context
Europe is the world's largest exporter of manufactured goods and services, and is itself the biggest export market for around 80 countries. Trade is an important indicator of Europe's prosperity and place in the world, and the bloc has become deeply integrated into global markets both for the products it sources and the exports it sells.
Because the 28 Member States of the European Union share a single market and a single external border, they also have a single trade policy. Both in the World Trade Organization, where the rules of international trade are agreed and enforced, and with individual trading partners, EU Member States speak and negotiate collectively.
Direct access to
- International trade data (t_ext)
- International trade long-term indicators (t_ext_lti)
- International trade short-term indicators (t_ext_sti)
- International trade data (ext)
- International trade long-term indicators (ext_lti)
- International trade short-term indicators (ext_sti)
- International trade detailed data (detail)
- International trade in goods statistics - background
- International trade in goods (ESMS metadata file — ext_go_agg_esms)
- User guide on European statistics on international trade in goods
- Regulation (EC) No 471/2009 of 6 May 2009 on Community statistics relating to external trade with non-member countries
- Regulation (EU) No 92/2010 of 2 February 2010 implementing Regulation (EC) No 471/2009, as regards data exchange between customs authorities and national statistical authorities, compilation of statistics and quality assessment
- Regulation (EU) No 113/2010 of 9 February 2010 implementing Regulation (EC) No 471/2009 , as regards trade coverage, definition of the data, compilation of statistics on trade by business characteristics and by invoicing currency, and specific goods or movements.
