Archive:European Neighbourhood Policy - South - transport statistics
Data extracted in December 2018.
Planned article update: January 2020.
Highlights
In 2017 the longest road network among the ENP-South countries was recorded in Egypt (177 thousand km).
The largest decreases between 2007 and 2017 in the number of road deaths in the ENP-South countries were observed in Jordan (down 31 %) and Egypt (down 44 %).
The length of the rail network in most of the ENP-South countries grew during the period 2007 to 2017, with particularly high growth rates in Algeria (up 24.3 %), Egypt (37.8 %) and Israel (51.6 %).
(number per 1 000 inhabitants)
Source: Eurostat (tran_r_vehst) and (demo_gind)
This article is part of an online publication; it presents information on a range of transport statistics for the European Union (EU) and 8 of the 10 countries that form the European Neighbourhood Policy-South (ENP-South) region — Algeria, Egypt, Israel, Jordan, Lebanon, Morocco, Palestine [1] and Tunisia; no recent data available for Libya or Syria. It presents information covering transport infrastructure as well as passenger and freight transport for four different modes of transport: road, rail, air and maritime. Note that further information relating to the final energy consumption of the transport sector is presented in Figure 4 of an article on energy and the environment for the ENP-South countries.
Full article
Road transport
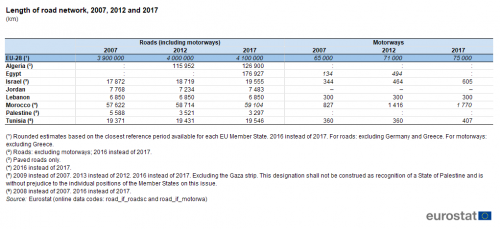
There are considerable variations between the ENP-South countries as regards their levels of economic development, their total (land) area and population numbers and their geography; hence, it is unsurprising to find wide ranging differences in levels of road (and other transport) infrastructure. Table 1 provides some basic information on the length of road and motorway networks, measured in kilometres (km). Based on the latest available information, the ENP-South countries together had a combined road network that was approximately one tenth of the length of the EU-28 network. The longest road network among the ENP-South countries was recorded in Egypt (177 thousand km in 2017).
(km)
Source: Eurostat (road_if_roadsc) and (road_if_motorwa)
Many areas in the ENP-South countries are very sparsely populated and this may, at least to some degree, explain the relatively low level of development of motorway infrastructure. The longest motorway network in the ENP-South countries was recorded in Morocco (1.8 thousand km; 2016 data), while the next longest motorway network was reported in Israel (605 km; 2017 data).
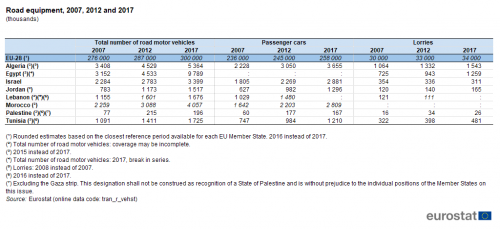
Among the ENP-South countries, car ownership is usually less commonplace than in the EU and cars tend to account for a lower share of the total number of road vehicles. Subject to data availability, Table 2 shows that Algeria had the highest total number of passenger cars, at 3.7 million in 2015, followed by Israel and Morocco (both 2.8 million; 2017 data).
In 2016, the share of passenger cars in the total number of road motor vehicles in the EU-28 was estimated to be around 86 %. In 2017, Jordan, Palestine (2016 data) and Israel all recorded ratios of 85 %, similar to the ratio in the EU-28. The lowest shares were recorded in Algeria (68 %; 2015 data), Morocco (69 %) and Tunisia (70 %; 2016 data). By contrast, Algeria had the highest number of lorries (1.5 million) on its roads in 2015, followed by Egypt (1.3 million; 2017 data).
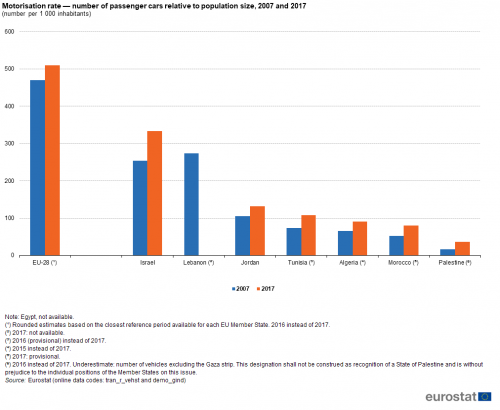
The motorisation rate (see Figure 1) shows the number of passenger cars relative to the size of the population. Israel had the highest motorisation rate among the ENP-South countries (subject to data availability), at 334 per 1 000 inhabitants in 2017. This was far more than the next highest motorisation rate among the ENP-South countries for which recent data are available, 132 per 1 000 inhabitants in 2017 in Jordan. The lowest motorisation rate among the ENP-South countries was 36 per 1 000 inhabitants in Palestine in 2016.

(number per 1 000 inhabitants)
Source: Eurostat (tran_r_vehst) and (demo_gind)
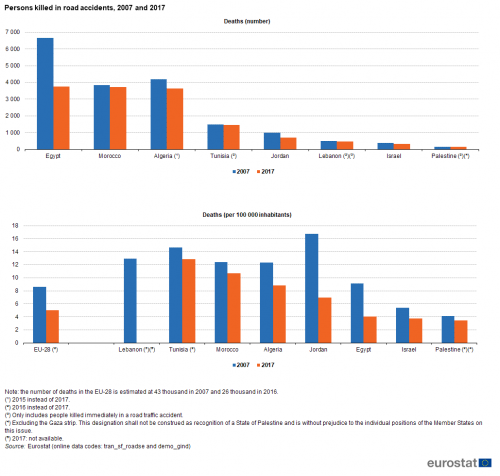
Figure 2 presents information on the number of persons killed in road accidents. In the EU-28 there was a marked reduction (down 40 %) in the total number of road deaths between 2007 and 2016, as the estimated number of fatalities fell to 26 thousand from 43 thousand. On the basis of the latest information available for the ENP-South countries, there were 14.2 thousand persons killed in road accidents in 2017 in the eight countries covered by this article. Egypt and Morocco recorded the highest numbers of people killed in road accidents (both 3.7 thousand) in 2017, followed by Algeria (3.6 thousand; 2015 data). Overall, there was a substantial decrease between 2007 and 2017 (2015 or 2016 for some countries) in the number of road deaths in the ENP-South countries, a fall of about one fifth, equivalent to 4 thousand fewer deaths. The only individual ENP-South country that recorded an increase was Palestine, where there were 6 % more deaths in 2016 than in 2007. The largest decreases between 2007 and 2017 in relative terms were observed in Jordan (down 31 %) and Egypt (down 44 %).
Source: Eurostat (tran_sf_roadse) and (demo_gind)
The information presented in the second part of Figure 2 takes account of the population size of each country, dividing the number of people killed in road accidents by the population to give a ratio per 100 000 inhabitants. Palestine (2016 data), Israel and Egypt recorded lower ratios — respectively 3.5, 3.7 and 4.1 deaths from road accidents per 100 000 inhabitants — than in the EU-28 (5.0; 2016 data). By contrast, the number of people killed in road accidents relative to population size was more than twice the EU-28 average in Morocco and Tunisia (2016 data); older data also indicate a relatively high ratio for Lebanon.
Rail transport
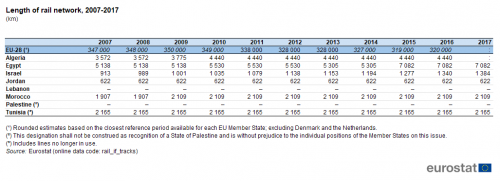
Capacity is one aspect which may constrain the expansion of rail transport, either in terms of the number/length of railway lines, or the rolling stock available to transport people and goods. Combining the length of the rail networks in the ENP-South countries in 2016 or 2017 (see Table 3) gives a total equivalent to 5-6 % of the EU-28 network in 2016, with the longest networks in Egypt (7.1 thousand km; 2017 data) and Algeria (4.4 thousand km; 2016 data); note that there are no operational railway lines in Lebanon or Palestine. Between 2007 and 2016, the length of the EU-28 rail network was reduced by approximately 8 %. By contrast, the length of the rail network in most of the ENP-South countries grew during the period 2007 to 2017, with particularly high growth rates in Algeria (up 24.3 % overall; 2007-2016), Egypt (37.8 %) and Israel (51.6 %). The length of the rail network was unchanged in Jordan and Tunisia during this period.
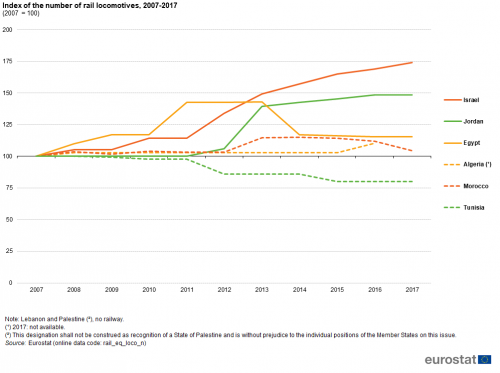
An alternative measure of rail capacity is provided by a count of the number of locomotives. These data —as shown in Figure 3 — confirm the expansion of rail infrastructure across several ENP-South countries. This was particularly the case in Israel and Jordan, where the number of rail locomotives increased between 2007 and 2017 by 74 % and 48 % respectively; by contrast, the number of locomotives contracted during the period under consideration in Tunisia. The total number of rail locomotives was highest in Egypt (at just over 800 in 2017), which was approximately three times as many as in any of the other ENP-South countries for which data are available; the second and third highest counts of rail locomotives were recorded in Algeria (295; 2016 data) and Morocco (234).
(2007 = 100)
Source: Eurostat (rail_eq_loco_n)
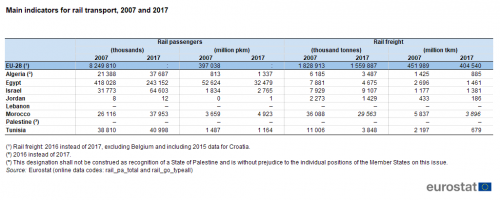
Table 4 presents a set of indicators for analysing rail passenger and rail freight developments. There were 424 million passengers carried on the rail networks of six ENP-South countries in 2017 (2016 data for Algeria; no data for Libya or Syria; no railway in Lebanon or Palestine). Between 2007 and 2017 the number of rail passengers more than doubled in Israel, while there was also a considerable increase in passenger numbers in Algeria (up 76 %; 2007-2016). By contrast, the number of rail passengers in Egypt fell by two fifths (down 42 % or 175 million passengers) between 2007 and 2017.
Source: Eurostat (rail_pa_total) and (rail_go_typeall)
Rail freight services provide an alternative to road freight transport and are generally considered as more environmentally friendly. However, rail services may be constrained by the extent to which the rail network covers a country. Within the EU-28 there was a reduction in rail freight during the period from 2007 to 2016. The quantity of rail freight also fell in the majority of ENP-South countries between 2007 and 2017, with only Israel (among those for which data are available and/or have rail networks) expanding its level of freight with a relative increase of some 15 % during the period under consideration. By contrast, the largest reductions in rail freight were recorded for Tunisia, where the weight of freight carried by rail fell by more than half.
Passenger-kilometres (pkm) and tonne-kilometres (tonne-km or tkm) are also used for analysing transport statistics. On this basis, there was confirmation that the extent of rail passenger transport continued to grow during the period 2007-2017 in Jordan (although the level of rail transport remained very small), Algeria (up 64 %; 2007-2016), Israel (up 51 %) and Morocco (up 35 %). By contrast, when measured in passenger-kilometres rather than simply in terms of the number of passengers, rail passenger transport in Tunisia declined between 2007 and 2017. For rail freight transport, the analysis based on tonne-kilometres reflected the analysis based on tonnes, as lower values were reported in 2017 than in 2007 in all but one of the ENP-South countries (for which data are available), the exception being Israel. The largest contraction in the quantity of rail freight — measured in tonne-km — was recorded in Tunisia, down 69 %.
Air transport
There has been a considerable expansion in air services in recent decades, both in terms of passenger numbers and freight carried. Although there has been rapid growth, it is worth noting that the weight of goods carried by air remains relatively low, given the high cost of this mode of transport (for example, when compared with maritime freight) especially for bulky items.
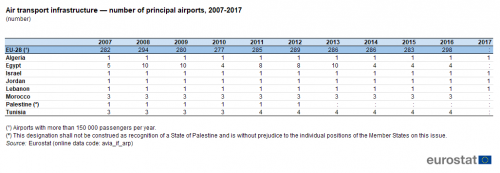
Table 5 shows the number of principal airports: for ENP-South countries these are defined as airports recording more than 1.5 million passenger equivalents per annum (a passenger equivalent is a passenger or 100 kg of freight or mail); note that the data for the EU-28 use a much lower threshold, namely, 150 000 passengers per annum.
(number)
Source: Eurostat (avia_if_arp)
In 2016, there were 298 airports in the EU-28 with more than 150 000 passengers per annum. Egypt and Tunisia (both four; 2016 data) and Morocco (three; 2016 data) had the highest number of principal airports among the ENP-South countries, reflecting the fact that tourism is an important activity in these countries. Given the considerable investment required for building a new airport and the relatively lengthy lead-in times for construction, it is perhaps not surprising to find that there was little (or no) change in the number of principal airports between 2007 and 2017, the notable exception being Egypt where the number dropped sharply between 2013 and 2014.
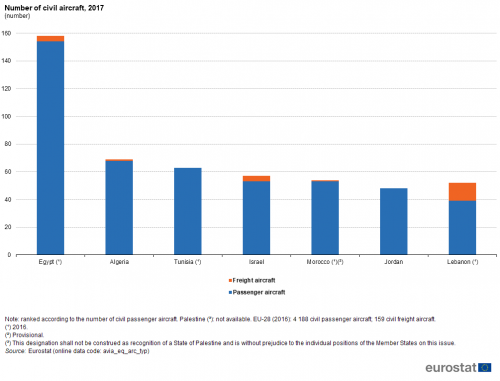
The count of the number of aircraft is defined as civil aircraft registered in each country and configured for the transport of passengers (including their baggage and freight, including mail) or freight (solely for the carriage of freight and/or mail). Figure 4 provides information as to the composition of the civil fleet for 2017.
Among the ENP-South countries, Egypt had by far the highest number of passenger aircraft (154; 2016 data), followed by Algeria (68; 2017 data) and Tunisia (63; 2016 data). In 2017, the largest civil air freight fleet among the ENP-South countries was in Lebanon (13 aircraft; 2016 data), with Egypt (2016 data) and Israel each recording four freight aircraft, and Algeria and Morocco (2016 data) one each.
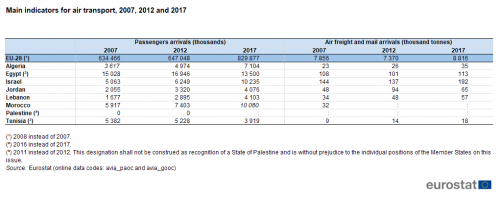
Table 6 presents a set of main indicators for air passenger and air freight transport. Relatively high growth rates for both air passenger arrivals and air freight and mail arrivals were observed for the ENP-South countries during the period 2007 to 2017. With the exception of Tunisian passenger transport, there was growth between 2007 and 2017 in air passenger numbers for each of the ENP-South countries (for which data are available). Israel, Jordan and Algeria recorded some of the highest growth rates, as their number of air passenger arrivals approximately doubled over the period under consideration, while an even faster rate of growth (up overall by 145 %) was recorded in Lebanon.
Source: Eurostat (avia_paoc) and (avia_gooc)
Developments in air passenger numbers over the period 2007-2017 hide, to some degree, the effects of the Arab spring and associated uncertainties in 2011 and thereafter, which resulted in a rapid decline in air passenger arrivals, which was particularly marked in Egypt and Tunisia. In Egypt, annual air passenger numbers fell by 27.2 % in 2011 (compared with their relative high of 2010) and, although recovering somewhat thereafter, a further fall of 21.3 % in 2016 meant that they were 32.5 % lower in 2016 than they had been in 2010. In Tunisia, there was an even greater fall in air passenger arrivals in 2011 (-30.8 %), although there was a rebound of similar magnitude in 2012, with arrivals close to their relative peak of 2010 during the next three years (2012-2014). In 2015, there was a rapid downturn in the number of air passenger arrivals in Tunisia, which may be attributed to the impact of the terror attacks at the end of June 2015 which led to a collapse in the number of tourist arrivals; while the number of arrivals increased somewhat in 2016 it remained well below the 2014 level.
Among the ENP-South countries the quantity of air freight and mail arrivals was highest in Israel, reaching 192 thousand tonnes in 2017; Egypt recorded the second highest quantity of air freight and mail, at 113 thousand tonnes in 2016. Between 2007 and 2017 (2008 or 2016 for some countries), the quantity of air freight and mail increased in each of the ENP-South countries for which data are available. Growth rates for air freight and mail arrivals were usually less pronounced than for air passenger numbers, although the quantity of Tunisian, Lebanese and Algerian air freight increased by more than 50 % between the oldest and most recent years shown in Table 6.
Maritime transport
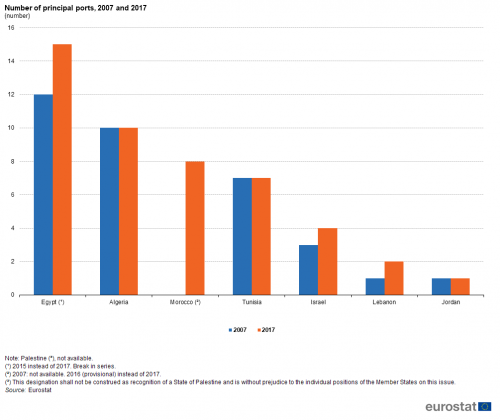
A principal port is defined as a port handling more than one million tonnes of cargo or recording more than 200 000 passenger movements each year. On this basis, Egypt had 15 principal ports in 2015, the highest number recorded among the ENP-South countries (for which data are available); there were 10 principal ports in Algeria in 2017, while Morocco (eight; 2016 data) and Tunisia (seven) had the next highest numbers.
Figure 6 provides information on the number of merchant ships registered in each of the ENP-South countries; it is important to note that it is relatively common for merchant ships to sail under a flag of convenience (whereby a ship can be registered to another country and therefore is not included in the statistics presented here). In 2017, there were 87 merchant vessels of 1 000 gross register tonnage (grt) and over in Egypt (2015 data), while Israel (33 vessels), Jordan (29 vessels) and Algeria (28 vessels) recorded the next highest levels.
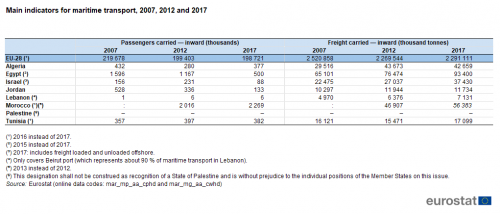
The final table in this article presents some main indicators for maritime passenger and freight transport. The highest number of passengers carried (based on inward movements) among the ENP-South countries was recorded in Morocco (2.3 million in 2016), due in part to its close proximity and ties to mainland Europe, while none of the remaining ENP-South countries carried more than half a million passengers.
Source: Eurostat (mar_mp_aa_cphd) and (mar_mg_aa_cwhd)
Among the ENP-South countries, there was modest growth (12.6 %) in the overall number of passengers carried by maritime services in Morocco between 2013 and 2016, while a lower growth rate was recorded in Tunisia (7.6 %) between 2007 and 2016 and a much higher growth rate (from very low levels) in Lebanon between 2007 and 2017. However, each of the remaining ENP-South countries (among those for which data are available) reported a fall in their number of sea passengers, with sizeable contractions in relative terms in Jordan and Egypt (2007-2015).
Maritime freight transport is especially common for bulky, low value products. In each of the ENP-South countries (for which data are available) there was an increase in the weight of freight carried by sea between 2007 and 2017 (or the most recent year available). Freight transport expanded at a rapid pace in several of the ENP-South countries, with an increase of 66.5 % recorded for the quantity of freight carried to Israel, while Algeria, Egypt (2007-2015) and Lebanon registered increases of 43-45 %. The latest information available shows that Egypt had the highest quantity of inward freight carried by sea, at 93 million tonnes in 2015, which was considerably more than the next highest quantities recorded for Morocco (56 million tonnes; 2016 data) and Algeria (43 million tonnes) in 2017. By contrast, the weight of EU-28 freight arrivals by sea was 2.3 billion tonnes in 2016, which marked an overall reduction of 9.1 % when compared with 2007.
Source data for tables and graphs
Data sources
Data for ENP-South countries are supplied by and under the responsibility of the national statistical authorities of each country on a voluntary basis. The data presented in this article result from an annual data collection cycle that has been established by Eurostat. No recent data are available from either Libya or Syria. These statistics are available free-of-charge on Eurostat’s website, together with a range of different indicators covering most socio-economic areas.
For the EU-28, transport statistics are available with an annual frequency and generally begin in the early 1990s. Eurostat’s statistics describe the most important features of transport, not only in terms of the quantities of freight and numbers of passengers that are moved each year, or the number of vehicles and infrastructure that are used, but also the contribution of transport services to the economy as a whole. Data collection is supported by several legal acts obliging the EU Member States to report statistical data (framework legislation and implementing legislation, organised according to the mode of transport under consideration), as well as voluntary agreements to supply additional data.
Passenger transport statistics
The majority of passenger transport statistics are based on vehicle movements in each of the reporting countries, regardless of the nationality of the vehicle or vessel involved (the ‘territoriality principle’). For this reason, the measure of passenger-kilometres (pkm, which represents one passenger travelling a distance of one kilometre) is generally considered as a more reliable measure, as a count of passengers entails a higher risk of double-counting, particularly for international transport. A rail passenger is any person, excluding members of the train crew, who makes a journey by rail. Air transport statistics concern national and international transport, as measured by the number of passengers carried; information is collected for arrivals and departures. A sea passenger is defined as any person that makes a sea journey on a merchant ship; service staff are excluded, as are non-fare paying crew members travelling but not assigned, as well as infants in arms.
Eurostat publishes transport safety data for road, rail, inland waterways and air transport. CARE is the European centralised database on road accidents which result in death or injury across the EU, developed on the basis of Council Decision 93/704/EC; it is managed by the Directorate-General for Mobility and Transport. A road death is defined as the number of deaths that are caused by road accidents and which occur within 30 days from the date of the accident; the count includes drivers and passengers in motorised vehicles and on bicycles who might be involved in road accidents, as well as pedestrians.
Freight transport statistics
As with passenger transport statistics, freight transport statistics are generally based on movements in each reporting country, regardless of the nationality of the vehicle or vessel involved (the ‘territoriality principle’). For this reason, the measure of tonne-kilometres (tkm or tonne-km, in other words, one tonne of goods travelling a distance of one kilometre) is generally considered a more reliable measure when analysing freight transport statistics, as the simple use of tonnes entails a higher risk of double-counting, particularly for international transport. The weight of goods transported by rail is the gross-gross weight. This includes the total weight of the goods, all packaging, and the tare weight of the container, swap-body and pallets containing goods; it also includes road goods vehicles that are carried by rail. By contrast, the weight measured for maritime and road freight transport is the gross weight (in other words, excluding the tare weight).
Tables in this article use the following notation:
| Value in italics | data value is forecasted, provisional or estimated and is therefore likely to change; |
| : | not available, confidential or unreliable value; |
| – | not applicable. |
Context
An efficient and well-functioning passenger and freight transport system is vital for enterprises and inhabitants. The ability to move goods safely, quickly and cost-efficiently to markets is important for international trade, national distributive trades, and economic development. The rapid increase in international trade up to the onset of the global financial and economic crisis and the deepening integration of the EU’s single market, alongside a range of economic practices (including the concentration of production in fewer sites to reap economies of scale, delocalisation, and just-in-time deliveries), may explain — at least to some degree — developments in the volume of freight being transported.
The European Commission’s Directorate-General for Mobility and Transport is responsible for developing transport policy within the EU. It aims to develop policy to foster clean, safe and efficient travel throughout Europe, underpinning the internal market for goods (transferring them between their place of production and consumption) and the right of citizens to travel freely throughout the EU (for both work and pleasure).
On 18 November 2015, the High Representative for Foreign Affairs and Security Policy and the European Commission jointly presented a review of the European Neighbourhood Policy (SWD(2015) 500 final) which underlined a new approach for the EU in relation to its eastern and southern neighbours, based on stabilising the region in political, economic, and security-related terms.
In cooperation with its ENP partners, Eurostat has the responsibility ‘to promote and implement the use of European and internationally recognised standards and methodology for the production of statistics necessary for developing and monitoring policy achievements in all policy areas’. Eurostat undertakes the task of coordinating EU efforts to increase the statistical capacity of the ENP countries. Additional information on the policy context of the ENP is provided here.
Direct access to
- All articles on non-EU countries
- All articles on transport
- European Neighbourhood Policy countries — statistical overview — online publication
- Statistical cooperation — online publication
Books
Leaflets
- International trade in goods for the European neighbourhood policy-South countries — 2018 edition
- Energy and transport statistics for the European neighbourhood policy-South countries — 2018 edition
- Basic figures on the European Neighbourhood Policy — South countries — 2018 edition
- Basic figures on the European Neighbourhood Policy — South countries — 2016 edition
- Labour force statistics for the Mediterranean region — 2016 edition
- Basic figures on the European Neighbourhood Policy — South countries — 2015 edition
- Transport (med_tr)
- Transport, see:
- Railway transport (rail)
- Road transport (road)
- Maritime transport (mar)
- Air transport (avia)
- Illustrated glossary for transport statistics — 4th edition
- Southern European Neighbourhood Policy countries (ENP-South) (ESMS metadata file — med_esms)
<notes>
Notes
- ↑ This designation shall not be construed as recognition of a State of Palestine and is without prejudice to the individual positions of the Member States on this issue.
