Archive:Switzerland-EU - international trade in goods statistics
- Data extracted in September 2017. Most recent data: Further Eurostat information, Main tables and Database. Planned article update: October 2018.
This article provides a picture of the trade in goods between the European Union (EU) and Switzerland. It analyses the type of goods exchanged between the two economies and the shares of each EU Member State in those exchanges.
Source: Eurostat (ext_lt_introle)
Source: Eurostat (ext_lt_introle)
Source: Eurostat (ext_lt_maineu)
Source: Eurostat (ext_lt_maineu)
Source: Eurostat DS-018995
Source: Eurostat DS-018995
Source: Eurostat (ext_st_eu28sitc)
Source: Eurostat (ext_st_eu28sitc)
Source: Eurostat DS-018995
Main statistical findings
- In 2016, Switzerland was the 10th largest exporter of goods in the world with a share of 2.5 % of world exports and the 12th largest importer with a share of 2.1 % of world imports.
- Among EU's trading partners, Switzerland was the third largest partner both for EU imports and exports in 2016.
- EU trade balance with Switzerland, has been in surplus from 2006 to 2016, peaking at EUR 75 billion in 2013, dropping to EUR 21 billion in 2016.
- Manufactured goods dominate both the exports of goods from the EU to Switzerland and imports from Switzerland to the EU, accounting for over 77 % of the total exports and 75 % of total imports.
- In 2016, among EU Member States, Germany was the largest importer (EUR 41.8 billion) from Switzerland and the largest exporter (EUR 50.2 billion) to Switzerland.
- Italy had the largest trade surplus with Switzerland (EUR 8.4 billion) just ahead of Germany (EUR 8.4 billion). The United Kingdom had the largest trade deficit with Switzerland (EUR 8.3 billion).
EU and Switzerland in world trade in goods
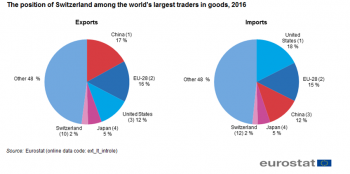
Figure 1 shows that the four largest exporters account for almost half of the world exports. The largest is China (17 %) followed by the EU (16 %), the United States (12 %) and Japan (5 %). The same four also account for almost half of the world imports but in different order. Here the USA (18 %) leads, followed by the EU (15 %), China (12 %) and Japan (5 %). Switzerland is the tenth largest exporter, accounting for 2.5 % of world exports and the twelfth largest importer accounting for 2.1 % for world imports.
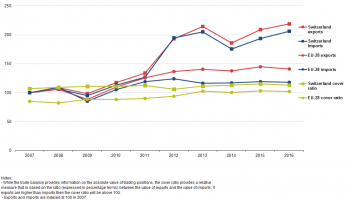
Figure 2 focuses on the evolution of trade in the EU and Switzerland over the period 2007-2016. From 2007 to 2011the exports and imports of both countries grew in a similar fashion. Between 2011 and 2013 Swiss exports and imports grew more rapidly than those of the EU. Swiss exports and imports fell in 2014 but continued to grow in 2015 and 2016. In 2016 the index for exports peaked at 219 % and the index for exports at 207 %. The cover ratio (exports divided by imports ) for Switzerland has been above 100 % since 2007 always somewhat higher than that of the EU. The respective cover ratios for Switzerland and the EU in 2016 were 113 % and 102 %.
Switzerland is the EU's largest European partner for trade in goods
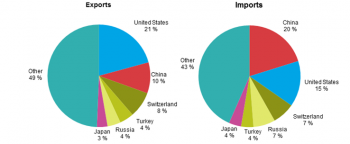
Figure 3 shows that in 2016, Switzerland had a share of 8 % in extra-EU exports (EUR 142 billion) and 7 % in extra-EU imports (EUR 141 billion). This meant that for both imports and exports, it was the EU's biggest European partner and the third largest partner worldwide, behind the United States and China and ahead of Russia, Turkey and Japan.
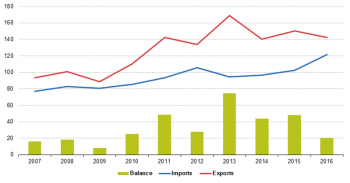
EU imports from Switzerland have been growing steadily since 2007 and were not much effected by the financial crisis. They fell somewhat between 2012 and 2013 but recovered since then reaching 120 billion in 2016. Although exports grew more than imports in the same period there were more fluctuation with decreases in 2009, 2012, 2014 and 2016. They peaked in 2013 at almost 170 billion but dropped to 142 billion in 2016. The trade surplus also peaked in 2013 at 75 billion but in 2016 had dropped to 21 billion.
Manufactured goods dominate trade with Switzerland
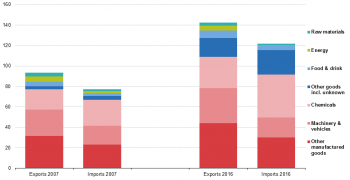
When breaking down imports and exports by SITC groups, the main categories driving the exports to and imports from Switzerland are 'Machinery and vehicles' (SITC 7), 'Chemicals' (SITC 5) and 'Other manufactured goods' (SITC 6&8). Together these manufactured goods accounted for around 77 % of the EU exports and 75 % of imports (see Figure 5). In exports 'Other manufactured goods' were the largest group with 31 % while in imports 'Chemicals' accounted for over one third of the total.
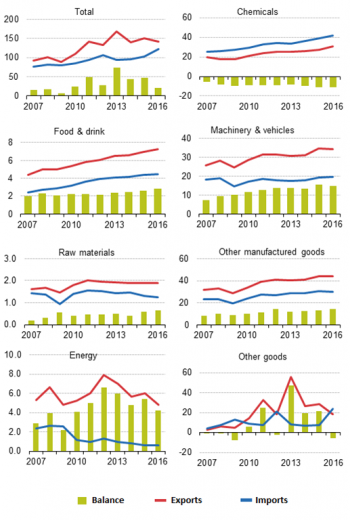
Figure 6 shows the evolution of EU imports and exports by SITC group since 2007. In 2016 the EU had a large trade deficit in 'Chemicals' (EUR 11 billion) and a small deficit in 'Other goods'. In all the other groups the EU had a surplus, which was largest in in 'Machinery and vehicles' (EUR 15 billion) closely followed by 'Other manufactured goods' (EUR 14 billion).
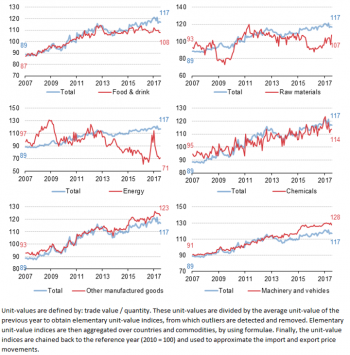
Figure 7a shows the unit value index for EU imports from Switzerland by SITC group. For most of the SITC groups the evolution is fairly similar to the unit value index at total trade level. Only for 'Energy' are there large fluctuations, possibly due to price fluctuations on world markets. Comparing the other five indexes to the index for the total, which stood at 117 in 2016, reveals that 'Raw materials' (107) , 'Food & drink' (108) and 'Chemicals' (108) are below while 'Other manufactured goods' (123) and 'Machinery and vehicles (128) are above, indicating that prices in the latter two groups have risen more than in the first three groups since 2010.
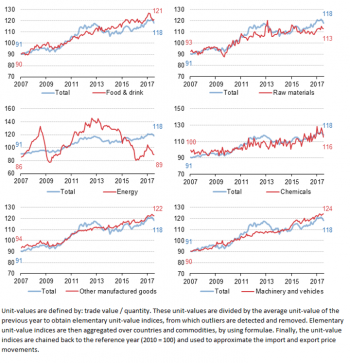
On the export side, the largest fluctuations are also observed for the 'Energy group' (see figure 7b). Compared to the total index the other indexes were at the same side in exports and in imports in 2016. That is to say they were lower than the total index (118) for 'Raw materials' (113) and 'Chemicals' (116) and higher for 'Other manufactured goods' (122) and 'Machinery and vehicles (124) albeit with smaller differences than in imports. Only in 'Food & drink' the export index (121) was above the total while the import index (108) was below. This meant that prices for exports of 'Food and drink' to Switzerland had risen more than for imports from Switzerland.
Most traded goods: non-monetary gold and medicaments
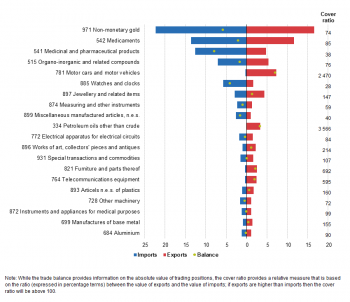
Figure 8 gives more details about the goods exchanged between the EU and Switzerland, showing the top 20 traded goods at a more detailed level (by SITC level 3). Those top 20 goods covered around 60 % of total traded goods in 2016. Ten products among the top 20 belong to 'Other manufactured goods' three each to 'Chemicals', 'Machinery and vehicles' and 'Other goods' and one to 'Energy'. The most trade product was non-monetary gold while the second and third most traded products were medicaments and medicinal and pharmaceutical products respectively.
Another interesting way to look at data is to investigate the export/import ratio of traded goods, in order to better identify the direction taken by flows and specialisation between the two areas. These ratios can be found in the right margin of Figure 9. For the top product, non-monetary gold, the ratio equals 74 meaning that the EU exports could pay for only 74 % of imports. Fifteen of the twenty products have ratios between 30 and 300 indicating that there are substantial trade flows in both directions. The highest cover ratios (corresponding to large trade surpluses for the EU) were found for cars and petroleum oils while the lowest (large trade deficit) was recorded for watches and clocks.
Germany is trading most with Switzerland
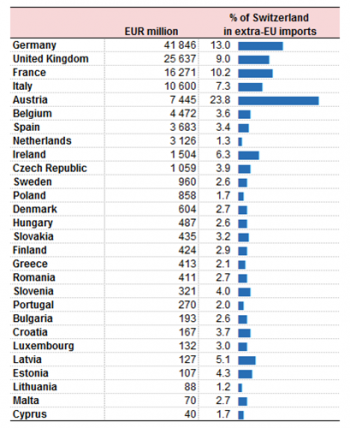
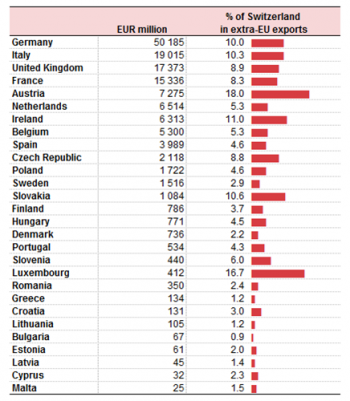
Figure 9a shows Member States' imports from Switzerland and the share of the partner Switzerland in national extra-EU imports. Table 9b provides similar information but concerning Member States' exports to Switzerland.
There are four Member States whose imports from Switzerland in 2016 were higher than EUR 10 billion: the Germany, United Kingdom, France and Italy. Together they accounted for 77 % of imports from Switzerland. Three countries had more than 10 % of their imports originating from Switzerland namely Austria (23 %), Germany (13 %) and France (10 %)
The four large importers from Switzerland were also the largest exporters to Switzerland again with Germany as the largest, followed by Italy, the United Kingdom and France. Their combined share in total EU exports to Switzerland was 72 %. For six Member States Switzerland received at least 10 % of their total extra-EU exports. These were Austria, (18 %), Luxembourg , (17 %), the Netherland and Slovakia (both 11 %) and Italy and Germany (both 10 %).
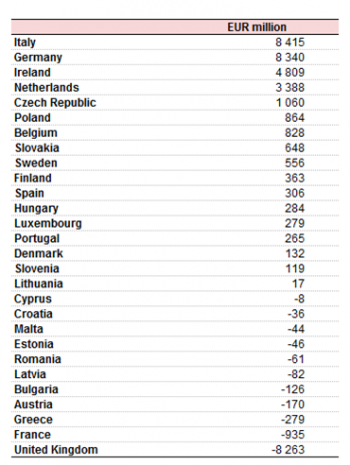
Figure 9c shows that 11 Member States had a trade deficit with Switzerland in 2016, ranging from just EUR 8 million for Cyprus to EUR 8 263 million for the United Kingdom. Italy (EUR 8 415 million), just ahead of Germany (EUR 8 415 million) had the largest trade surpluses while Ireland (EUR 4 809 million), the Netherlands (EUR 3 388 million) and the Czech Republic (EUR 1 060 million) also had trade surpluses exceeding EUR 1 billion.
Data sources and availability
EU data is taken from Eurostat's COMEXT database. COMEXT is the reference database for international trade in goods. It provides access not only to both recent and historical data from the EU Member States but also to statistics of a significant number of third countries. International trade aggregated and detailed statistics disseminated via the Eurostat website are compiled from COMEXT data according to a monthly process.
Data are collected by the competent national authorities of the Member States and compiled according to a harmonised methodology established by EU regulations before transmission to Eurostat. For extra-EU trade, the statistical information is mainly provided by the traders on the basis of customs declarations.
EU data are compiled according to Community guidelines and may, therefore, differ from national data published by the Member States. Statistics on extra-EU trade are calculated as the sum of trade of each of the 28 EU Member States with countries outside the EU. In other words, the EU is considered as a single trading entity and trade flows are measured into and out of the area, but not within it.
Data for the other major traders are taken from the Comtrade database of the United Nations. Data availability differs among countries, therefore Figure 1 shows the latest common available year for all the main traders. For the calculation of shares the world trade is defined as the sum of EU trade with non-EU countries (source: Eurostat) plus the international trade of non-EU countries (source: IMF Dots database).
Methodology
According to the EU concepts and definitions, extra-EU trade statistics (trade between EU Member States and non-EU countries) do not record exchanges involving goods in transit, placed in a customs warehouse or given temporary admission (for trade fairs, temporary exhibitions, tests, etc.). This is known as ‘special trade’. The partner is the country of final destination of the goods for exports and the country of origin for imports.
Product classification
Information on commodities exported and imported is presented according to the Standard international trade classification (SITC). A full description is available from Eurostat’s classification server RAMON.
Unit of measure
Trade values are expressed in millions or billions (109) of euros. They correspond to the statistical value, i.e. to the amount which would be invoiced in case of sale or purchase at the national border of the reporting country. It is called a FOB value (free on board) for exports and a CIF value (cost, insurance, freight) for imports.
Context
Trade is an important indicator of Europe’s prosperity and place in the world. The block is deeply integrated into global markets both for the products it sources and the exports it sells. The EU trade policy is an important element of the external dimension of the ‘Europe 2020 strategy for smart, sustainable and inclusive growth’ and is one of the main pillars of the EU’s relations with the rest of the world.
Because the 28 EU Member States share a single market and a single external border, they also have a single trade policy. EU Member States speak and negotiate collectively, both in the World Trade Organization, where the rules of international trade are agreed and enforced, and with individual trading partners. This common policy enables them to speak with one voice in trade negotiations, maximising their impact in such negotiations. This is even more important in a globalised world in which economies tend to cluster together in regional groups.
The openness of the EU’s trade regime has meant that the EU is the biggest player on the global trading scene and remains a good region to do business with. Thanks to the ease of modern transport and communications, it is now easier to produce, buy and sell goods around the world which gives European companies of every size the potential to trade outside Europe.
See also
Further Eurostat information
Data visualisation
Main tables
- International trade in goods (t_ext_go), see:
- International trade in goods - long-term indicators (t_ext_go_lti)
- International trade in goods - short-term indicators (t_ext_go_sti)
Database
- International trade in goods (ext_go), see:
- International trade in goods - aggregated data (ext_go_agg)
- International trade in goods - long-term indicators (ext_go_lti)
- International trade in goods - short-term indicators (ext_go_sti)
- International trade in goods - detailed data (detail)
- EU trade since 1988 by SITC (DS-018995)
Dedicated section
Methodology / Metadata
- International trade in goods statistics - background
- International trade in goods (ESMS metadata file — ext_go_esms)
- User guide on European statistics on international trade in goods
Source data for tables, figures and maps (MS Excel)
External links
- European Commission
