- Data from July 2010, most recent data: Further Eurostat information, Main tables and Database.
Since June 2007, REACH, the new European Union Regulation on the Registration, Evaluation, Authorisation and restriction of Chemicals', is in force. The major objective of REACH is to ensure a high level of protection for human health and the environment, by increasing knowledge about the hazardous properties of chemicals.
Eurostat has, in collaboration with the services responsible for environment and for industry of the European Commission, a baseline study, providing a set of indicators that will monitor the effectiveness of REACH.
This article provides an overview of the methodology and the indicators developed, illustrated by graphs.

Main statistical findings
Background
Previous work carried out by Eurostat in the field dates back to the period from the mid-1990s to 2000 when some Environmental Pressure Indicators (EPI) related to chemicals were developed. One of the recent priorities of Eurostat has been the development of indicators on toxic and environmentally harmful chemicals in order to be able to measure progress towards the headline objective for ‘public health’ established in the EU - Sustainable Development Strategy and the 6th EU Environment Action Programme.
The European Commission and scientific experts expressed the need for developing a baseline before REACH came into force, and an instrument to monitor the effectiveness of REACH. To do so Eurostat proposed the development of a set of risk-based (and not damage-based) indicators.
A REACH Baseline Study with the aim of setting the baseline 2007 of the potential risk for consumers, workers, and the environment was carried out. With the developed methodology, the calculations of the potential risks will be repeated for the 5-year assessment of REACH due in June 2012.
The baseline study has set up an indicator set which will allow the effects of REACH to be monitored (ensuring a high level of protection of human health and the environment as well as enhancing innovation of safer chemicals). It presents a baseline of the (potential) risk caused by chemicals and of the quality of the underlying data which were available when REACH came into force in June 2007.
Policy monitoring by indicators
Will there be a decrease in risk? Will our very limited knowledge of the properties of substances and their safe uses increase due to REACH?

This baseline study aims to provide a set of indicators to monitor whether such changes take place — indicating the success of REACH. The focus of the baseline study is not restricted to indications for the risk itself: The proposed indicator system also enables changes in the quality of the public data on substances and their safe use to be detected. A first 'snapshot' of the situation before REACH has been taken now, a second will be taken after 5 years of experience acquired with the operation of REACH, additional snapshots will be made later.
Comparing the results should enable the success of the REACH legislation to be monitored and assessed.
Three indicator sets combined — close to the objectives of REACH
Administrative indicators: These are used to monitor the REACH process. They refer to the registration, evaluation, authorisation and restriction steps defined by REACH. They will provide figures, for example, on the number of substances registered, the number of
chemical safety reports documented by the European Chemicals Agency or the number of dossiers being evaluated.
Risk and quality indicators: This set directly tracks two major goals of REACH: reduction in the nominal risks of chemicals for humans and the environment as well as improvement in the quality of publicly available data. These changes are assessed for a defined set of
reference substances.
Supplementary indicators: These indicators address specific objectives of REACH not covered by the other two indicator types (e.g. increase in quality of safety data sheets, use of alternative methods for assessment of chemicals instead of animal testing). They can support specific findings from the risk and quality indicator system.

Calculated 'nominal' risk — and a quality assessment of the underlying data 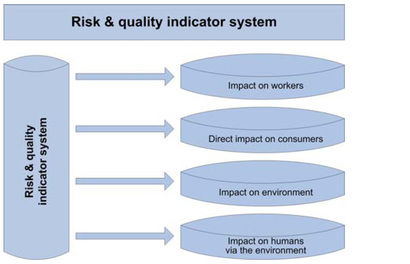

Two questions are of central importance for monitoring the success of REACH:
- How does the (health or environmental) risk change after implementation of REACH?
- How good is the quality of the information on the hazardous properties of chemicals and on exposure to these substances?
The system addresses risks to three impact areas: - the environment, - workers, - the general population, whereby impacts on the general population are divided into direct impact on consumers (resulting from the use of chemicals e.g. paints or glues) and impact on humans via the environment (e.g. drinking water). This indicator system directly assesses the nominal risk caused by exposure to chemicals and characterises the quality of the data on which this risk assessment is based. These characterisations can be followed over time.
Risk score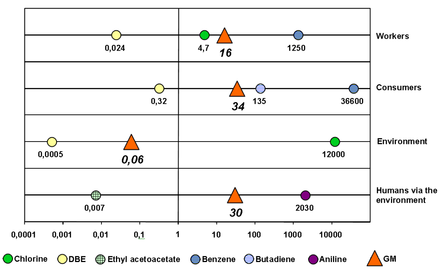

The risk score is a nominal value that indicates to what extent a risk could be associated with the production and use of the substance. This score can range from far below 1 to 10 000 and more. High risk scores are indications of high risk; however, no attempt to define a value discriminating risk from no-risk has been made.
In order to determine the risk score, an exposure assessment and a toxicity assessment have to be made. Data on production volumes, use patterns and physico-chemical properties are needed to assess the exposure and toxicological data are required for the toxicity assessment.
Quality score 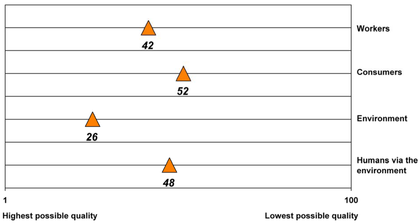

Data sets can be of very different quality: If input data are highly uncertain (default assumptions) the quality of the assessment is regarded as poor. If representative monitoring data and a well defined threshold value are available, the quality of the assessment is regarded as good. A score which ranges from 1 (very good quality of data) to 100 (very poor quality of data) characterises data quality. This quality assessment is a key element of the risk and quality indicator system.
It is expected that REACH will lead to more complete testing of toxicological properties, to better data provided by alternative testing methods such as modelling, improved reporting, and better information on exposure.
Results: Snapshot 2007, setting the baseline
In order to rank the aggregated baseline risk score, it is helpful to know that a risk score of 0.1 would certainly be called 'low', whereas a risk score of 1000 would certainly be called 'elevated'.
However, calculated risk scores for the substances vary over a much wider range. Additionally, the risk scores between workers, consumers, the environment and humans via the environment are not comparable due to differences in the methodology.
Therefore, no upper or lower bounds were set. Instead, it may be helpful to compare the mean risk score for the substances with the risk scores of well known substances.
For the impact areas workers, consumers, the environment and humans via the environment, the results for the reference substances chlorine, benzene, butadiene, dibutyl ether (DBE), ethyl acetoacetate and aniline are indicated in Figure 4. The reference substances show risk scores that spread over a wide range. In a future snapshot, the risk scores will be calculated with then available updated data. The risk scores should move to the left to demonstrate the success of the measures undertaken.
At this level, the calculated mean risk and quality scores are mainly intended for comparison to later points in time, i.e. in the year 2012 or later. The change over the years in the aggregated baseline risk scores and quality scores may become a headline indicator for political communication. As these single figures are much too complex for further interpretation and analysis, disaggregated levels are supplemented. The quality score and the risk score cannot be amalgamated into a single figure. Moreover, any comparisons between different impact areas should be strictly avoided. Such comparisons would be a misinterpretation because — for example — different reference points for risk calculations are used in different impact areas.
Outlook: Snapshot 2012
The figure illustrates the 'desired' result from five years of advanced protection of the environment and human health due to REACH and corresponding chemicals legislation:

A 'movement' of the bulk of the reference substances, mainly the high production volume substances, to the part of the figure where the exposures and toxicity are well known, indicating that risk has been reduced or no risk is expected.
In 2012, in the frame of the first report on the experience gained through the operation of REACH, a second ‘snapshot’ will be taken in order to see whether REACH has already reduced the (nominal) risk caused by chemicals by that time and to see how the quality of the underlying data has evolved. Further snapshots can then be made later. Comparing the results should enable the success of the REACH Regulation to be monitored and assessed.
Data sources and availability
The data used for the calculation of the baseline scenario and the indicators have been obtained from different data sources or by modelling according to the Guidance Documents on Information Requirements and Chemical Safety Assessment.
A main source for production statistics is the PRODCOM database (Eurostat). Movements of chemicals have been calculated by the use of the foreign trade statistics database COMEXT (Eurostat). The chemical and toxicological properties and the information on use patterns have been obtained from
IUCLID (International Uniform Chemical Information Database, ECHA and Eurostat).
Context
The Sixth Environment Action Programme 2002-2012 (sixth EAP) requires a complete overhaul of EU policies on chemicals management, of which REACH is a part. The major objective of REACH is to ensure a high level of protection for human health and the environment. This includes promoting alternative methods to assess the hazards of substances, the free circulation of substances on the internal market, and the enhancement of competitiveness and innovation in the EU chemical industry.
By increasing knowledge about the hazardous properties of chemicals, REACH is expected to enhance the communication and implementation of conditions of safe use in supply chains and the substitution of dangerous substances by less dangerous ones. Through different types of measures, REACH should lead to less risks to human health and the environment.
Further Eurostat information
Publications
- The REACH baseline study – A tool to monitor the new EU policy on chemicals - Statistics in focus 48/2009
- The REACH baseline study - A methodology to set the baseline for REACH and monitor its implementation, June 2009
Main tables
- Indicators
- Public health
- Sub-theme: DETERMINANTS OF HEALTH
- 9. Index of production of toxic chemicals, by toxicity class (QP)
- Public health
External links
- European Chemicals Agency - ECHA
- European Commission - Enterprise and Industry - REACH
- European Commission 6th Environment Action Programme