Archive:Extra-EU trade in primary goods
- Data from May 2014. Most recent data: Further Eurostat information, Main tables and Database.
This article focuses on the structure and evolution of the European Union (EU) international trade in primary goods: imports and exports at EU level. Primary goods, also called commodities, are goods sold for production or consumption just as they were found in nature; they include crude oil, coal, iron, and agricultural products like wheat or cotton.
The Standard international trade classification (SITC) distinguishes five main categories (sections) of primary goods:
- food and live animals (SITC 0 );
- beverages and tobacco (SITC 1);
- crude materials, excluding fuels (SITC 2);
- mineral fuels (SITC 3);
- animal and vegetable oils, fats and waxes (SITC 4).
Sections 0 and 1 are often grouped together as 'food and drink', 2 and 4 as 'raw materials'.
Main statistical findings
Source: Eurostat (TET00034)

Source: Eurostat (TET00034)
Source: Eurostat (TET00033)
Source: Eurostat (TET00033)
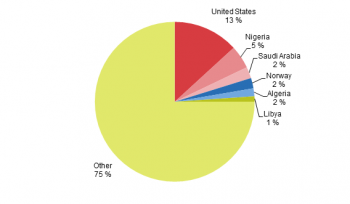
Source: Eurostat (TET00032)
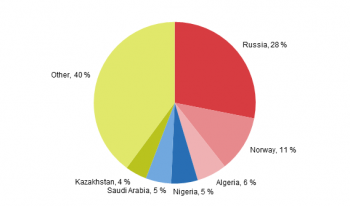
Source: Eurostat (TET00032)
In 2013 exports in primary goods, representing 16 % of total EU exports, showed a small reduction in comparison with 2012. This decrease was the result of a contraction of exports in raw materials and energy products, partly compensated by an increase in imports of food and drink, which reached a record level of EUR 104.3 billion in 2013.
In 2013 primary goods represented about two fifth of EU imports, with energy accounting for the biggest share (30 %). A reduction was registered in comparison with 2012 (-7 %), due to the fall of imports in energy products (-9 %) and in raw materials (-6 %). The EU shows a persistent deficit in trade of primary goods, mainly driven by the deficit in energy products, which tripled between 2002 and 2013.
Food and drink
Product group ‘food and drink’ (SITC Sections 0 and 1) includes agricultural products such as food and live animals, beverages and tobacco.
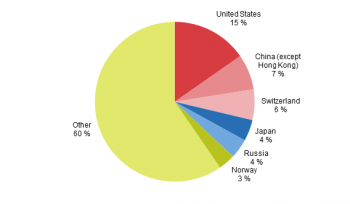
Trade in food and drink remained fairly stable between 2002 and 2004 but rapidly increased from 2005. The EU was traditionally a net importer, but recently posted a trade surplus in both 2012 (EUR 5.9 billion) and 2013 (EUR 10.9 billion). In exports, beverages are the most important individual products within the group, accounting for around a quarter of the total. Other main products include cereals, fruits and vegetables and dairy products.
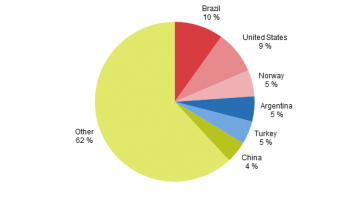
The USA is the main destination country of the EU exports with a 13 % share, followed by Russia, Switzerland and China. Coffee and tea, fruit, vegetables and fish make up about 60 % of the imports. The imports of food and drink are less concentrated than total EU imports. The four main suppliers, Brazil, the USA, Argentina and Norway accounted in 2013 for less than one third of total imports.
Raw materials
Raw materials (SITC Sections 2 and 4) include non-manufactured goods like oilseeds, cork, wood, pulp, textile fibres, ores and other minerals as well as animal and vegetable oils.
The EU has an ongoing trade deficit; both imports and exports have rapidly recovered from the low levels registered in 2009, and in 2013 the deficit amounted to EUR 30.8 billion. In 2013, the great majority of imports were metal ores, with a share of 41 % . Other products to record a large share of imports include vegetable fats and oils and oilseeds.
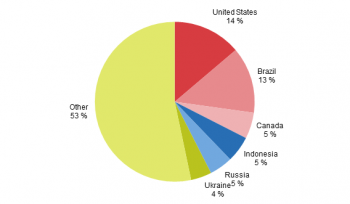
Brazil is the major supplier of EU imports since 2004, however in 2013 imports from Brazil reduced by 22 % and were closer to the level of imports from USA, the second EU supplier. Canada, Indonesia and Russia are the other main partner countries. EU exports in raw materials are relatively low as they make up less than 3 % of total EU exports. As is the case for imports, metal ores are by far the most traded products.
Energy products
The main goods of energy products (SITC Section 3) are crude oil, refined petroleum products, coal, gas and electric current.
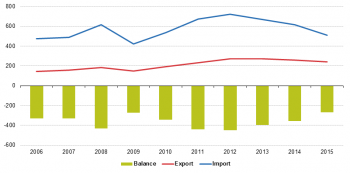
The EU is dependent on imports of energy products. This has led to a structural trade deficit, which reached a record level of EUR 422.9 billion in 2012. The value of imports closely follows the price of crude oil. EU imports remained fairly stable from 2002 to 2004, then rose strongly from 2005 to 2008, and again from 2010 to 2012.
The most imported goods are petroleum and petroleum products, mainly crude oil. Most of the remaining falls to gas and coal. The major energy providers for the EU are Russia and Norway, which made up more than 40 % of the imports in 2013. Algeria, Nigeria and Saudi Arabia also have relevant shares of EU energy imports.
The majority of EU exports are refined petroleum products. The biggest destination country is the USA, which accounts for about one seventh of total exports.
Data sources and availability
EU data come from Eurostat’s COMEXT database. COMEXT is the Eurostat reference database for international trade. It provides access not only to both recent and historical data from the EU Member States but also to statistics of a significant number of third countries. International trade aggregated and detailed statistics disseminated from Eurostat website are compiled from COMEXT data according to a monthly process. Because COMEXT is updated on a daily basis, data published on the website may differ from data stored in COMEXT in case of recent revisions.
EU data are compiled according to community guidelines and may, therefore, differ from national data published by Member States. Statistics on extra-EU trade are calculated as the sum of trade of each of the 28 Member States with countries outside the EU. In other words, the EU is considered as a single trading entity and trade flows are measured into and out of the area, but not within it.
Context
The EU is the world’s foremost trader in agricultural products. Europe imports mostly basic agricultural commodities, but its exports are based on high-quality farm products and other processed agricultural products. Recognising the crucial role that agriculture plays in many developing countries, the EU has granted extensive market access to agricultural imports from developing countries. The European Union, due to the characteristics of the European industrial base, is highly dependent on imports of raw materials for its competitiveness and for its economic development. An increase in worldwide demand in raw materials in the future is expected; this increase will be largely due to economic growth in emerging economies. The European Union is also dependent on imports of energy from other countries. One of the key priorities is therefore to run a strategic international energy policy which leads to stable and secure supply routes.
See also
- Extra-EU trade in goods
- Extra-EU trade in manufactured goods
- Extra-euro area trade in goods
- International trade in goods
Further Eurostat information
Publications
- International trade and foreign direct investment - 2013 edition - Pocketbook
- Statistical analysis of EU trade in energy products, with focus on trade with the Russian Federation - Statistics in focus 13/2014
Main tables
- International trade, see:
- International trade data (t_ext)
- International trade long-term indicators (t_ext_lti)
- International trade short-term indicators (t_ext_sti)
Database
- International trade data (ext)
- International trade long-term indicators (ext_lti)
- International trade short-term indicators (ext_sti)
- International trade detailed data (detail)
Dedicated section
Methodology / Metadata
- International trade in goods (ESMS metadata file — ext_go_esms)
Other information
- Quality report on international trade statistics - Edition 2010
- Statistics on the trading of goods – user guide
