Archive:The EU in the world - health
- Data extracted in March 2016. Most recent data: Further Eurostat information, Main tables and Database. Planned article update: May 2017.
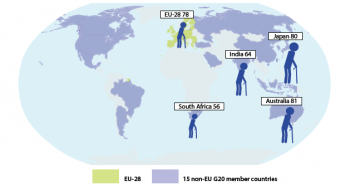
Source: Eurostat (for more information see figure 2 below)
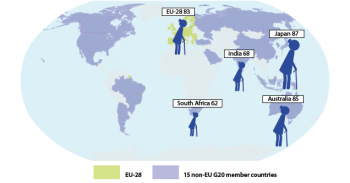
The infographic shows EU‑28 as well as the two G20 members with the highest values and the two with the lowest values. Note that the size of the symbols does not show a precise representation of the underlying data values, but illustrates the highest and lowest values.
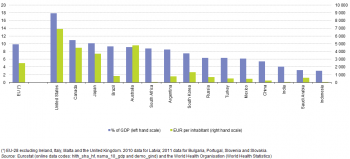
Source: Eurostat (hlth_sha_hf), (nama_10_gdp) and (demo_gind) and the World Health Organisation (World Health Statistics)
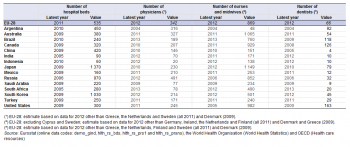
(per 100 000 inhabitants)
Source: Eurostat (demo_gind), (hlth_rs_bds), (hlth_rs_prs1) and (hlth_rs_prsns), the World Health Organisation (World Health Statistics) and OECD (Health care resources)
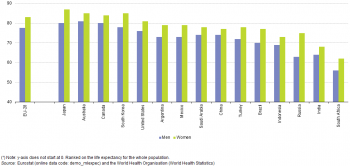
(years)
Source: Eurostat (demo_mlexpec) and the World Health Organisation (World Health Statistics)
This article is part of a set of statistical articles based on Eurostat’s publication The EU in the world 2016.
The article focuses on public health issues such as healthcare expenditure, provision and resources, as well as the health status of populations and causes of death in the European Union (EU) and in the 15 non-EU members of the Group of Twenty (G20). It gives an insight into health in the EU in comparison with the major economies in the rest of the world, such as its counterparts in the so-called Triad — Japan and the United States — and the BRICS composed of Brazil, Russia, India, China and South Africa.
Main statistical findings
Expenditure on health
Lowest health expenditure per inhabitant in India and Indonesia
Healthcare systems are organised and financed in different ways. Monetary and non-monetary statistics may be used to evaluate how a healthcare system aims to meet basic needs for healthcare, through measuring financial, human and technical resources within the healthcare sector.
Public expenditure on healthcare is often funded through government financing (general taxation) or social security funds. Private expenditure on healthcare mainly comes from direct household payments (also known as out-of-pocket expenditure) and private health insurance.
The United States had by far the highest expenditure on health relative to GDP, 17.1 % in 2013. Six other G20 members committed more than 8.0 % of their GDP to health in 2013: Canada, Japan, the EU (incomplete 2012 data, see Figure 1 for details), Brazil, Australia and South Africa. These were followed by a group of six other countries in the range of 5.0 % to 8.0 %. The remaining G20 members spending 4 % or less of GDP were India (4.0 %), Saudi Arabia (3.2 %) and the lowest relative expenditure was recorded for Indonesia (3.1 %).
Figure 1 also shows the absolute level of health expenditure per inhabitant shown in purchasing power parities (PPPs), used as an adjustment to reflect price level differences by converting data in national currencies to a common currency unit using rather than market exchange rates. This shows relatively high levels of expenditure per inhabitant in the United States and to a lower degree in Canada, Australia, Japan and the EU, whereas China, Indonesia and India recorded by far the lowest levels of health expenditure per inhabitant among the G20 members.
Healthcare resources
Hospital beds per 100 000 inhabitants in Japan and South Korea were over double than those in the EU-28
The need for hospital beds may be influenced by the relative importance of in-patient care on one hand and day care and out-patient care on the other, as well as the use of technical resources. The number of hospital beds per 100 000 inhabitants averaged 526 in the EU-28 in 2013. This ratio for the EU-28 was the fourth highest among G20 members, a long way behind Japan (1 332) and South Korea (1 096); the lowest availability of hospital beds relative to the size of the population was in India, with 50 beds per 100 000 inhabitants (see Table 1).
One of the key indicators for measuring healthcare personnel is the total number of physicians, expressed per 100 000 inhabitants. The highest number of physicians relative to the overall population size among the G20 members was recorded in Russia (490, 2012 data), followed by Argentina (386), just ahead of the estimate for EU-28 (338) and Australia (327, 2011 data). South Africa, India and Indonesia (both 2012 data) recorded less than 100 physicians per 100 000 inhabitants. The variation between the G20 members in the number of nurses and midwives was relatively high in comparison with the other personnel indicators in Table 1, with more than 1 000 nurses and midwives in Japan (2010 data) and Australia (2011 data), 694 (estimated) in the EU-28, and under 200 in India and China (both 2011 data), Indonesia (2012 data) as well as Argentina (2004 figures).
All G20 members presented a number of dentists per 100 000 inhabitants below 200 and only three of them (United States 2000 data, Canada 2008 data and Brazil 2010 data) recorded a ratio above 100. China (2005 data) recorded an average of 4 dentists per 100 000 inhabitants. The estimated average for the EU-28 was 67 dentists per 100 000 inhabitants.
Immunisation is the process whereby a person is made immune or resistant to an infectious disease, typically by the administration of a vaccine. Vaccines stimulate the body’s own immune system to protect the person against subsequent infection or disease [1]. Figure 2 presents the coverage of measles vaccination among children aged 0–1 in 2014, which was above 90 % among all G20 members in the case of the first dose, with the exception of Indonesia (87 %) and India (83 %, 2013 data). The second dose was above 80 % in the G20 countries, again with the exception of India and Indonesia where it was below 50 % (taking into account the missing data for the United States).
Mortality
The gender gap in life expectancy at birth was far higher in Russia than in other G20 members
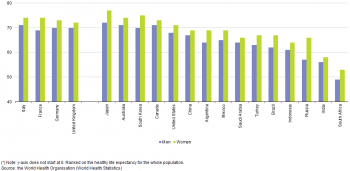
Among the G20 members, the highest life expectancy at birth in 2013 was in Japan both for women (87 years) and men (80 years) (see Figure 3). In Australia and Canada life expectancy also reached 80 years for men. In Australia, South Korea, Canada, the EU-28, the United States and Argentina the women could expect to live 80 years or more. In two G20 members, life expectancy at birth remained in 2013 below 70 years for both women and men, ranging from 68 years (women) and 65 years (men) in India and, to 64 years (women) and 57 years (men) in South Africa. The relatively low life expectancy for South Africa may be largely attributed to the impact of an HIV/AIDS epidemic. In all G20 members life expectancy was higher for women than for men: the gap ranged from three years in China and India to twelve years in Russia while in the EU-28 it was six years.
Non-medical health determinants
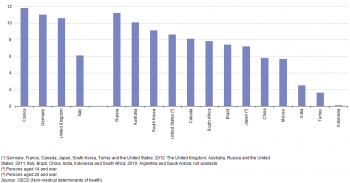
Figures 4 to 7 provide information on three non-medical health determinants, namely alcohol consumption, smoking and obesity. Russia, Australia and EU-28 estimates recorded the highest annual alcohol consumption among G20 members in 2012 (2013 for the EU), at 9.8 litres or more of alcohol per inhabitant (see Figure 4). The lowest average levels of alcohol consumption were recorded for India, Turkey, and Indonesia, and may be influenced to some degree by the predominant religious beliefs in these countries.
Alcoholic beverages have different volume percentages of alcohol, depending on the amount of pure ethanol contained in a given quantity of the drink. Given the specific weight of alcohol of 0.793 g/cm3 (at 20 °C), per capita consumption in litres of pure ethanol per year can be converted into grams per day. As shown in Figure 5, in all G20 countries, the average daily intake in grams of alcohol was higher for men than for women, although it varied from 1.3 times larger in Saudi Arabia, to 2.2 times in the EU-28, to 3.6 times in South Korea and 4.6 times in Indonesia. Saudi Arabia presented the lowest average daily intake of alcohol per inhabitant for men (8.6 grams) and Indonesia had the lowest intake for women (4.5 grams), while the highest values were in South Africa for women (34.6 grams) and South Korea for men (77.7 grams).
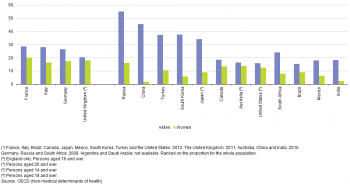
The estimates for Indonesia indicate that the country has by far the highest proportion of daily smokers — more than one third (37.9 %) of the population aged 15 and over — with an incidence mainly in the male population (71.8 %, compared to women at 4.0 %). More than a quarter of the population in the EU-28 (28.1 % estimated for 2012) are daily smokers, while in Russia, South Korea and China, the estimates are close to a quarter of the population.
The incidence of daily smoking among the populations of the other G20 members was below 20 %. In all G20 members shown in Figure 6 the proportion of men who were daily smokers was greater than the proportion of women. The widest gender gap was by far the 68 percentage points (pp) recorded in Indonesia followed by China, Russia and South Korea, all with at least 30 pp more among men than women. The narrowest gender differences were recorded for Canada, the United States and Australia.
Lowest proportions of obesity in Japan and South Korea
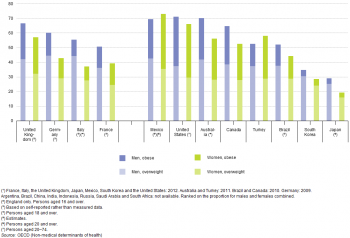
The most frequently used measure for assessing whether someone is overweight or obese is based on the body mass index (BMI), which evaluates weight in relation to height. According to the World Health Organization, adults with a BMI between 25 and 30 are overweight and those with an index over 30 are obese.
The data presented in Figure 7 mainly concern measured results, although for some members only self-reported data are available. Among this selection of G20 members, the highest proportions of the population that were either obese or overweight were observed in Mexico for women (73.0 %) and the United States for men (71.2 %). The highest shares within the EU-28 (no EU-28 aggregate available) were in the United Kingdom for both women and men (57.1 % and 67.1 % respectively). Germany recorded the same share for men (67.1 %). By far the lowest proportions were observed for Japan for both women and men (20.3 % and 28.6 % respectively), taking into account that overweight data was not available for South Africa, India, Indonesia and China. The proportion of men who were overweight was greater than the equivalent proportion of women in all G20 members shown in Figure 7. But in the case of obesity, the proportion of obese women was higher in nine out of the 13 countries with available data.
Among the G20 members for which data are available there was far greater variability in the proportion of the population who were obese than among the population who were overweight. Japan (3.4 % for women and 4.1 % for men) and South Korea (4.2 % for women and 5.1 % for men) recorded particularly low proportions of the population that were obese, while Mexico reported the highest proportions for women (37.5 %) and the United States for men (33.9 %). In Turkey and Mexico there were large gender differences in the proportion of the population that were obese, with the proportions for women particularly high: 14 pp more for Turkish women and 11 pp more for Mexican women when compared to the male population. The widest gender differences in the opposite sense (more obese men) were recorded in Italy, which presented 9 % of obese women and 12 % of obese men.
Data sources and availability
The statistical data in this article were extracted during March 2016.
The indicators are often compiled according to international — sometimes global — standards. Although most data are based on international concepts and definitions there may be certain discrepancies in the methods used to compile the data.
EU data
Most if not all of the indicators presented for the EU have been drawn from Eurobase, Eurostat’s online database. Eurobase is updated regularly, so there may be differences between data appearing in this article and data that is subsequently downloaded. In exceptional cases some indicators for the EU have been extracted from international sources.
G20 members from the rest of the world
For the 15 non-EU G20 members, the data presented have been extracted from a range of international sources, namely the OECD and the World Health Organization. For some of the indicators shown a range of international statistical sources are available, each with their own policies and practices concerning data management (for example, concerning data validation, correction of errors, estimation of missing data, and frequency of updating). In general, attempts have been made to use only one source for each indicator in order to provide a comparable analysis between the members.
Context
Health issues cut across a range of topics — including the provision of healthcare and protection from illness and accidents, such as consumer protection (food safety issues), workplace safety, environmental or social policies. The health statistics presented in this publication address public health issues such as healthcare expenditure, provision and resources as well as the health status of populations.
In many developed countries life expectancy at birth has risen rapidly during the last century due to a number of factors, including reductions in infant mortality, rising living standards, improved lifestyles and better education, as well as advances in healthcare and medicine. Life expectancy at birth is one of the most commonly used indicators for analysing mortality and reflects the mean (additional) number of years that a person of a certain age can expect to live, if subjected throughout the rest of their life to the current mortality conditions.
See also
Further Eurostat information
Publications
- The EU in the world 2015
- The European Union and the African Union — 2014 edition
- Asia-Europe Meeting (ASEM) — A statistical portrait — 2014 edition
- Key figures on the enlargement countries — 2014 edition
- Pocketbook on Euro-Mediterranean statistics — 2013 edition
- The European Union and the BRIC countries
- The European Union and the Republic of Korea — 2012
- Health statistics – Atlas on mortality in the European Union, 2009
Database
- Health care (hlth_care), see:
- Health care expenditure (hlth_sha)
- Health care expenditure — summary tables (hlth_sha_sum)
- Health care expenditure by financing agent (hlth_sha_hf)
- Health care expenditure — summary tables (hlth_sha_sum)
- Health care resources (hlth_res)
- Health care staff (hlth_staff)
- Nursing and caring professionals (hlth_rs_prsns)
- Health personnel (excluding nursing and caring professionals) (hlth_rs_prs1)
- Health care facilities (hlth_facil)
- Hospital beds by type of care (hlth_rs_bds)
- Health care staff (hlth_staff)
- Population, see:
- Population change — Demographic balance and crude rates at national level (demo_gind)
- Mortality (demo_mor), see:
- Life expectancy by age and sex (demo_mlexpec)
- Main GDP aggregates (nama_10_ma)
- GDP and main components (output, expenditure and income) (nama_10_gdp)
Dedicated section
Source data for tables and figures (MS Excel)
External links
- OECD
- World Health Organization (WHO)
Notes
- ↑ In 'WHO: Health topic, Immunization' — http://www.who.int/topics/immunization/en/
