Archive:Manufacture of coke and refined petroleum products statistics - NACE Rev. 2
- Data from April 2012. Most recent data: Further Eurostat information, Main tables and Database.
This article presents an overview of statistics for the coke and refined petroleum products manufacturing sector in the European Union (EU), as covered by NACE Rev. 2 Division 19.


(% share of sectoral total) - Source: Eurostat (sbs_na_ind_r2)


Main statistical findings
Structural profile
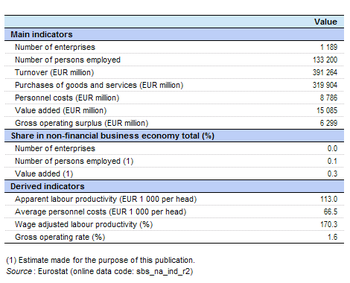
There were approximately 1 200 enterprises in the EU-27’s coke and refined petroleum products manufacturing sector (Division 19) in 2009. These enterprises generated EUR 15 085 million of value added and employed 133 thousand persons. As such the coke and refined petroleum products manufacturing sector contributed 0.1 % of the non-financial business economy (Sections B to J and L to N and Division 95) workforce and 0.3 % of its value added; alternatively, this sector represented 0.4 % of manufacturing (Section C) employment and 1.1 % of manufacturing value added.
The fact that this sector’s shares of manufacturing and non-financial business economy value added were higher than the corresponding shares based on employment indicate that the coke and refined petroleum products manufacturing sector had an above average apparent labour productivity. In 2009, value added per person employed averaged EUR 113 thousand for the EU-27's coke and refined petroleum products manufacturing sector, about 2.5 times the manufacturing average (EUR 46 thousand) and even further above the non-financial business economy average (EUR 41.6 thousand). This level of apparent labour productivity ranked third highest among the manufacturing NACE divisions, behind tobacco manufacturing (Division 12) and pharmaceuticals manufacturing (Division 21).
Equally, average personnel costs within the EU-27’s coke and refined petroleum products manufacturing sector were high, at EUR 66.5 thousand per employee in 2009. This was the highest level among all of the non-financial business economy NACE divisions in 2009; for comparison the manufacturing average was EUR 34.5 thousand per employee and the non-financial business economy average was EUR 30.0 thousand per employee.
The result of these high levels of apparent labour productivity and average personnel costs was a wage-adjusted labour productivity ratio for the EU-27’s coke and refined petroleum products manufacturing sector of 170.3 %, the third highest among the manufacturing NACE divisions in 2009.
In contrast, the gross operating rate for the EU-27’s coke and refined petroleum products manufacturing sector was just 1.6 % in 2009, the second lowest among the manufacturing NACE divisions, and the fourth lowest among all non-financial business economy divisions. This rate shows the relation between the gross operating surplus and turnover, and was brought down by this sector’s very high turnover: coke and refined petroleum products manufacturing accounted for 1.8 % of turnover in the EU-27’s non-financial business economy, a far higher share than recorded for value added or employment.
Sectoral analysis
The coke and refined petroleum products manufacturing sector comprises two subsectors: the manufacture of coke oven products (Group 19.1) and the manufacture of refined petroleum products (Group 19.2). Within the EU-27 the coking subsector is by far the smallest, for example, contributing 7.4 % of sectoral employment in 2009, 2.6 % of sectoral value added and 0.7 % of sectoral turnover.
Because of its dominance, the EU-27’s petroleum refining subsector recorded expenditure, productivity and profitability ratios that were similar to those for the sector as a whole: with high apparent labour productivity (EUR 119 thousand per person employed), average personnel costs (EUR 70.2 thousand per employee) and wage-adjusted labour productivity (169.8 %) and a very low gross operating rate (1.6 %). Among the EU-27’s manufacturing NACE groups the petroleum refining subsector recorded the fourth highest apparent labour productivity ratio in 2009, the highest level of average personnel costs (third highest within the non-financial business economy), and the lowest gross operating rate (fifth lowest within the non-financial business economy).
An analysis of the coking subsector shows a very different profile – although it is important to bear in mind that this is a relatively small subsector within the EU-27 and that at least 14 Member States did not have any enterprises in this subsector in 2009. Furthermore, the EU-27’s activity in the coking subsector is heavily concentrated in Poland, which accounted for more than two thirds of the EU-27’s value added and more than half of the workforce. Apparent labour productivity for the EU-27’s coking subsector was EUR 40 thousand per person employed in 2009, slightly below the non-financial business economy average and further below the manufacturing average (EUR 46 thousand). Average personnel costs were particularly low, EUR 21.1 thousand per employee for the coking subsector, around three fifths of the manufacturing average (EUR 34.5 thousand). One characteristic common between the petroleum refining and coking subsectors was a relatively high wage-adjusted labour productivity ratio: for coking this reached 191.0 % in 2009, well above the manufacturing and non-financial business economy averages (132.1 % and 138.8 % respectively). The EU-27 coking subsector recorded a gross operating rate that was typical for a manufacturing activity, as the gross operating surplus for the coking subsector was equivalent to 6.8 % of turnover, just 0.2 percentage points below the manufacturing average.
Country analysis
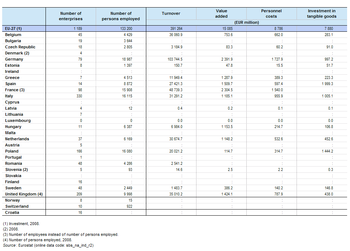
The coke and refined petroleum products manufacturing sector was less concentrated in the largest Member States than is typically the case for manufacturing activities. Germany had the largest share of EU-27 value added in this sector, 15.9 % in 2009, marginally larger than the 15.3 % share recorded for France. Spain, the United Kingdom, Greece, Italy, Hungary and the Netherlands all recorded shares between 10.0 % and 7.5 % of the EU-27 total. The 7.6 % share of EU-27 value added recorded for Hungary was the highest share for Hungary in any of the non-financial business economy NACE divisions (with data available) in 2009; the same was true of the 8.5 % share recorded for Greece, although it should be noted that for Greece data is only available for divisions within industry and construction and that there is no information available for services divisions.
The relative importance of the coke and refined petroleum products manufacturing sector was particularly high in Hungary where it contributed 2.7 % of non-financial business economy value added, almost 10 times the average share for the EU-27. Estonia (0.7 %), Belgium (0.5 %) and the Netherlands (0.4 %) were also relatively specialised in this sector. As noted above, Poland dominated the coking subsector within the EU-27: it contributed 67.8 % of EU-27 value added in this subsector and 57.8 % of the workforce, while Italy had a 10.0 % share of the EU-27’s value added.
Data sources and availability
The analysis presented in this article is based on the main dataset for structural business statistics (SBS) which are disseminated annually. The series provides information for each Member State as well as a number of non-member countries at a detailed level according to the activity classification NACE. Data are available for a wide range of variables.
Context
This article presents an overview of statistics for the coke and refined petroleum products manufacturing sector in the EU, as covered by NACE Rev. 2 Division 19. This division includes processing services and own-account manufacture of characteristic products through the transformation of crude petroleum and coal into usable products.
Coke oven products include the operation of coke ovens, the production of coke, semi-coke, pitch, pitch coke, coke oven gas, crude coal and lignite tars and the agglomeration of coke.
Refining crude petroleum includes the manufacture of liquid or gaseous fuels or other products from crude petroleum, bituminous minerals or their fractionation products. Petroleum refining involves one or more of the following activities: fractionation; straight distillation of crude oil; and cracking. Included are the production of motor fuel, light, medium and heavy fuel oil, refinery gases, oil-based lubricating oils or greases, road coverings, the blending of biofuels, and the production of a range of other products such as white spirit, paraffin wax and petroleum jelly.
This NACE division is composed of two groups:
- the manufacture of coke oven products (Group 19.1);
- the manufacture of refined petroleum products (Group 19.2).
This division includes the manufacture of gases such as ethane, propane and butane if these are produced as products from petroleum refineries; otherwise, the manufacture of these gases is classified as part of chemical manufacturing (Division 20) which also includes the manufacture of petrochemicals from refined petroleum. Furthermore, the manufacture of fuel gas other than petroleum gases (for example, coal gas, water gas, producer gas, gasworks gas) is classified as part of electricity, gas, steam and air conditioning supply (Section D).
Further Eurostat information
Publications
Main tables
Database
- SBS - industry and construction (sbs_ind_co)
- Annual detailed enterprise statistics - industry and construction (sbs_na_ind)
- Annual detailed enterprise statistics for industry (NACE Rev.2 B-E) (sbs_na_ind_r2)
- Preliminary results on industry and construction, main indicators (NACE Rev.2) (sbs_na_r2preli)
- SMEs - Annual enterprise statistics broken down by size classes - industry and construction (sbs_sc_ind)
- Industry broken down by employment size classes (NACE Rev.2 B-E) (sbs_sc_ind_r2)
- Annual detailed enterprise statistics - industry and construction (sbs_na_ind)
- SBS - regional data - all activities (sbs_r)
- SBS data by NUTS 2 regions and NACE Rev.2, from 2008 onwards (sbs_r_nuts06_r2)
Dedicated section
Source data for tables, figures and maps (MS Excel)
Other information
- Regulation 58/1997 of 20 December 1996 concerning structural business statistics
- Decision 2367/2002/EC of 16 December 2002 on the Community statistical programme 2003 to 2007
- Regulation 295/2008 of 11 March 2008 concerning structural business statistics