Archive:Tourism employment
- Data from September 2008, most recent data: Further Eurostat information, Main tables and Database.
This article looks at the contribution made by the tourism industry to the European labour market in 32 European countries: 27 European Union (EU) Member States and five non-EU countries. It focuses on the employment patterns in the tourist accommodation sector. In Europe, tourism is an important driver of economic, social and cultural development.
Main statistical findings
On average, 1.1 % of people employed in the EU work in the tourist accommodation sector.
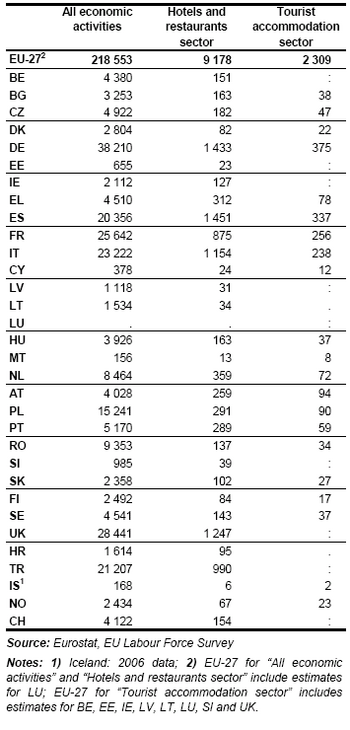
In 2007, more than 9 million people were employed in the EU hotels, restaurants and catering (horeca) sector (see Table 1), which is equivalent to 4.2 % of all people employed. In this sector, the highest number of jobs was observed in Spain (1.45 million) and Germany (1.43 million).
However, when taking into account the size of the labour market, the largest shares employed in the horeca sector were found in Malta (8.3 %), Spain (7.1 %), Greece (6.9 %), Austria (6.4 %) and Cyprus (6.3 %).
About one in every four people employed in the horeca sector works in an enterprise providing tourist accommodation (hotels and similar accommodation, as well as campsites, etc.). This gives a total of 2.3 million employed in 2007. At the height of the tourist season, i.e. in the third quarter of the year, the number of people employed rises by an additional 10 % to an estimated 2.5 million (see below). In relative terms, this means that 1.1 % of all those employed in the EU work in the tourist accommodation sector. The Member States showing the highest share of employment in tourist accommodation were Malta (5.3 %), Cyprus (3.2 %) and Austria (2.3 %)
Not surprisingly, these are also the top three Member States in terms of tourism intensity, i.e. the number of nights in collective tourist accommodation divided by the number of inhabitants.
The following sections take a closer look at employment patterns in the tourist accommodation sector, compared with the entire horeca sector and the labour market as a whole.
Gender
The share of female employment in the tourist accommodation sector is high at 60 %.
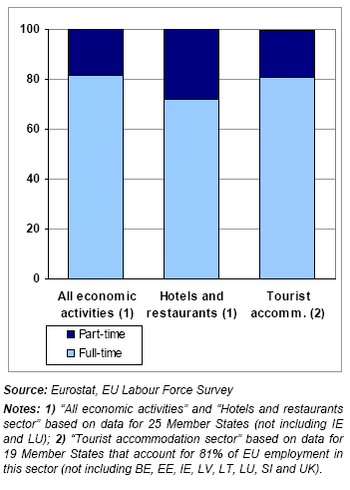
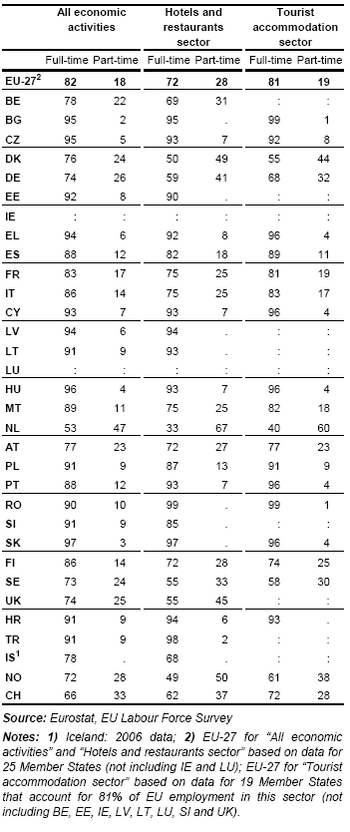
Figure 2 shows that the share of full-time employment in the tourist accommodation sector is not much different from the share across the whole EU economy. In both cases, about four out of every five people are employed on a full-time basis. Looking at the entire hotels and restaurants sector, this is the case for only 72 % of the people employed (or 69 % if the tourist accommodation subsector is excluded). It is only in the Czech Republic that part-time work tends to be slightly more common in tourist accommodation (8 %) than in the entire horeca sector (7 %).
The country data (see Table 2) reveals large variations. The results range from almost no part-time employment in the tourist accommodation sector in Bulgaria or Romania, to a rate of 60 % in the Netherlands. In general, the figures for this sector reflect the split between full-time and part-time employment in the whole economy. Countries with a high share of part-time employment in short-stay accommodation include the Netherlands and Denmark (44 %), Norway (38 %), Germany (32 %) and Sweden (30 %). These countries also have around 25 % or more part-time workers in the labour market, as a whole, compared to the EU average of 18 %.
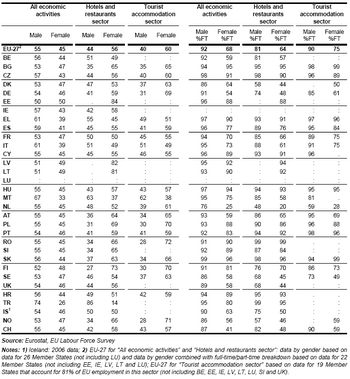
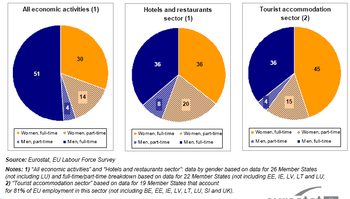
The tourist accommodation sector is a major employer of women (see Table 3 and Figure 1). On average, 60 % of the EU labour force in this sector are female workers who make up only 45 % of the people employed in all EU economic activities. In terms of creating job opportunities for women, the accommodation sector scores even better than the entire hotels and restaurants sector – where female employment stands at 56 %.
As Table 3 shows, the differences across the EU are relatively small, although it is slightly more pronounced than for the economy as a whole, where in nearly every country the share of female employment deviates from the EU average of 45 % by no more than a few percentage points. Among the countries for which data are available, more than two out of every three people employed in the tourist accommodation sector are female in Romania (72 %), Norway (71 %), Poland (70 %), Finland (70 %) and Germany (69 %).
Malta (38 %) and Italy (49 %) are the only countries where women do not take the majority of the jobs in the tourist accommodation sector. But, together with Greece, these two countries also have the lowest female participation rate in their whole economy.
The right-hand side of Table 3 combines the analysis by gender with the split between full-time and part-time employment (see also Figure 1). The proportion of women working full-time is much higher in the accommodation sector (75 %) than in the rest of the economy (68 %) or, more specifically, than in the entire hotels and restaurants sector (64 %). Among men working in this sector, 90 % have a full-time contract, which is slightly less than the overall EU average for men (92 %).
On the one hand, with regard to part-time female employment in the tourist accommodation sector, the only countries where there are significantly more women working part-time than in the economy are the Nordic countries Denmark (50 % versus 36 %), Sweden (51 % versus 42 %) and Finland (27 % versus 19 %)
On the other hand, as regards full-time female employment, in general, countries with a significantly higher proportion of women working full-time than in the economy are Austria (69 % versus 59 %), Portugal (96 % versus 83 %) and Switzerland (59 % versus 41 %).
In the EU, the lowest rate of full-time employment can be observed in the Netherlands, for both male (59 %) and female (28 %) workers, but this Member State also has the lowest overall average rate across the EU for both men and women.
The shaded/patterned sections of the pie charts in Figure 1 show the share of part-time employment. It can be seen that slightly less than 20 % of people employed work on a part-time basis in both the entire tourist accommodation sector and the labour market, as a whole, 19 % and 18 % respectively. In both cases, women account for around 80 % of these part-time jobs. Presenting the results in another way, out of 100 people employed in the EU, only four are part-time working men while 14 are part-time working women. Similarly, in the tourist accommodation sector, for every 100 workers just four men work part-time and 15 women work part-time.
The situation with full-time employment is more pronounced. Women occupy 56 % of full-time jobs in the accommodation sector. Indeed, in this sector in the EU, on average, for every 100 people employed, 81 work full-time, 45 of whom are women and 36 are men. In the economy, on average, women account for only 37 % of full-time employment.
Age
43 % of those employed in the tourist accommodation sector are under 35 years old.
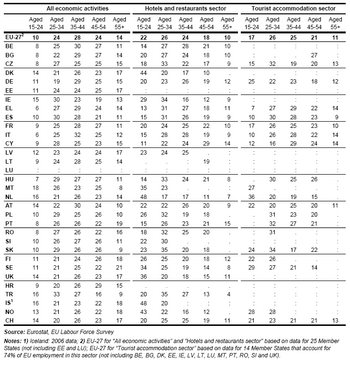
Both the entire hotels and restaurants sector and the tourist accommodation sector offer job opportunities to a young workforce. Indeed, 48 % of people employed in hotels and restaurants, and 43 % in tourist accommodation, are younger than 35 years old. Both sectors have a much younger age profile than the rest of the EU labour market, where only about one in three employees is under 35 (see Figure 3).
This observation regarding the EU also applies to most Member States, where data is available, on the age profile in tourist accommodation (see Table 4). In most of these countries, the share of the two youngest age groups, taken together, is 10 or more percentage points above their average share in employment in the whole economy. Under-35s make up more than half of the employees in the tourist accommodation sector in Slovakia (58 %), the Netherlands (56 %), Sweden (56 %) and Norway (56 %). In all four countries, this share exceeds the average for the whole economy by around 20 percentage points. Cyprus is the only Member State where the age profile of employees in tourist accommodation is older. Here, under-35s take just 28 % of the jobs in tourist accommodation and 33 % in the horeca sectors, whereas their share in the whole Cypriot economy stands at 37 %. Only in Greece and Spain, two countries with a large tourism industry, does the age profile in the accommodation sector appear not to be significantly different from that seen in all economic activities taken together.
At the other end of the age distribution scale, employment opportunities for people aged 55 or more tend to be more limited in tourist accommodation (11 %) than in the overall labour market (14 %). However, it must be emphasized that reliable data are available for only a few countries, partly due to the low probability of including older people in this sector in the survey sample used to collect the data.
Education level
More than one third of tourism accommodation employees have a lower level of education.
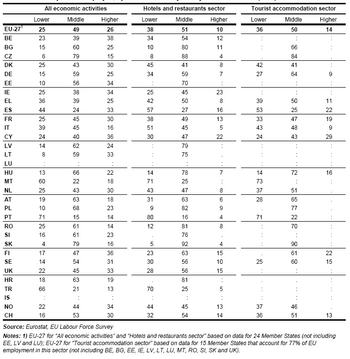
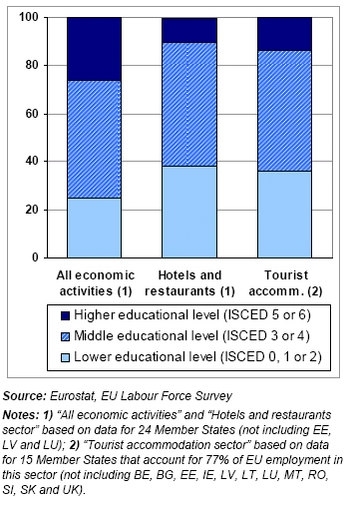
The data in the previous sections has revealed that tourist accommodation in particular employs two socio-demographic groups: young people and females. A third group strongly represented in this sector are people with a lower education level, i.e. people who have completed a lower secondary education at most. Figure 4 and Table 5 show that 36 % of employees in the tourist accommodation sector have not completed their upper secondary education, compared with the general EU labour market average of 25 %.
In all countries where the employment data available can be separated into workers' educational level, the conclusion that the tourist accommodation sector employs relatively more people with a lower level of education holds true. In tourist accommodation, the largest deviations from the average for the economy can be observed in Switzerland, where the share of lower educated people is more than double their share in the labour market as a whole (36 % versus 16 %). Other countries where – when compared with the entire economy – this sector offers jobs especially to less educated people are Germany, Sweden, Norway and Denmark. The only countries where there seems to be no noticeable difference are Portugal (71 %), Cyprus (24 %) and Hungary (14 %).
In the EU, Portugal has the highest share of employees who have a low level of education.
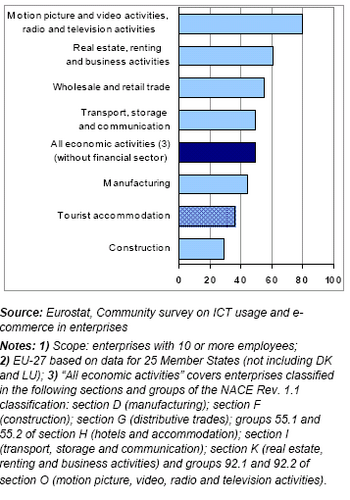
These findings are in agreement with the statistics on information and communication technology use in enterprises (see Figure 5). These indicate that the tourist accommodation sector does not require a high level of e-skills from most staff. Instead, only 36 % of the employees in this sector use computers in their daily work, compared with almost one in every two employees (49 %) when considering all economic activities. Among the sectors covered by the Community survey on ICT usage in enterprises, only one, the construction sector, has a lower penetration rate for ICT in the workplace than the hotel and accommodation sector.
Job status
A high share of temporary jobs and a short average stay with the same employer.
Figure 2 shows that the accommodation sector does not differ significantly from the rest of the economy in terms of the split between full-time and part-time workers. However, considering the job duration and the average stay with the same employer, the sector appears to offer less stable jobs than the rest of the labour market.
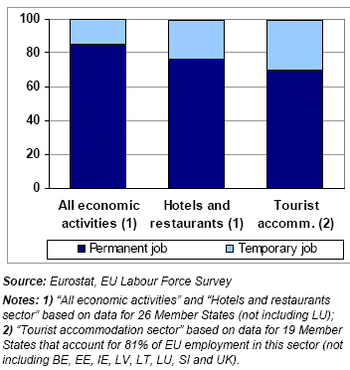
The proportion of those having a temporary job rather than a permanent one (see Figure 6) is more than twice as high in the tourist accommodation sector (where 30 % of the jobs are temporary) than in the whole economy (14 %). In all the countries for which data on job duration is available, the accommodation sector performs relatively poorly (see Table 6). The largest discrepancies between this sector and the whole economy can be observed in Greece (59 % permanent jobs versus 89 % in the whole economy), Italy, Sweden and Bulgaria.
The more limited availability of permanent jobs can be linked to the seasonal nature of tourism. Indeed, these four countries also appear to have the largest variation in number of people employed between the highest and lowest quarters (see Table 9). The discrepancy in terms of share of permanent jobs between the tourist accommodation sector and the whole economy is particularly small – not more than 3 percentage points – in Hungary, Finland, Denmark and Spain. The lowest shares of permanent jobs in the tourist accommodation sector can be found in Poland (58 %), Greece (59 %) and Sweden (61 %). In the case of Poland, however, this is not exceptional as this Member State also has the lowest proportion of permanent jobs in the economy as a whole (72 %).
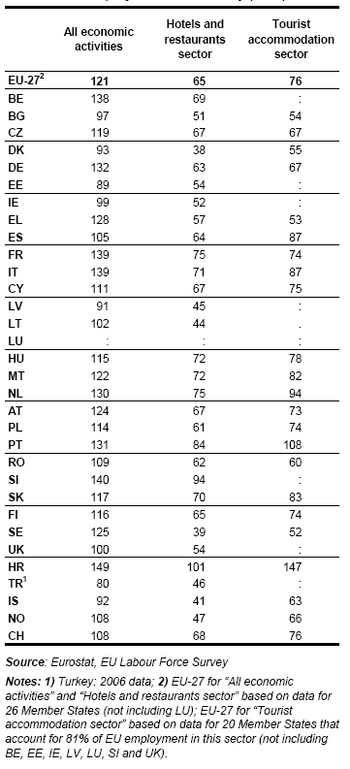
Another indicator of employment stability is the average stay with the same employer. Table 7 shows that staff turnover is much higher in the accommodation sector – with an average stay with the same employer of slightly over six years (76 months) – than in all economic activities taken together (121 months, in other words over 10 years). Comparing the accommodation sector with the rest of the economy at Member State level, the average stay is less than half as long in Greece and Sweden. On the other hand, the discrepancy seems to be smallest in Portugal and Spain.
Seasonal variation
The tourist accommodation sector has a strong seasonal component.
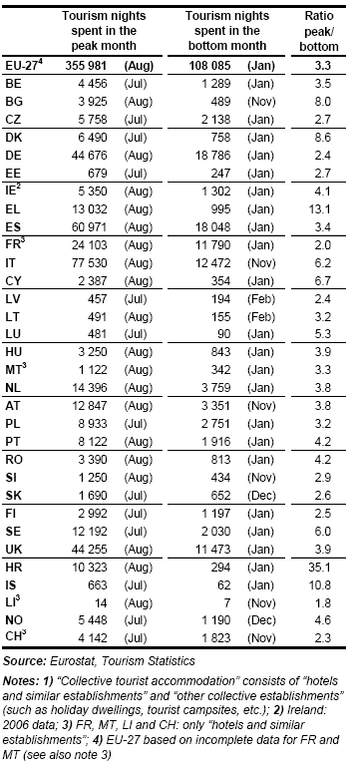
Tourism activity varies strongly throughout the year. In every Member State, occupancy in collective accommodation (expressed as the number of overnight stays by tourists or tourist nights) is at least twice as high in the peak tourism month as in the quietest month (see Table 8). Logically, the countries with a short tourist season also have the highest seasonal variation in tourist nights. In Greece and Croatia, the number of nights spent in collective accommodation is respectively 13 and 35 times higher in August than in the low season in January.
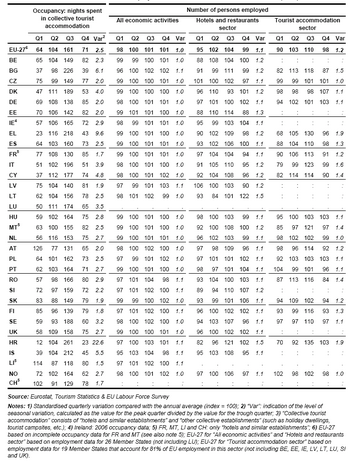
The quarterly data in Table 9 show that the number of tourism nights is 2.5 times higher in the third quarter (the highest one) of the year than in the first quarter (the lowest one). With a ratio of “only” 1.2, employment in this sector tends to be far less affected by seasonal influences (see also Figure 7). On average, the seasonal variation is only half as pronounced in the entire hotels and restaurants sector as in the tourist accommodation subsector. Employment in the latter subsector seems to be less volatile over the year than in the horeca sector in only four countries: the Czech Republic, Denmark, the Netherlands and Norway.
In the whole economy, seasonal fluctuation is relatively limited – but this robust aggregate can, of course, hide strong seasonal variations in certain economic sectors. Within the tourist accommodation sector, the highest seasonal fluctuations in employment are observed in Greece and Croatia (see Table 9). In both these countries, the level of employment in the highest quarter of the year is nearly double the level in the lowest quarter, and 30 % to 35 % higher than the annual average. At the other end of the spectrum, there is no significant seasonal variation in employment in Denmark, the Netherlands and Norway.
However, in these three countries, the number of nights spent by tourists is two to three times higher in the peak season than in the low season.
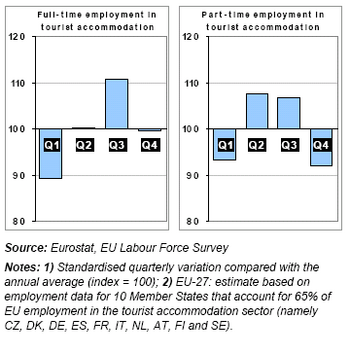
Based on data for ten Member States (accounting for 65 % of employment in the EU tourist accommodation sector), Figure 8 shows the seasonal variation in employment separately for full-time and part-time jobs. The two types of employment contract tend to have a different seasonal pattern. While both are relatively low in the first quarter, part-time employment seems to be the main contributor to the seasonal needs in the second quarter. In the third quarter, full-time jobs appear to fill the additional needs of the tourist accommodation labour market (although it is not clear from the data whether these are additional full-time posts or an increase in weekly working hours to bring existing part-time posts up to the full-time level).
By region
Regions with high tourist activity tend to have lower unemployment rates.
Tourist activity can have a negative impact on the quality of life of the local population in popular tourist areas. However, the influx of tourists can also catalyze the local economy, including the labour market.
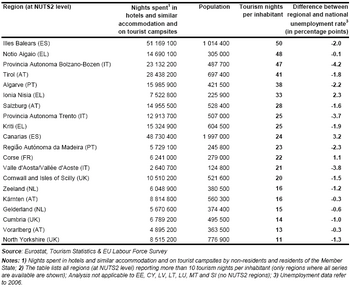
Table 10 lists the top regions (at NUTS 2 level) in the EU in terms of number of nights spent by tourists per capita (or for each member) of the local population, and examines the unemployment rates in these regions. In order to take into account structural differences across the EU, the regional unemployment rate is compared with the national unemployment rate.
Of course, tourist activity will not be the only factor affecting unemployment figures. Table 10 shows that in all but three of the 20 most popular tourist regions, the unemployment rate lies below the national average. Two of the three regions where this does not hold true, the Canary Islands and Corsica, are island regions relatively remote from the mainland.
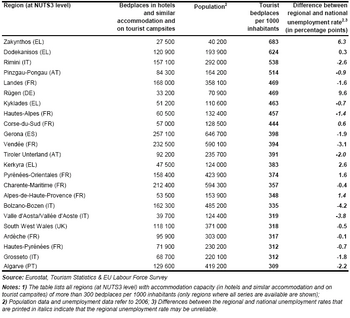
The Community statistics on tourism provide no data on occupancy of collective accommodation below the NUTS2 regional analysis. However, at a more detailed regional level, the number of bed places in tourist accommodation compared to the local population figures can be used as a substitute for the intensity of tourist activity in the region, which assumes that, eventually, the available accommodation will be filled to capacity with tourists. Table 11 shows that in most of these tourist areas the unemployment rate is lower than the national rate. Two of the most significant exceptions to this finding are the Greek islands, Zakynthos (Zante) and Kerkyra (Corfu), both part of the Ionian Islands (see also Table 10). As shown above, Greece tends to have a highly seasonal tourism industry. This seasonal component possibly distorts the comparison as the unemployment figures are an annual average. In Rügen, Germany’s number one region in terms of tourism intensity, the unemployment rate is nearly 10 percentage points higher than the German average. In this specific case, the comparison is affected by the fact that Rügen is in Mecklenburg-Vorpommern, the State with the highest unemployment rate.
Total employment
EU tourism industry occupies about 13 million people.
The analysis in this paper has focused mainly on the tourist accommodation sector, not on the entire tourism industry. In general, the data separation into economic activities, which is used in official statistics, does not single out the whole tourism sector. In particular, apart from a few core tourist activities, such as tourist accommodation or the activities of tour operators and travel agencies, most tourist activities can be placed under broad economic sectors. For instance, restaurants can cater for both tourists and locals, and transport companies can provide services to tourists but equally can run freight or commuter operations.
To overcome this measurement problem, together with international organizations active in the field of tourism statistics (the UNWTO, UNSD and OECD), the EU has been fostering development of a framework that will allow accurate measurement of the tourism industry and comparison with other economic sectors. Taking the concepts, definitions and aggregates of the system of national accounts as a starting point, this statistical instrument called “tourism satellite accounts” should enable valid comparisons with other industries and also between countries or groups of countries. Parts of these TSA cover employment in the tourism industry. Unlike the analysis in this paper, the TSA figures are not limited to the tourist accommodation sector, but also include the tourism-related activities of other sectors, such as the food and beverage serving industry, passenger transport or culture, sports and recreation.
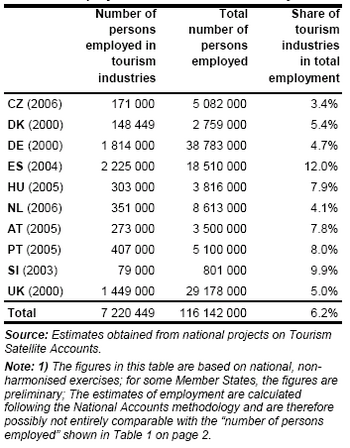
Currently, national, non-harmonised data are available for a handful of Member States. For 10 Member States, these estimates are shown in Table 12. The contribution made by the tourism industry to total employment ranges from 3.4 % in the Czech Republic to nearly 10 % in Slovenia. In Spain, the tourism industry accounts for almost one in every eight jobs (12.0 %) in their economy.
Based on the aggregate data for these 10 Member States, the tourist industry's share of total employment appears to be around 6.2 %. According to Table 1, employment in the accommodation sector accounts for around 1.1 % of the labour market, or approximately 2.3 million jobs. From the TSA estimates, total employment in the tourist industry can be estimated at five to six times higher, with somewhere between 12 and 14 million people employed in the EU. Once again, it must be stressed that these preliminary figures are based on non-harmonized national data from only 10 Member States.
Data sources and availability
Data symbols
- “:”: no data available;
- “.”: unreliable figures that cannot be published;
Classifications
- The economic activities are classified in accordance with NACE Rev.1.1, the statistical classification of economic activities. “Hotels and restaurants” correspond to division 55 of NACE Rev.1.1, whereas the “Tourist accommodation sector” covers only two classes of this division, namely 55.1 (hotels) and 55.2 (other short-stay accommodation).
Data sources
The data used in this article were generally collected by the national statistical institutes of the EU Member States, under Council Directive 95/57/EC of 23 November 1995 on the collection of statistical information in the field of tourism, and under Council Regulation (EC) No 577/98 of 9 March 1998 on the organization of a labour force sample survey in the Community. However, the employment data in the tourist accommodation sector were provided to Eurostat on a voluntary basis, outside of the legal framework.
Context
The tourist accommodation sector accounts for more than 25 % of employment in the hotels, restaurants and catering (horeca) sector, and for slightly over 1 % of the entire EU labour market.
- With a relatively high share of female workers (60 %) and those with low formal education qualifications (36 %), tourist accommodation is a job source for certain at-risk groups on the European labour market. Nevertheless, the jobs tend to be less stable.
- The tourism industry is strongly affected by seasonal influences, leading to – on average across the EU – 10 % more employment in the summer season than at other times.
- Regions attracting large numbers of tourists very often have an unemployment rate below the national average.
Main definitions
Employed people means people aged 15 and over who, during the reference week, performed work, even for just one hour per week, for pay, profit or family gain. And it includes people who were not at work but had a job or business from which they were temporarily absent because of, for example, illness, holidays, industrial dispute and education or training.
Tourism means the activities of people travelling to, and staying in places outside their usual environment for not more than one consecutive year for leisure, business and other purposes.
Technical remarks
- Labour force survey data for Luxembourg are not used because the Luxembourg labour market is too strongly affected by commuters from Belgium, Germany and France.
- Annual estimates for employment data are calculated by taking the arithmetic average of the four quarters (except for Switzerland, where the second quarter is used as the annual estimate).
- Due to rounding, the percentages in the tables do not always add up to exactly 100 %.
Further Eurostat information
Publications
- The tourist accommodation sector employs 2.3 million in the European Union - Statistics in focus 90/2008
- Employment of women in the tourist accommodation sector - Statistics in focus 18/2007 (available in English, French and German)
- Other publications on Tourism statistics
Database
- Tourism (tour), see:
- Employment in the tourism sector (Source: Labour Force Survey 'LFS') (tour_lfs)
- Employed persons by full-time / part-time activity (tour_lfs1)
- Employed persons by age groups (tour_lfs2)
- Employed persons by level of education attained (tour_lfs3)
- Permanency of job (permanent or temporary) (tour_lfs4)
- Average seniority of work with the same employer (tour_lfs5)
- Employed persons and employees by sex and full-time/part-time activity (tour_lfs6)
Dedicated section
External links
- Council Directive 95/57/EC on the collection of statistical information in the field of tourism
- Council Directive 2006/110/EC adapting Directives 95/57/EC and 2001/109/EC in the field of statistics, by reason of the accession of Bulgaria and Romania
