Archive:Government expenditure by sub-sector of general government
- Data from February 2012. . Most recent data: Further Eurostat information, Main tables and Database.
In the European Union (EU) as well as in the EFTA countries Iceland, Norway and Switzerland, the compilation of government revenue and expenditure data is well established by reference to the European system of national and regional accounts (ESA95). This article focuses on the relative importance of the sub-sectors of general government, i.e. central government, state government, local government and social security funds, in total expenditure of general government. Total expenditure is examined at sub-sector level both at the aggregate level and by looking at predominant transactions in each sub-sector and at how the weight of sub-sectors develops over time.

Main statistical findings

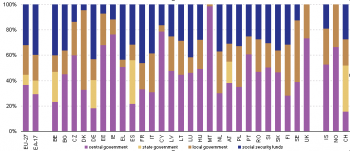
In 2010 EU-27 total expenditure at general government level made up 50.6 % of GDP. Central government accounted for 38.5 % of general government total expenditure or 18.8 % of GDP, when transfers to other subsectors of general government are consolidated (see Data sources and availability). State government made up 5.7 % of total expenditure or 4.0 % of GDP, local government accounted for 24.3 % of total expenditure and 11.9 % of GDP, with social security funds making up the remainder – 31.5 % of total expenditure or 16.0 % of GDP (Figure 1 and Table 1).
Share of subsectors in total expenditure varies among countries
Figure 1 shows that the importance of subsectors varies across countries. In the EU-27, central government is the most important subsector in terms of its expenditure. In five countries, expenditure and revenue for a state or regional level is distinguished – this concerns the three regions in Belgium, the Bundesländer in Germany and Austria, the comunidades autónomas in Spain and the Kantone in Switzerland.
In three countries – Malta, the United Kingdom and Norway – the subsector social security funds is not separated from central government data.
In Ireland, Greece, Cyprus and Malta local government accounted for less than 10 % of general government expenditure in 2010, with central government accounting for by far the largest part of expenditure in three of the four countries.
In Greece – as in Germany and France – the social security funds subsector has a share of more than 40 % of total general government expenditure in 2010. For all three countries, the share of the social security funds shows no particular increase due to the economic crisis. A high share of local government is observed in Denmark (63 % of total expenditure in 2010), Sweden (48 %), Finland (40 %), Norway and Poland (both 33 %), and Italy (31 %).
For the countries that do report state government data, the importance of this subsector tends to be relatively high. In 2010 the share in total expenditure ranged between 17 % in Austria and 37 % in Switzerland. Conversely the smallest shares of central government can also be found among these federally structured countries. Central government accounted for 14 % of general government expenditure in Switzerland, 20 % in Germany and Spain and 23 % in Belgium.
Social transfers make up the largest transaction in government expenditure

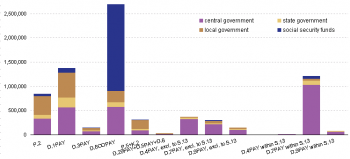
Figure 2 immediately makes visible the importance of social transfers (social benefits and social transfers in kind, D.6COPAY) in general government expenditure and the predominant role of social security funds in ensuring this distributive role of government. Indeed, the majority of social security funds expenditure is classified into this transaction, with the only other notable expenditure in this subsector being 'intermediate consumption' (P.2) and compensation of employees (D.1PAY) – both could be characterised as 'operating costs'. Nevertheless, another large share of social transfers is distributed by central government.
The largest share of 'operating costs' – 'intermediate consumption' and 'compensation of employees' is incurred by central and local government – these are also the two most important transactions for state government. A large part of 'compensation of employees' when classified by function (COFOG) is attributed to the divisions 'education' and 'health' – together accounting for around half of this transaction's expenditure. For state government, the division 'education' on its own makes up around half of the total cost of employees, reflecting the state or regional responsibility for education in all of the concerned countries.
'Gross capital formation and acquisitions less disposals of non-financial non-produced assets' (P.5_K.2), which essentially covers physical investments, are mainly undertaken at the level of local government (57 %), with central government also being important (32 %).
From Figure 2 it can also be seen that transfers within general government mainly come from central government and add a sizable amount to central governments' total expenditure, not taken into account in this publication.
Increased relative importance of social security funds' expenditure due to the crisis

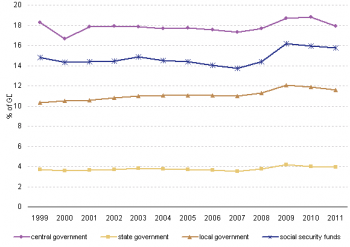
When looking at the recent evolution of the relative importance of the subsectors of general government, it becomes apparent that while expenditure in terms of GDP has moderately increased in all subsectors, the increase from 2008 to 2009 is most striking in social security funds and slightly less visible in central government. In contrast to this, state and local governments show a relatively modest increase of expenditure in terms of GDP. From 2009 to 2010 total expenditure remained fairly stable in terms of GDP for all subsectors. At state government level, even absolute expenditure remained almost stable – a slight increase of 0.3 % is recorded. The overall increase of total expenditure in terms of GDP from 2008 to 2010 is mainly due to the large falls in nominal GDP, rather than a larger than usual absolute increase in expenditure.
However, the increase in social security funds expenditure is largely due to an absolute increase in social transfers in the crisis – these are known to act as automatic stabilisers in a recession.
The visible dip in central government expenditure in percentage of GDP from 1999 to 2000 is accompanied by a decrease in absolute expenditure, reflecting efforts to consolidate budgets during the start of the third stage of the EMU. The only other absolute decrease in expenditure is observed for central government from 2008 to 2009.
Data sources and availability
This section gives some background information on the data sources used in the preparation of this publication as well as on the methodological concepts and technical terms and codes used.
Reporting of data to Eurostat
Annual government finance statistics data are collected by Eurostat on the basis of the European system of national and regional accounts (ESA95) transmission programme, in table 0200 'Main aggregates of general government', table 0900 'Detailed tax receipts by sector' and table 1100 'General government expenditure by function'. As all government finance data are compiled within the ESA95 framework, they follow all methodological guidelines set out in ESA95 and the common rules adopted for national accounts. The legal requirement for transmission of table 0200 data is at t+3 and at t+9 months after the end of the reference period. In this article data mainly corresponds to the end-September 2011 transmission of table 0200, with some countries having updated their data since 21st of October (DK, EE, IE, LV, MT, FI, SE, UK, NO - see country codes).
Definition of general government and its subsectors
The data relate to the general government sector of the economy, as defined in ESA95, paragraph 2.68: 'All institutional units which are other non-market producers (institutional units whose sales do not cover more than the 50 % of the production costs, see ESA95 paragraph 3.26) whose output is intended for individual and collective consumption, and mainly financed by compulsory payments made by units belonging to other sectors, and/or all institutional units principally engaged in the redistribution of national income and wealth. General government comprises the subsectors central government (S.1311), state government (S.1312 - where applicable), local government (S.1313), and social security funds (S.1314). State government data is reported for BE, DE, ES, AT and CH. Data for social security funds is not reported for MT, UK and NO, for the latter two S.1314 data is included in S.1311.
Definition of general government expenditure
Government expenditure is defined in Commission Regulation 1500/2000 and uses as reference a list of ESA95 categories: Government expenditure comprises the following categories:
- P.2, 'intermediate consumption': the purchase of goods and services by government;
- P.5, 'gross capital formation' consisting of:
- gross fixed capital formation (P.51);
- changes in inventories (P.52);
- acquisitions less disposals of valuables (P.53);
- where P.51, 'gross fixed capital formation': consists of acquisitions, less disposals, of fixed assets during a given period plus certain additions to the value of non-produced assets realised by the productive activity of producer or institutional units (fixed assets are tangible or intangible assets produced as outputs from processes of production that are themselves used repeatedly, or continuously, in processes of production for more than one year);
- D.1, 'compensation of employees': the wages of government employees plus non-wage costs such as social contributions;
- D.29, 'other taxes on production, payable',
- D.3, 'subsidies, payable',
- D.4, 'property income, payable', consisting of :
- 'interest, payable (D.41) and
- 'other property income, payable (D.42+D.43+D.44+D.45),
- where D.41, 'interest': excludes settlements under swaps and forward rate arrangements, as these are treated as financial transactions in the ESA 95;
- D.5, 'current taxes on income, wealth, etc, payable';
- D.62, social payments: cover social benefits and pensions paid in cash;
- D.6311, D.63121, D.63131, 'Social transfers in kind related to expenditure on products supplied to households via market producers';
- D.7, 'other current transfers, payable';
- D.8, 'adjustment for the change in net equity of households in pension fund reserves' ;
- D.9, 'capital transfers payable' ;
- K.2, 'acquisitions less disposals of non-financial non-produced assets': public investment spending
- Non-financial non-produced assets consist of land and other tangible non-produced assets that may be used in the production of goods and services, and intangible non-produced assets.
Consolidation
General government data reported in ESA tables 0200 and 1100 must be consolidated, meaning that specific transactions between institutional units within the general government sector – D.4 (property income), D.7 (other current transfers) and D.9 (capital transfers) – are eliminated. Subsector data should be consolidated within each subsector but not between subsectors. Thus data at sector level should equal the sum of sub-sector data, except for items D.4, D.7, and D.9, which are consolidated. For these latter items and consequently total revenue and total expenditure, the sum of subsectors should be equal or exceed the value of the sector. For the purpose of calculating the share of each subsector in general government total expenditure in this publication but not for data published on Eurobase, flows in transactions D.4, D.7 and D.9 to other subsectors of general government (flows with-in the sector S.13) are not considered in the expenditure of each subsector. Thus any expenditure shown in these transactions refer to transfers not within the general government sector of the economy. The advantage of this approach is that total expenditure of general government is equal to total expenditure of the sum of subsectors of general government. Any other intra-government flows are not consolidated in accordance with ESA95, but these are negligible amounts. They refer to the transactions D.29PAY, D.5PAY, and D.39REC.
Time of recording
In the ESA95 system, recording is on an accrual basis, that is, when ‘economic value is created, transformed or extinguished, or when claims and obligations arise, are transformed or are cancelled.'
Gross domestic product
Throughout this article nominal GDP, i.e. GDP at current prices, is used.
Abbreviations
- pp: percentage points
More data and information
More data can be found in Eurostat's online database under the theme economy and finance. Users might also like to refer to the integrated GFS data publications, which present GFS data in a user-friendly fashion are published shortly after transmissions of annual and quarterly data. For country-specific notes, including on missing data, please refer to the metadata published on Eurobase. In case of questions the authors can be contacted at ESTAT-ESA95-GOV@ec.europa.eu.
Context
In the European Union (EU-27) as well as Iceland, Norway and Switzerland, the compilation of government revenue and expenditure data is well established by reference to the European System of Accounts (ESA95). This article focuses on the relative importance of the subsectors of general government, i.e. central government, state government, local government and social security funds, in total expenditure of general government. Total expenditure is examined at subsector level both at aggregate level as well as looking at the predominant nature of transactions in each subsector and the development of the weight of the subsectors over time.
Further Eurostat information
Publications
- General government expenditure trends 2005-2010: EU countries compared - Statistics in Focus 42/2011
- Government expenditure by sub-sector of general government
- Government finance statistics – summary tables
- Taxation trends in the European Union – data for the EU Member States, Iceland and Norway
- Taxation trends in the European Union – Focus on the crisis: the main impacts on EU tax systems
- Tax revenue in the European Union issue 2/2012Statistics in Focus 2/2012
- The effect of the economic and financial crisis on government revenue and expenditure issue - Statistics in focus 45/2011
Main tables
- Annual government finance statistics (t_gov_a)
- Government deficit and debt (t_gov_dd)
- Other government indicators (t_gov_oth)
Database
- Annual government finance statistics (gov_a)
- Government deficit and debt (gov_dd)
- Quarterly government finance statistics (gov_q)
- Other government indicators (gov_oth)
Dedicated section
Methodology / Metadata
- General government expenditure by function (COFOG) (ESMS metadata file - gov_a_exp_esms)
- Government deficit and debt (ESMS metadata file - gov_dd_esms)
- Government revenue, expenditure and main aggregates (ESMS metadata file - gov_a_main_esms)
- Quarterly financial accounts for general government (ESMS metadata file - gov_q_ggfa_esms)
- Quarterly government debt (ESMS metadata file - gov_q_ggdebt_esms)
- Quarterly non-financial accounts for general government (ESMS metadata file - gov_q_ggnfa_esms)
- Structure of government debt (ESMS metadata file - gov_dd_sgd_esms)
Source data for tables and figures (MS Excel)
Other information
- Manual on compilation of taxes and social payments on a quarterly basis – first edition
- Manual on government deficit and debt - implementation of ESA95
- Manual on quarterly non-financial accounts for general government - 2011 edition
- Manual on sources and methods for the compilation of COFOG statistics - Classifications of the Functions of Government - 2011 edition
- Manual on sources and methods for the compilation of ESA95 financial accounts - 2nd edition - 2011 update
External links
- European Central Bank - Government finance - ECB Fiscal Dashboard
- European Commission - Excessive deficit procedure
- European Commission - Stability and Growth Pact