Archive:Biodiversity statistics
Data from December 2021
Planned article update: December 2022
Highlights
Populations of EU common bird species are estimated to have declined by 10 % between 2000 and 2020.
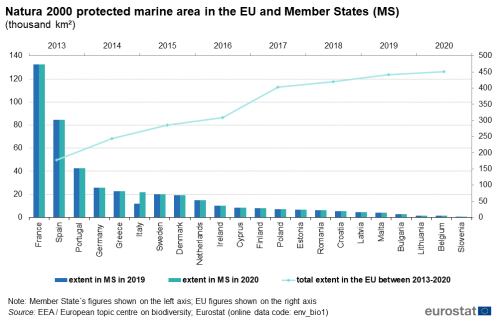
Between 2019 and 2020, Italy designated almost 10 000 km² of its marine waters as new Natura 2000 sites, representing an increase in the extent of its marine protected areas of 80 %.
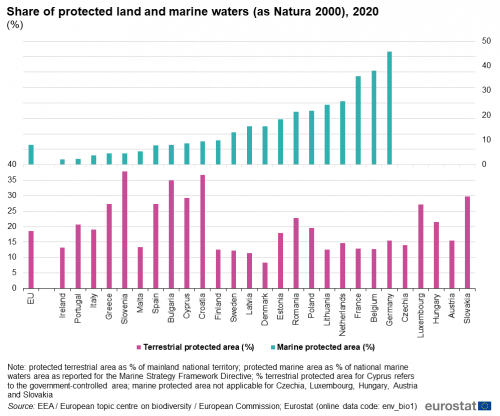
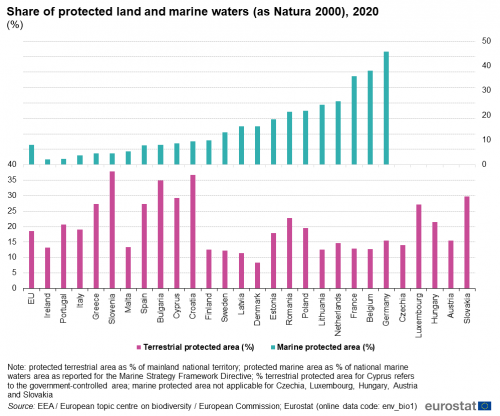
In 2020, Germany protected the largest share of its marine waters as Natura 2000 (46 %), followed by Belgium (38 %) and France (36 %).
(thousand km²)
Source: EEA / European topic centre on biodiversity / European Commission; Eurostat (env_bio1)
Biodiversity encompasses the number, variety and variability of plants, animals and other organisms, including humans. We depend on the natural richness of our planet for the food, energy, raw materials, clean air and water that make life possible and underpin our economies; therefore, it is essential to prevent a loss of biodiversity — any loss may not only undermine the natural environment, but also our economic and social goals. At the end of 2019, the European Commission adopted The European Green Deal, an ambitious vision for a sustainable, green transition that is just and socially fair. Biodiversity is one of its key policy areas. In May 2020, the European Commission adopted the EU Biodiversity Strategy for 2030 to halt the decline in biodiversity and bring nature back into our lives. This article examines two indicators for biodiversity in the European Union — information on protected areas (for terrestrial and marine biodiversity) and bird populations.
Full article
Natura 2000 - the cornerstone of biodiversity protection in the EU
The EU has the largest coordinated network of protected areas in the world; it is known as Natura 2000 and consists of around 27 000 sites. The Natura 2000 network stems from the legal basis provided by the 'Habitats Directive' and the 'Birds Directive' (the two known as 'the Nature Directives'). Areas to be protected under these two directives are proposed by the EU Member States. Natura 2000 areas do not necessarily overlap with protected areas designated under national legislation of Member States - its objective is to ensure the preservation of most valuable and threatened species and habitats of the EU. Economic activities are allowed under Natura 2000 as long as they do not affect the conservation status of species or habitats in a negative way.
Protected terrestrial areas
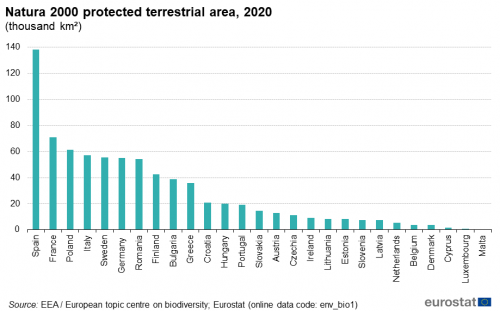
Nearly 764 000 km2 of the EU‘s terrestrial area were protected or proposed for protection as Natura 2000 sites as of 2019, i.e. 18 % of the total land area of the EU. The largest network of terrestrial Natura 2000 areas in absolute terms is located in Spain - in 2020 it covered 138 083 km2. This is almost twice the size of the next largest national Natura 2000 network - in France (71 030 km2) - and it is larger than the country area of any of the 19 smallest EU Member States. Figure 1 shows the total extent of the national terrestrial Natura 2000 network for all Member States for 2020.
The process of designating terrestrial Natura 2000 areas is well advanced; therefore, the total extent of the national network of terrestrial Natura 2000 in most Member States in recent years remained unchanged.
(thousand km²)
Source: EEA / European topic centre on biodiversity; Eurostat (env_bio1)
Some Member States protect a large proportion of their land as Natura 2000 sites as shown in Figure 2. The highest shares of terrestrial protected area (as Natura 2000) are in Slovenia (38 %), Croatia (37 %), Bulgaria (35 %), Slovakia (30 %), Cyprus (29 %), and Spain, Luxembourg and Greece (27 % each). At the other end of the spectrum are Denmark (8 %), Latvia and Sweden (both 12 %), and six other Member States that have designated 13 % of their land territory as Natura 2000 sites. It is important to note that, in general, biodiversity in Europe decreases from south to north (or from the Equator to the Pole) which partly explains the geographical pattern we observe.
(%)
Source: EEA / European topic centre on biodiversity / European Commission; Eurostat (env_bio1)
Protected marine areas
More than 450 000 km2 of the EU‘s marine waters were protected as marine Natura 2000 areas in 2020. This represents 8 % of EU marine waters. Germany protected the largest share of its marine waters as Natura 2000 (46 %), followed by Belgium (38 %) and France (36 %). The smallest shares of protected marine waters were observed for Ireland (2 %), Portugal (2 %) and Italy (4 %), followed by Greece and Slovenia (5 % each) (Figure 2). These shares have been calculated using the area of marine waters reported for the 'Marine Strategy Framework Directive' as total.
The extent of protected marine Natura 2000 areas increased, for the EU as a whole, by 2 % between 2019 and 2020, and by almost 150 % since 2013 (i.e. since the latest Member State joined the EU). The 2019-2020 increase can be largely attributed to the designation of new marine Natura 2000 sites in Italy - almost 10 000 km2, representing an increase of 80 %. In absolute terms, the largest national network of marine Natura 2000 areas is located in coastal waters around France (132 688 km2). Together with the second largest national network - in Spain (84 405 km2) - these account for almost half (48 %) of the total marine Natura 2000 area of the EU. Figure 3 shows the progress of the designation of marine Natura 2000 areas by the overall progress of the EU between 2013 and 2020.
(thousand km²)
Source: EEA / European topic centre on biodiversity; Eurostat (env_bio1)
The condition of protected areas
Eurostat does not collect or republish data about qualitative aspects of protected areas (i.e. their condition or 'conservation status') which may provide a better indication of the state and trends in biodiversity than the size or coverage of protected areas. The European Environment Agency concluded in their report The European environment - state and outlook 2020 that 60 % of species and 77 % of habitats listed in the Habitats Directive showed predominantly unfavourable conservation status.
Populations of common birds
Being relatively easy to monitor, compared with many other groups of organisms, and sensitive to changes in the environment, including pollution and habitat modification, birds have been used as an important indicator of the state of the environment.
Birds in the EU are less abundant than a few decades ago and the overall trend suggests their populations continue to decline. This is particularly true for common farmland birds whose populations are estimated to have decreased by 24 % between 2000 and 2020. The EU's population of all common bird species, comprising the above mentioned farmland birds, the common forest birds and other common bird species, is estimated to have declined by 10 %. Populations of common forest birds show signs of recovery and have increased by 3 %(Figure 4).
Bird monitoring in the EU is conducted under the umbrella of the PanEuropean Common Bird Monitoring Scheme. The scheme helps standardise data collection and analyses across countries and produces three indices for the populations of common birds – index for all common birds (including 168 species), index for common farmland birds (39 species) and index for common forest birds (34 species).
Large losses in populations of common farmland bird species are, in general, thought to be attributed to changes in land use and agricultural practices, and in particular the disappearance of small, non-productive landscape elements, such as hedges and windbreaks, and the use of pesticides.
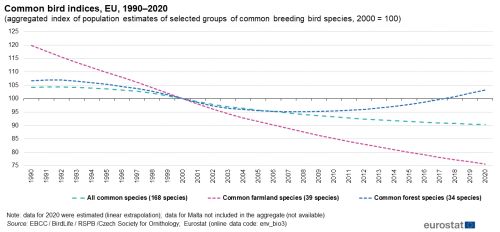
(aggregated index of population estimates of selected groups of common breeding bird species, 2000 = 100)
Source: EBCC / BirdLife / RSPB / Czech Society for Ornithology; Eurostat (env_bio3)
Source data for tables and graphs
Data sources
Habitats
Annual data are available on terrestrial and marine areas protected under the Habitats Directive on the conservation of natural habitats and of wild fauna and flora. The Directive protects over 1 000 animal and plant species and more than 200 types of habitat (for example, special types of forests, meadows or wetlands), which are considered to be of European importance. It has led to the creation of a network of protected special areas of conservation (SACs). Together with the special protection areas (SPAs) defined by the Birds Directive of 2 April 1979, codified by Directive 2009/147/EU of 30 November 2009, these areas make up the Natura 2000 network of protected areas, designed to ensure the long-term survival of Europe's most valuable and threatened species and habitats.
Birds
Across the EU, the conservation of wild birds is covered by the Birds Directive. Birds are considered to be good proxies for measuring the diversity and integrity of ecosystems as they tend to be near the top of the food chain, have large ranges and the ability to move elsewhere when their environment becomes unsuitable; they are therefore responsive to changes in their habitat. Birds are thus a recognized ecological indicator taxon.
The EU indices are based on data from 26 EU Member States (data for Malta are not available), derived from annually operated surveys of national breeding birds collated by the Pan-European Common Bird Monitoring Scheme (PECBMS). This represents the most comprehensive annual biodiversity survey in the EU.
Three different indices are presented:
- Common farmland birds (39 species)
- Common forest birds (34 species)
- All common birds (168 species)
For the first two categories, the bird species have a high dependence on agricultural or on forest habitats in the nesting season and for feeding. Both groups comprise year-round residents and migratory species. The index ‘All common birds’ comprises farmland and forest species together with other common species that are generalists, meaning that they occur in many different habitats or are particularly adapted to life in cities.
Context
In 1998, the EU adopted a biodiversity strategy. Four action plans covering the conservation of natural resources, agriculture, fisheries, and economic and development cooperation were subsequently agreed as part of this strategy in 2001. As a follow-up, in May 2011, the European Commission adopted Communication 'Our life insurance, our natural capital: an EU biodiversity strategy to 2020'), aimed at halting the loss of biodiversity and ecosystem services in the EU by 2020. In 2015, the European Commission reviewed the EU biodiversity strategy to 2020 at mid-term, concluding that that no significant progress towards the 2020 headline target had been made. In May 2020, the European Commission adopted the EU biodiversity strategy for 2030 with its four key actions:
- Establishing a larger EU-wide network of protected areas on land and at sea
- Launching an EU nature restoration plan
- Introducing measures to enable the necessary transformative change
- Introducing measures to tackle the global biodiversity challenge
The EU’s biodiversity strategy is based on the implementation of two landmark Directives, [1] on the conservation of wild birds ('Birds Directive') and [2] on the conservation of natural habitats and of wild fauna and flora ('Habitats Directive').
Direct access to
- Biodiversity (t_env_biodiv)
- Common bird index (EU aggregate) (t2020_rn130)
- Surface of marine sites designated under Natura 2000 (source: DG ENV, EEA) (sdg_14_10)
- Surface of terrestrial sites designated under Natura 2000 (source: DG ENV, EEA) (sdg_15_20)
- Environment (env), see:
- Biodiversity (env_biodiv)
- Natura 2000 protected areas (source: EEA) (env_bio1)
- Common farmland bird index (sources: OECD, BirdLife) (env_bio2)
- Common bird indices by type of estimate (sources: EBCC, BirdLife, RSPB, CSO) (env_bio3)
- Communication 'The European Green Deal'
- Mid-term review of the EU Biodiversity Strategy to 2020
- Summaries of EU legislation: The EU biodiversity strategy: a current review of progress
- Communication 'Our life insurance, our natural capital: an EU biodiversity strategy to 2020'
- [3] on the conservation of wild birds ('Birds Directive')
- [4] on the conservation of natural habitats and of wild fauna and flora ('Habitats Directive')
- Summaries of EU legislation: Protecting Europe’s biodiversity (Natura 2000)