Archive:European Neighbourhood Policy - East - statistics on trade in goods with the EU
Data extracted in April 2021.
Planned article update: March 2022.
Highlights
Azerbaijan was the only ENP-East country to record a trade balance surplus in 2019.
Among the ENP-East countries reporting 2019 data, the EU accounted for 64% of Moldova’s total exports, 22% of Armenia's, 21% of Georgia's and 19% of Belarus’.
Some 1.8% of all goods exported from the EU in 2019 were destined for the six European Neighbourhood Policy-East countries, while 1.9% of EU imports came from these countries.
Share of exports to the EU in total exports from ENP-East countries, 2009-2019
This article is part of an online publication and presents information relating to recent developments for international trade in goods for the six countries that together form the European Neighbourhood Policy-East (ENP-East) region, namely, Armenia, Azerbaijan, Belarus, Georgia, Moldova and Ukraine, in particular concerning their trade relations with the European Union (EU).
Data shown for Georgia exclude the regions of Abkhazia and South Ossetia over which Georgia does not exercise control and the data shown for Moldova exclude areas over which the government of the Republic of Moldova does not exercise control. The latest data for Ukraine generally exclude the illegally annexed Autonomous Republic of Crimea and the City of Sevastopol and the territories which are not under control of the Ukrainian government (see specific footnotes for precise coverage).
The article highlights some of the key indicators for tracing developments in the international trade of the ENP-East region over the period 2009-2019, with information on exports, imports and the trade balance. It is followed by an examination of trade between ENP-East countries and the EU from the perspective of the ENP-East countries, using data reported by the ENP-East countries themselves. The subsequent parts of the analysis mirror this approach and look at trade flows to/from ENP-East countries from the perspective of the EU, using Eurostat data. There are differences in the values of trade reported by ENP-East countries and by EU Member States: more information on this phenomenon is provided in the data sources section. It also presents an analysis of international trade between the regions by selected product groups (based on the standard international trade classification (SITC)).
Full article
Exports, imports and the trade balance
International trade statistics track the value (and quantity) of goods traded between countries. They are the official source of information on imports, exports and the trade balance, the difference between them. The data in Table 1 show the total exports, imports and the trade balance as a percentage of the GDP of the ENP-East countries and the EU. This allows a focus on the change in the importance of trade flows relative to the size of the economies concerned.
Long term global trends have seen trade increasing as a proportion of GDP in most countries. This has been an important element of globalisation, although far from the only one. Countries that are growing fast or are undergoing or recovering from economic difficulties may wish to run trade deficits, in which the value of imports is greater than that of exports. Countries that specialise in providing services to the rest of the world, such as tourism or business services, may also run consistent trade deficits, since services are not included in the statistics of exports and imports of goods. The balance of payments includes data on both trade in goods and in services.
Total trade, the sum of exports and imports (sometimes the average is used), as a percentage of GDP is often used as a measure of a country’s openness to world trade. Smaller countries tend to have higher levels of trade openness than larger ones, since there are fewer opportunities for buying and selling domestically produced goods. The relationship between trade openness and income (measured as GDP per capita) is more complicated, although low income countries generally have low trade openness.
The data in Table 1 show that Armenia’s exports and imports in 2009 were respectively 8 % and 38 % of GDP. By 2019, Armenia’s exports had risen to 19 %, with imports slightly up at 41 %. Hence, the trade deficit diminished from 30 % of GDP in 2009 to 21 % in 2019. The trade deficit had been as low as 14 % of GDP in 2016: imports were near their 2015 lows that year and subsequently grew again. The measure of openness to trade was consequently 60 % of GDP in 2019, an increase of 13 percentage points.
Azerbaijan, with its large export-oriented hydrocarbon sector, is the only ENP-East country to show a trade surplus. This started at 19 % of GDP in 2009, rose to 28 % the following year, then fell to under 7 % in 2015, before rising to 17 % in 2018 and declining to over 12 % in 2019. Exports have driven these trends: the high point during the period occurred in 2018, when exports equalled 41 % of GDP. The low point was in 2015, when exports were 24 % of GDP. Imports ranged from 12 % of GDP in 2014 to 29 % in 2019. Exports plus imports rose considerably by 22 percentage points over the period, leading to trade openness being measured at 69 % of GDP in 2019.
Belarus has been consistently the most open economy of the ENP-East countries, with aggregate trade (i.e. imports plus exports) at 115 % of GDP in 2019. Over the period 2009-2019, its openness increased by 17 percentage points. During 2010-2012, both exports and imports grew. This was followed by a sharp decline in 2013. After a further decline, albeit slower, in 2014, a recovery followed, although not to the levels of 2012. Belarus started the period with a trade deficit equal to 14 % of GDP. This increased to 17 % in 2010 before a rapid reduction in 2011 and 2012: exports grew faster than imports. In 2013, the fall in exports was larger than that of imports, so the trade deficit was re-established, remaining at broadly similar levels since.
Georgia’s exports plus imports in 2019 equalled 75 % of GDP, a major increase of 23 percentage points over the 2009 figure of 52 %. This change was accounted for by an increase in both exports and imports over the period. At the same time, Georgia’s trade balance has been consistent: it was in deficit in 2009 at 31 % of GDP and in 2019 at 32 %; its maximum value was 35 % in both 2012 and 2016 and its minimum 29 % in 2010. Between 2014 and 2016, exports diminished as a proportion of GDP; in other years they grew. Imports grew in every year except 2013 and 2016.
Moldova’s trade openness was also 72 % of GDP in 2019 but was 12 percentage points less than ten years earlier. This was entirely due to a fall in imports as a proportion of GDP, which declined in particular from 2009 to 2010 and from 2014 to 2015. Imports in 2019 were the lowest proportion of the whole period from 2009. Exports have accounted for a consistent share of GDP: the lowest during the period was 22 % in 2010 and the highest 26 % the following year. The trade balance has, as a result, improved from a deficit of 37 % of GDP in 2009 to one of under 26 % in 2019; it has been quite stable since 2015.
Ukraine’s aggregate trade was equal to 72 % of GDP in 2019, an increase of 3 percentage points over 2009, largely due to slightly higher imports as a share of GDP. Imports and, to a lesser extent, exports as shares of GDP increased over the period 2009-2011, then fell back to 2013. A jump in exports in 2014 was followed by a further increase in 2015, before declining in the following years. Imports slowly grew from 2014 to 2017, thereafter falling. The country had a balance of trade deficit of 5 % in 2009, falling to over 8 % in 2012, rising to a small surplus of less than 1 % in 2015 before declining to a low of 8 % in 2018, finishing the period at 7 % in 2019. In summary, there has been little change in Ukraine’s overall international trade position over the period 2009-2019.
The statistics for the EU are shown for extra-EU trade only, treating the EU as a single trading entity. Although its degree of trade openness, at 29 % of its GDP in 2019, is smaller than any of the ENP-East countries, this is due to its much larger economy.
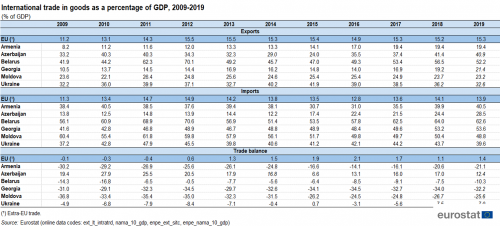
(% of GDP)
Source: Eurostat (ext_lt_intratrd), (nama_10_gdp), (enpe_ext_sitc) and (enpe_nama_10_gdp)
Importance of the EU as a trading partner for the ENP-East countries
Figures 1 and 2 show ENP countries’ data over the period 2009-2019 covering the share of exports to and imports from the EU as a percentage of their total exports and imports. Data is provided for each of the ENP-East countries for which data is available.
For Armenia, the EU’s share of total exports and imports both declined considerably over 2009-2019, although there is not a fall in every year. There is a similar story with Belarus, although the decline of the share of imports from the EU during the period is only 4 percentage points.
In Georgia, the share of exports to the EU fluctuated over the period, but ended close to the same share as it started. The share of imports remained relatively stable, ending the decade more than 4 percentage points lower than at the outset. The EU’s share in Moldova’s imports, at 49 %, was substantially higher than in the other ENP-East countries in 2019; over the decade from 2009, it had grown by almost 7 percentage points. The EU’s share in Moldova’s exports, at 64 % in 2019, was also the highest among the ENP-East countries, by far. Over 2009-2019, the share of the EU in the exports from Moldova had risen by almost 17 percentage points.
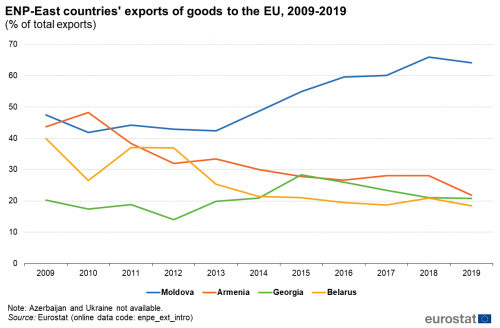
(% of total exports)
Source: Eurostat (enpe_ext_intro)
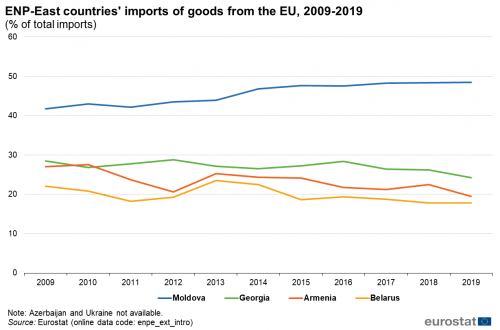
(% of total imports)
Source: Eurostat (enpe_ext_intro)
Combining the data from Figure 1 and Figure 2 with those from Table 1 on the share of total trade in GDP, one can analyse the share of EU trade in GDP. This provides a measure over time of the relative importance to the economy of the ENP-East countries of the inter-regional trade of these countries with the EU.
Armenia’s exports to the EU in 2019 were around 4 % of its GDP, hardly changed from 2009. Its imports in 2019 were 8 % of GDP, a decline of around 3 percentage points. The importance of Belarus’ exports to the EU to its economy declined by around 7 percentage points in the decade to 2019, to 10 %. Its EU imports barely changed, at 11 % of GDP in 2019. Georgia’s exports to the EU accounted for 4 % of GDP in 2019, a marginal increase of 2 percentage points over 2009. At 13 %, the ratio of its EU imports to GDP was almost unchanged from 2009. Moldova’s exports to the EU as a percentage of its GDP was 15 % in 2019, an increase of 4 percentage points over 2009. The corresponding figure for imports was 24 % in 2019, a marginal decline from 2009.
Importance of the ENP-East countries as trading partners for the EU
In contrast to most of this Statistics Explained article, which uses data provided to Eurostat by the ENP-East countries, this section uses statistics compiled by Eurostat from data submitted by EU Member States. See the Data Sources section below for more information.
Looking at trade flows of goods from the perspective of the EU, the six ENP-East countries accounted for a relatively small share of the EU’s trade in 2019, some 1.8 % of all exports leaving the EU and 1.9 % of all imports arriving in the EU from non-member countries.
As shown in Figure 3, the relative importance of the EU’s trade in goods with the ENP-East countries has not changed much over the ten years to 2019, a period in which global trade increased and new trade routes developed. There is no clear trend over this period: in particular, the recovery from the 2008 global financial and economic crisis does not seem to have impacted these observations.
These statistics abstract from the growth in the international trade of both the EU and ENP-East countries.
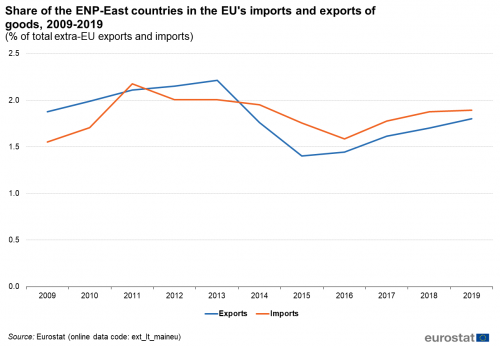
(% of total extra-EU exports and imports)
Source: Eurostat (ext_lt_maineu)
EU Trade flows with individual ENP-East countries
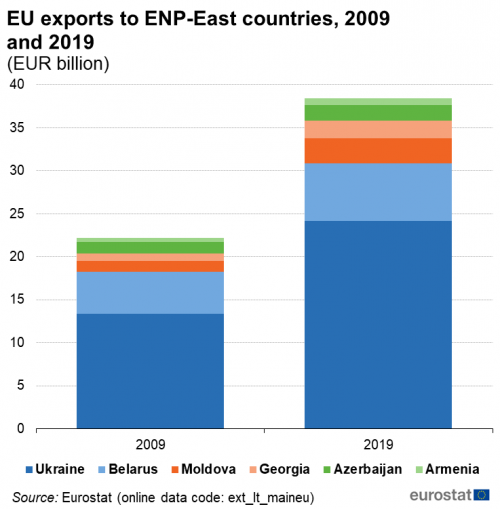
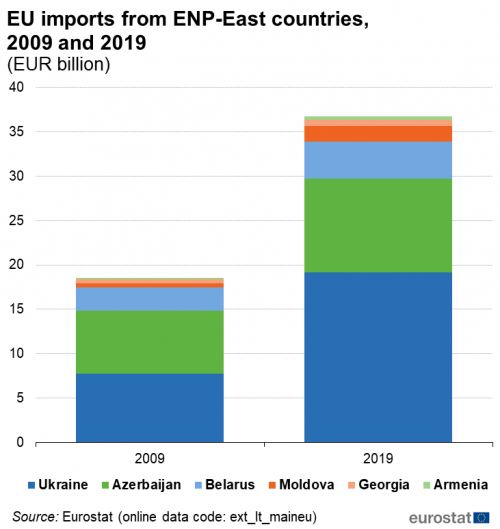
Figures 4 and 5 provide more detailed information as to the destination and origin of trade in goods between the EU and the six ENP-East countries in 2009 and 2019, based on data provided by the EU Member States to Eurostat. The following analyses look at trade valued in euro.
Ukraine accounted for the largest share of goods exported from the EU to the six ENP-East countries in both 2009 and 2019 (see Figure 4). EU exports of goods to Ukraine were valued at EUR 13.3 billion in 2009 and EUR 24.2 billion in 2019. Goods from the EU destined for Belarus were valued at EUR 4.9 billion in 2009 and EUR 6.7 billion in 2019. The third highest amount of EU exports to the ENP-East countries in 2019 was recorded for Moldova, at EUR 2.9 billion, having been EUR 1.2 billion in 2009. EU exports to Georgia increased from EUR 0.9 billion in 2009 to EUR 2.0 billion in 2019. Those to Azerbaijan were EUR 1.3 billion in 2009 and EUR 1.8 billion in 2019. EU exports to Armenia were valued at EUR 0.5 billion in 2009 and EUR 0.8 billion in 2019.
(EUR billion)
Source: Eurostat (ext_lt_maineu)
Looking at imports to the EU from ENP-East countries as shown in Figure 5, Ukraine was again the largest trading partner in 2019, with EU imports valued at EUR 19.1 billion, up from EUR 7.8 billion in 2009. Azerbaijan accounted for EUR 7.1 billion of EU imports in 2009 and EUR 10.6 billion in 2019. Belarus was the EU's third largest ENP-East source of imports in 2019, at EUR 4.2 billion – 2009 imports were EUR 2.6 billion. Goods imported to the EU from Moldova were valued at EUR 0.5 billion in 2009 and EUR 1.8 billion in 2019. Those from Georgia were valued at EUR 0.4 billion in 2009 and EUR 0.7 billion in 2019. EU imports from Armenia were EUR 0.2 billion in 2009 and EUR 0.4 billion in 2019.
(EUR billion)
Source: Eurostat (ext_lt_maineu)
ENP-East trade flows with individual EU Member States
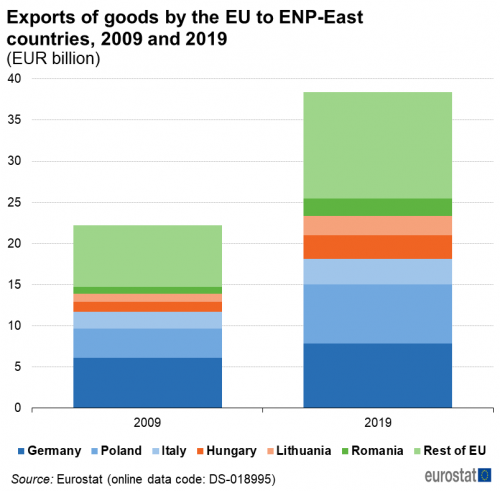
In 2019, as shown in Figure 6, Germany recorded the highest exports of goods to the six ENP-East countries from among the EU Member States, at EUR 7.8 billion; its exports had been EUR 6.2 billion in 2009. Poland had the second highest share of the EU’s goods exported to the ENP-East countries in 2019, at EUR 7.2 billion, having exported EUR 3.5 billion in 2009. Italy exported EUR 2.1 billion worth of goods to the ENP-East countries in 2009 and EUR 3.1 billion in 2019. Hungary exported EUR 1.2 billion in 2009 and EUR 2.9 billion in 2019. Other significant exporters in 2019 were Lithuania at EUR 2.3 billion and Romania at EUR 2.1 billion. Between them, the remaining 21 EU Member States accounted for EUR 12.9 billion worth of goods exports in 2019.
(EUR billion)
Source: Eurostat (DS-18995)
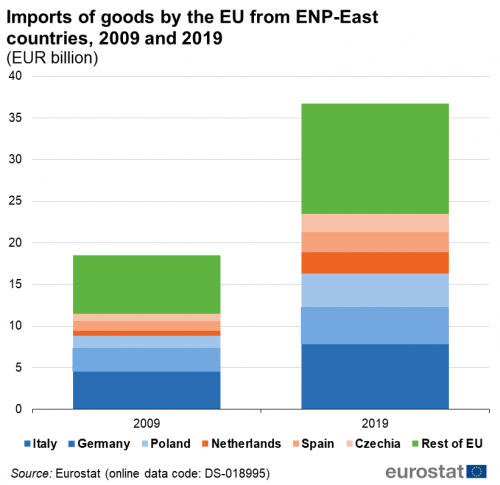
Figure 7 shows that Italy was the most important market among the EU Member States for goods from the ENP-East countries. Italy's imports of goods from the ENP-East countries were valued at EUR 7.9 billion in 2019; its ENP-East imports had been EUR 4.6 billion in 2009. Oil and gas imports from Azerbaijan accounted for much of this. Germany was the second largest importer from the ENP-East in 2019, at EUR 4.4 billion; the 2009 figure was EUR 2.8 billion. Poland was the third largest import market, slightly behind Germany at EUR 4.0 billion in 2019. The growth in its imports from the ENP-East countries over the previous decade was considerable – it had been EUR 1.4 billion in 2009. Other significant EU importers from the ENP-East in 2019 were the Netherlands, EUR 2.6 billion; Spain, EUR 2.4 billion; and Czechia, EUR 2.1 billion. Other EU Member States accounted for EUR 13.3 billion of imports from the ENP-East countries in 2019, up from EUR 7.0 billion in 2009.
(EUR billion)
Source: (DS-18995)
Main products traded between the ENP-East countries and the EU
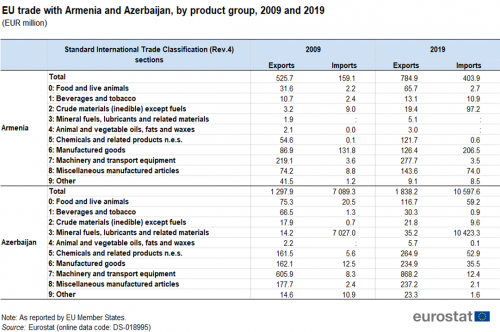
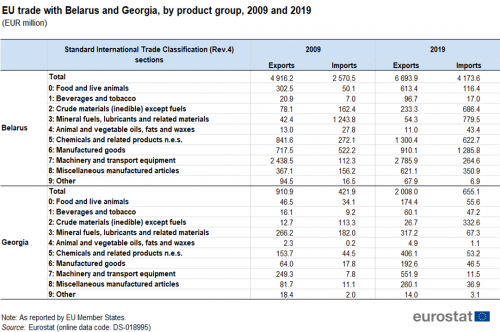
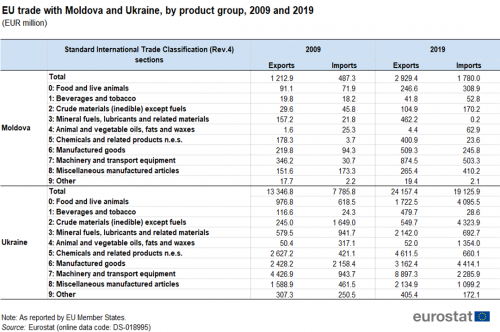
Tables 2a, 2b and 2c provide, for each of the ENP-East countries, a summary of their trade in goods with the EU, as reported by the EU Member States to Eurostat. The 10 main sections shown follow the standard international trade classification (SITC Rev.4).
The EU’s principal exports to Armenia in 2019 were EUR 277.7 million worth of machinery and transport equipment (SITC section 7), from total exports of EUR 784.9 million to Armenia in that year. Looking at the trade flow in the opposite direction, the EU imported manufactured goods (SITC section 6) for EUR 206.5 million from Armenia, out of a total of EUR 403.9 million.
Mineral fuels, lubricants and related materials (SITC section 3), at EUR 10 423.3 million accounted for almost all of the EU’s imports originating from Azerbaijan in 2019; this section includes coal, oil, natural gas and other petroleum products. The total imports from Azerbaijan amounted to EUR 10 597.6 million. EU principal exports to Azerbaijan were some EUR 868.2 million of machinery and transport equipment, from a total of EUR 1 838.2 million.
(EUR million)
Source: Eurostat (DS-18995)
EU principal exports to Belarus were, once again, machinery and transport equipment, valued at EUR 2 785.9 million in 2019, out of a total of EUR 6 693.9 million. The EU’s largest imports category from Belarus in 2019 were EUR 1 285.8 million worth of manufactured goods, out of a total of EUR 4 173.6 million. In 2009, the EU’s largest imported product group had mineral fuels, lubricants and related materials.
EU exported EUR 551.9 million worth of machinery and transport equipment to Georgia in 2019. This was the largest group in a total of EUR 2 008.0 million of exports. In 2009, EU exports of mineral fuels, lubricants and related materials had been the largest product group. EU imports in 2019 of EUR 332.6 million of crude materials (inedible) except fuels (SITC section 2) were by far the largest, out of a total of EUR 655.1 million. In 2009, the largest product group imported by the EU from Georgia was mineral fuels, lubricants and related materials. At the same time, this same product group, mineral fuels, lubricants and related materials, was also the largest exported from the EU to Georgia.
(EUR million)
Source: Eurostat (DS-18995)
The largest EU exports to Moldova in 2019 were EUR 874.5 million of machinery and transport equipment, out of a total of EUR 2 929.4 million. The largest EU imports were in the same product group: EUR 503.3 million out of a total of EUR 1 780.0 million. In 2009, the largest product group imported to the EU had been miscellaneous manufactured articles (SITC section 8).
In Ukraine, by far the largest EU export product in 2019 was machinery and transport equipment, accounting for EUR 8 897.3 million out of a total of EUR 24 157.4 million. Manufactured goods provided slightly the largest value of EU imports in 2019, with EUR 4 414.1 million. Crude materials (inedible) except fuels and food and live animals (SITC section 0) were marginally behind. Total imports to the EU were EUR 19 125.9. In 2009, the largest product group imported to the EU had been manufactured goods.
(EUR million)
Source: Eurostat (DS-18995)
Source data for tables and graphs
Data sources
Traditionally, customs records are the main source of statistical data on international trade. Following the adoption of the Single Market in January 1993, customs formalities between EU Member States were removed, and so a new data collection system, intrastat, was set up for intra-EU trade. In the intrastat system, intra-EU trade data are collected directly from trade operators, which send a monthly declaration to the relevant national statistical administration.
The data for ENP-East countries are supplied by and under the responsibility of the national statistical authorities of each country on a voluntary basis. The data result from an annual data collection cycle that has been established by Eurostat. These statistics are available free-of-charge on Eurostat’s website, together with a range of additional indicators for ENP-East countries covering most socio-economic topics.
Note that although trade flows should ideally mirror each other (in other words be the same from the perspective of the exporter and the importer), there may be considerable differences in the values presented depending upon which party (exporter or importer) is used as the reporting entity. These discrepancies are often referred to as asymmetries and can be seen when bilateral data for two reporting parties are compared. Generally, while international recommendations for reporting trade statistics exist, countries may adopt methodologies that deviate from the recommendations for practical reasons. Consequently, when exports from country A to country B are compared with imports into country B from country A, the figures rarely (if ever) match. More information concerning the causes of asymmetries can be found in the user guide for statistics on the trading of goods.
Tables in this article use the following notation:
| : | not available, confidential or unreliable value; |
| – | not applicable. |
Context
The EU has a common international trade policy, often referred to as the common commercial policy. In other words, the EU acts as a single entity on trade issues, including issues related to the World Trade Organisation (WTO). In these cases, the European Commission negotiates trade agreements and represents the interests of the EU Member States.
The EU seeks to promote the development of free trade as an instrument for stimulating economic growth and enhancing competitiveness. International trade statistics are of prime importance for both public sector (decision makers at international, EU and national levels) and private users (in particular, businesses who wish to analyse export market opportunities) as they provide valuable information on developments regarding the exchange of goods between specific geographical areas. These statistics enable the EU to monitor the development of trade ties with its ENP partners, while they are also used by the European Commission to prepare multilateral and bilateral negotiations for common trade policies.
In March 2020, the European Commission presented a joint policy proposal for Eastern Partnership policy beyond 2020: Reinforcing Resilience - an Eastern Partnership that delivers for all. This is intended to succeed the 2015 review of the European Neighbourhood Policy (SWD(2015) 500 final).
In cooperation with its ENP partners, Eurostat has the responsibility ‘to promote and implement the use of European and internationally recognised standards and methodology for the production of statistics necessary for developing and monitoring policy achievements in all policy areas’. Eurostat undertakes the task of coordinating EU efforts to increase the statistical capacity of the ENP countries. Additional information on the policy context of the ENP is provided here.
Direct access to
Books
Leaflets
- Basic figures on the European Neighbourhood Policy — East countries — 2019 edition
- Basic figures on the European Neighbourhood Policy — East countries — 2018 edition
- Basic figures on the European Neighbourhood Policy — East countries — 2016 edition
- Basic figures on the European Neighbourhood Policy — East countries — 2015 edition
- Basic figures on the European Neighbourhood Policy — East countries — 2014 edition
- International trade for the European Neighbourhood Policy — East countries — 2016 edition
- European Neighbourhood Policy-East countries — Statistics on living conditions — 2015 edition
- European Neighbourhood Policy — East countries — Key economic statistics — 2014 edition
- European Neighbourhood Policy — East countries — Labour market statistics — 2014 edition
- European Neighbourhood Policy — East countries — Youth statistics — 2014 edition
- International trade (enpe_ext)
- European Neighbourhood Policy East Countries Trade in goods by SITC product group (enpe_ext_sitc)
- Trade balance (enpe_ext_bal)
- Share of European Neighbourhood Policy East Countries in European Union 27 trade (enpe_ext_intro)
- International trade in goods - aggregated data (ext_go_agg)
- International trade in goods - long-term indicators (ext_go_lti)
- International trade (ext_go_lti_int)
- International trade of EU, the euro area and the Member States by SITC product group (ext_lt_intertrd)
- EU trade by Member State, partner and product group (ext_go_lti_ext)
- Intra and Extra-EU trade by Member State and by product group (ext_lt_intratrd)
- International trade (ext_go_lti_int)
- International trade in goods - long-term indicators (ext_go_lti)
- Eastern European Neighbourhood Policy countries (ENP-East) (ESMS metadata file — enpe_esms)
- International trade in goods statistics — European Union (ESMS metadata file — ext_go_agg_esms)
- Quality report on European statistics on international trade in goods — 2016-2019 data — 2020 edition
- User guide on European statistics on international trade in goods — 2020 edition