Archive:European Neighbourhood Policy - South - agriculture statistics
Data extracted in June 2021.
Planned article update: March 2022.
Highlights
In 2019, the contribution of agriculture, forestry and fisheries to value added in the European Neighbourhood Policy-South countries varied between 13.8 % in Morocco and 1.2 % in country Israel, compared to 1.8 % in the EU.
Agriculture, forestry and fishing accounted for between 32.4% of the workforce in Morocco and 1.0% in Israel in 2019, compared to 4.1 % in the EU.
Employment in agriculture, forestry and fishing, 2009 and 2019
This article is part of an online publication and provides data on agricultural statistics for eight of the countries that form the European Neighbourhood Policy- South (ENP-South) region — Algeria, Egypt, Israel, Jordan, Lebanon, Morocco, Palestine [1] and Tunisia; no recent data are available for Libya or Syria. The article provides an overview of the key characteristics of agriculture in these countries and in the European Union (EU), providing statistics on the economic contribution of agriculture, forestry and fishing as well as agricultural output, including crop and livestock production.
Full article
Gross value added and employment
Between 2009 and 2019, the share of the agriculture, forestry and fishing sector in total gross value added declined in more than half of the ENP-South countries (see Figure 1): in Palestine (-3.4 pp), Egypt (-1.9 pp between 2009 and 2017), Lebanon (-1.0 pp between 2009 and 2018), Morocco (-0.9 pp) and Israel (-0.8 pp). In contrast, increases were recorded in Algeria (+2.8 percentage points (pp)), Tunisia (+1.7 pp between 2009 and 2015) and Jordan (+1.5 pp between 2009 and 2016). In the EU, it remained relatively stable (-0.1 pp).
The share of output of agriculture, forestry and fishing in the total gross value added was the highest for Morocco in 2019 (13.8 %), followed by Algeria (12.9 %), Egypt (11.7 %; 2017 data) and Tunisia (11.0 %; 2015 data). The rest of the countries had shares below 8 %: Palestine, with 7 %; Jordan, with 5.2 % (2016 data) and Lebanon, with 3.4 % (2018 data). Israel, with 1.3 %, had a share lower than the share in the EU which accounted for 1.8 % in 2019.
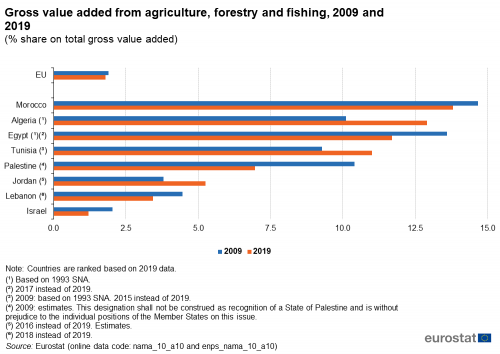
(% share on total gross value added)
Source: Eurostat (nama_10_a10) and (enps_nama_10_a10)
Figure 2 shows a similar analysis of employment for 2009 and 2019. Among the ENP-South countries for which data are available, the employment share of agriculture, forestry and fishing (for those aged 15 and over) in 2019 was the highest in Morocco (32.5 %). The next largest shares were observed in Egypt (21.6 % - 2018 data) and Tunisia (14.1 %). The remaining countries had all shares below 10 %: Algeria (9.6 %), Palestine (6.1 %), Lebanon (3.6 % - 2018 data) and Israel (1.0 %). In comparison, the share in the EU was 4.1 % in 2019.
The share of the total workforce in agriculture, forestry and fishing fell between 2009 and 2019 in the four ENP-South countries for which data are available and in the EU. The contraction in Morocco was the greatest, with this share reduced by 8.0 pp. Falls were also quite substantial in Egypt (-6.6 pp between 2010 and 2018), Palestine (-5.8 pp) and Algeria (-3.5 pp). Within the EU, the share fell by 1.3 pp. More data on the labour markets in the ENP-South countries are available in the Statistics Explained article European Neighbourhood Policy - South - labour market statistics.
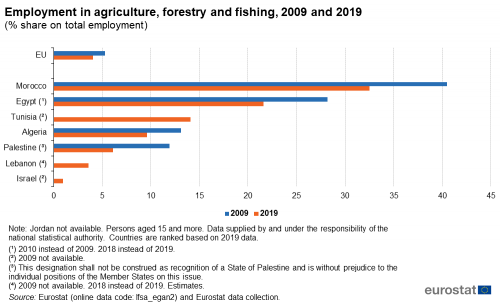
(% share on total employment)
Source: Eurostat (lfsa_egan2) and from annual data collection cycle – see Data Sources
Land use
The area that is used for agriculture varies according to climate, terrain and soil type, while the level of economic development and population density may also play a role in determining land use. Within the EU roughly equal amounts of land (almost two fifths of the total area) are used for agriculture and for forestry, with the remainder generally composed of built-up areas (villages, towns and cities), infrastructure (roads or railways), scrub or waste land.
The utilised agricultural area (UAA) refers to the area that is actually used for agricultural purposes. The UAA was more than half of the total area in Tunisia (although no recent data are available; 56.5 % in 2009 – see Figure 3), while in the four other ENP-South countries for which data are available (no data for Egypt, Lebanon and Palestine) the share was considerably less, reflecting the mountainous terrains and desert landscapes of some ENP-South countries. The utilised agricultural area represented 13.1 % of the total area in Israel and 9.3 % in Morocco, while lower shares were recorded in Algeria (3.6 % - 2018 data) and in Jordan (3.2 % - 2018 data). In comparison, the UUA represented 38.3 % of the total area in 2019.
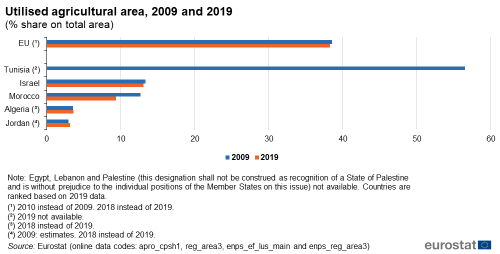
(% share on total area)
Source: Eurostat (apro_cpsh1), (reg_area3), (enps_ef_lus_main) and (enps_reg_area3)
Agricultural production
Several of the ENP-South countries are often characterised as being arid areas of unfertile soil, covered with rock and sand. Nevertheless, there are pockets of more fertile land within each of the ENP-South countries, particularly along river valleys or close to the coast. While the winter months often see relatively high levels of rainfall, some regions receive little or no rainfall during the summer months. The variability in rainfall patterns can play a considerable role in determining the success or failure of each harvest (as reflected in the figures for harvested production).
In 2019, the largest producers of cereals (excluding rice and including seeds) among the ENP-South countries were Egypt, Algeria and Morocco, with 17.6 million tonnes (2018 data), 6.1 million tonnes (2018 data) and 5.3 million tonnes of output respectively. In Israel, Lebanon (2017 data) and Jordan, the volumes were below 200 thousand tonnes in 2019. No 2019 data are available for Palestine and Tunisia, however the levels of cereals production were 54 thousand tonnes in 2009 and 2.3 million tonnes in 2014 respectively. In comparison, 296.4 million tonnes of cereals were produced in the EU.
When looking at potatoes (including seed), the largest producer among the ENP-South countries in 2019 was Egypt with 5.0 million tonnes (2018 data), closely followed by Algeria (4.7 million tonnes – 2018 data). The next country was Morocco with 2.0 million tonnes. In Lebanon (2017 data), Israel and Jordan, the volumes were below 700 thousand tonnes in 2019. No 2019 data are available for Palestine and Tunisia, however the levels of potatoes produced were 69 thousand tonnes in 2009 and 0.4 million tonnes in 2014 respectively. In comparison, 51.2 million tonnes of potatoes were produced in the EU.
The picture for fresh vegetables is quite similar to potatoes. The largest producer among the ENP-South countries in 2019 was again Egypt with 19.8 million tonnes (2018 data), followed by Algeria (13.7 million tonnes – 2018 data), Morocco with 7.3 million tonnes, Jordan with 1.8 million tonnes and Israel with 1.3 million tonnes. No 2019 data are available for Palestine and Tunisia, however the levels of fresh vegetables produced were 697 thousand tonnes in 2009 and 3.3 million tonnes in 2014 respectively. No data is available for Lebanon. In comparison, 61.5 million tonnes of fresh vegetables were produced in the EU.
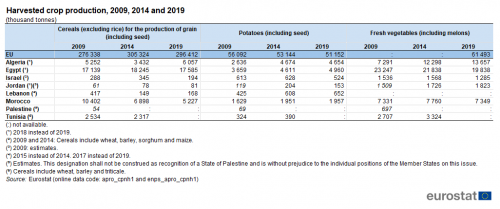
(thousand tonnes)
Source: Eurostat (apro_cpnh1) and (enps_apro_cpnh1)
Livestock: population structure and production
While farming of livestock in the ENP-South countries is shaped by climatic and topographic conditions, cultural and religious traditions also affect the types of animals that are reared. Many subsistence farmers in the ENP-South countries keep a small number of animals on their farm which may be used for eggs, milk, wool/hides, as well as for their meat.
The population of sheep and goats in most of the ENP-South countries was relatively high. This may, at least in part, be linked to the ability of these animals to survive in arid conditions (whereas the ideal conditions for rearing cattle include a plentiful supply of pasture). Pig farming is almost non-existent in ENP-South countries, reflecting the religious practices of their majority Muslim or Jewish populations.
Table 2 provides an analysis of farm animals for the ENP-South countries and the EU in December 2009 and 2019. The total number of cattle across the ENP-South countries for which data are available (2017 data for Algeria and Egypt, 2018 data for Lebanon, April 2017 data for Tunisia and no data for Palestine) equated to just 14.2 % (11 million heads) of the total in the EU (77 million heads). Data availability for the ENP-South countries is similar for sheep and goats: based on the information shown in Table 2 there were around 65 million sheep in the ENP-South countries and above 17 million goats. As such, the number of sheep and goats in 2019 were greater than the totals across the EU where they were 62 million and 12 million respectively.
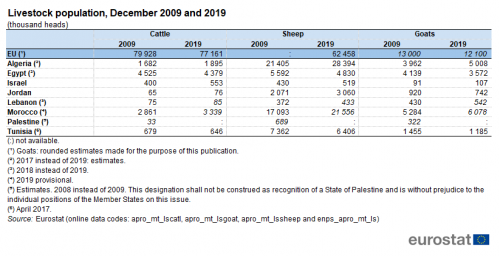
(thousand heads)
Source: Eurostat (apro_mt_lscatl), (apro_mt_lsgoat), (apro_mt_lssheep) and (enps_apro_mt_ls)
The structure of animal output — as measured by the quantity of slaughtered production — differs from the structure of the animal populations in each country, in large part due to the fact that a proportion of cattle, sheep and goats are reared for milk (or wool in some cases) rather than for meat. In all of the ENP-South countries for which data are available (see Table 3), poultry accounted for the highest quantity of slaughtered production in the most recent year for which data are available. Egypt had the highest amount of slaughtered poultry with 1.6 million tonnes (2018 data). The other countries had less than 1 million tonnes. The production from sheep was the highest in Algeria with 3.3 million tonnes (2017 data) far beyond the other ENP-South countries where the volumes did not exceed 200 thousand tonnes. Regarding cattle, Algeria had also the biggest of slaughtered production with 1.7 million tonnes (2017 data), followed by Egypt with 0.8 million tonnes (2018 data). The other countries showed volumes lower than 300 thousand tonnes. In comparison, there were 7.0 million tonnes of slaughtered cattle production in the EU. There is no recent data for sheep, goats and poultry at EU level.
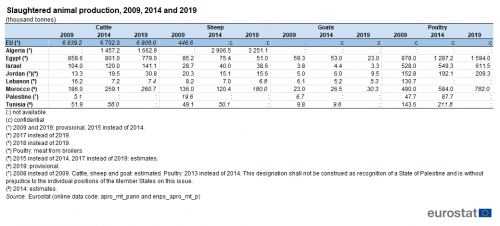
(thousand tonnes)
Source: Eurostat (apro_mt_pann) and (enps_apro_mt_p)
Trade in food and live animals
The value of international trade in food and live animals has grown at a rapid pace over the last decade in nearly all of the ENP-South countries; note this may, in part, be due to increased prices as the values shown in Table 4 are presented in current prices. Fluctuating prices for raw and processed foodstuffs may have a considerable impact on the trade position of a country, while climatic conditions can affect yields and determine if there is a surplus of food for export or if there is a deficit which may lead to higher levels of imports.
Collectively, the exports of food and live animals from ENP-South countries (excluding Lebanon) were valued at EUR 14.8 billion in 2019 (2018 data used for Jordan), equivalent to 11.8 % of the EU total, while the value of imports of these goods into the ENP-South countries was EUR 30.6 billion, equivalent to 28.5 % of the EU total.
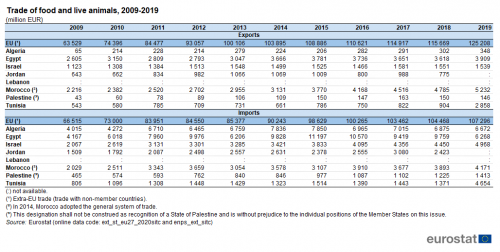
(million EUR)
Source: Eurostat (ext_st_eu28sitc) and (enps_ext_sitc)
The highest values of exports of food and live animals from the ENP-South countries in 2019 were recorded for Morocco (EUR 5.2 billion) and Egypt (EUR 3.9 billion), which were more than double the level of exports from Israel (EUR 1.5 billion) which recorded the third highest value. Tunisia recorded EUR 874 million in 2019; Jordan EUR 874 million in 2018; and Algeria EUR 348 million in 2019. Palestine had the lowest level of exports of food and live animals among the ENP-South countries, EUR 146 million in 2019. In comparison, there were EUR 125.2 billion exported from the EU to the rest of the world.
Exports of food and live animals from Algeria were 5.4 times as high in 2019 as their level in 2009, while exports from Palestine were 3.4 times as high. Exports of food and live animals from Morocco more than doubled over this period (2.4 times as high). There were also substantial growths recorded for Tunisia (up 61.0 %), Egypt (up 50.1 %), Israel (up 37.1 %) and Jordan (up 20.5 % between 2009 and 2018). For comparison, the EU exports to the rest of the world doubled between 2009 and 2019.
The highest values of imports of food and live animals from the ENP-South countries in 2019 were recorded for Algeria (EUR 6.7 billion) and Egypt (EUR 6.3 billion). They were followed by Israel (EUR 5.0 billion), Morocco (EUR 4.2 billion), Jordan (EUR 2.4 billion - 2018 data), Palestine and Tunisia (each EUR 1.4 billion). In comparison, there were EUR 107.3 billion imported in the EU from the rest of the world.
Imports of food and live animals from Palestine trebled between 2009 and 2019, while Israel and Morocco more than doubled (2.4 and 2.1 times as high respectively). There were also growths recorded for Tunisia (up 76.6 %), Algeria (up 66.2 %), Jordan (up 60.6 % between 2009 and 2018) and Egypt (up 50.4 %). For comparison, the EU imports from the rest of the world increased by 61.3 % between 2009 and 2019.
Source data for tables and graphs
Data sources
The data for ENP-South countries are supplied by and under the responsibility of the national statistical authorities of each country on a voluntary basis. The data that are presented in this article result from an annual data collection cycle that has been established by Eurostat. No recent data are available from either Libya or Syria. These statistics are available free-of-charge on Eurostat’s website, together with a range of different indicators covering most socio-economic areas.
The situation for international trade statistics is somewhat different, as more detailed international trade statistics are available from Eurostat’s Comext database. All statistics presented in this article as monetary values in euro terms are based on current price series.
The utilised agricultural area describes the area used for farming. It includes arable land, permanent grassland, permanent crops (such as orchards, olive trees and vineyards) and other agricultural land such as kitchen gardens.
Statistics on crop production relate to harvested production. Cereals include wheat (common wheat and spelt and durum wheat), rye, maslin, barley, oats, mixed grain other than maslin, grain maize, sorghum, triticale, and other cereal crops such as buckwheat, millet, canary seed and rice.
Meat production is based on the activity of slaughterhouses regarding meat fit for human consumption.
The data for the EU presented in this article come from Eurostat‘s online database, including trade data from Comext.
Tables in this article use the following notation:
| Value in italics | data value is forecasted, provisional or estimated and is therefore likely to change; |
| : | not available, confidential or unreliable value; |
| – | not applicable. |
Context
Agriculture was one of the first sectors of the economy (following coal and steel) to receive the attention of EU policymakers, and statistics on agriculture were initially designed to monitor the main objectives of the common agricultural policy (CAP). While the CAP remains one of the EU’s most important policies there have been wide ranging reforms, which have led to a range of new objectives designed to correct imbalances and overproduction.
In December 2013, the latest reform of the CAP was formally adopted by the European Parliament and the Council. The main objectives of the CAP for the period 2014-2020 was to strengthen the competitiveness of the sector, promote sustainable farming and innovation, to support jobs and growth in rural areas and to move financial assistance towards the productive use of land.
In 2018, the European Commission presented legislative proposals for a new, reformed Common Agricultural Policy (CAP) beyond 2020. The reformed CAP should be key to helping the European Union achieving the objectives of the European Green Deal, and 40 % of the funds allocated to the CAP over the next 7-years programming period should be dedicated to actions contributing towards these.
The reformed CAP will help European farmers to contribute more decisively to tackling climate change, protecting the environment and moving to more sustainable and resilient food systems. It will generate economic opportunities for farmers and improve their position in the food supply chain, and better link support for farm income and rural areas to the take-up of sustainable models and practices.
For the years 2021-22, a transitional regulation (Regulation (EU) 2020/2220) is in force, extending and amending provisions set out in the preceding regulations. It will remain in force until the new framework of CAP strategic plans is implemented (due to begin on 1 January 2023).
The European Neighbourhood Policy (ENP), launched in 2004, supports and fosters stability, security and prosperity in the EU’s neighbourhood. The ENP was revised in 2015. The main principles of the revised policy are a tailored approach to partner countries; flexibility; joint ownership; greater involvement of EU member states and shared responsibility. The ENP aims to deepen engagement with civil society and social partners. It offers partner countries greater access to the EU's market and regulatory framework, standards and internal agencies and programmes.
The Joint Communication by the European External Action Service and the European Commission on Renewed Partnership with the Southern Neighbourhood, accompanied by an EU Economic and Investment Plan for our Southern Neighbours, of 9 February 2021 further strengthens cooperation with the ENP-South countries.
The main objective of Euro-Mediterranean cooperation in statistics is to enable the production and dissemination of reliable and comparable data, in line with European and international norms and standards.
Reliable and comparable data are essential for evidence-based decision-making. They are needed to monitor the implementation of the agreements between the EU and the ENP-South countries, the impact of policy interventions and the reaching of the Sustainable Development Goals (SDGs).
The EU has been supporting statistical capacity building in the region for a number of years through bilateral and regional capacity-building. This takes the form of technical assistance to partner countries’ national statistical authorities through targeted assistance programmes and activities such as training courses, working groups and workshops, exchange of best practice and the transfer of statistical know-how. Additional information on the policy context of the ENP is provided here.
Notes
- ↑ This designation shall not be construed as recognition of a State of Palestine and is without prejudice to the individual positions of the Member States on this issue.
Direct access to
Books
Leaflets
- Basic figures on the European Neighbourhood Policy — South countries — 2019 edition
- Basic figures on the European Neighbourhood Policy — South countries — 2018 edition
- Basic figures on the European Neighbourhood Policy — South countries — 2016 edition
- Basic figures on the European Neighbourhood Policy — South countries — 2015 edition
- Agriculture (med_ag)
- Structural information (med_ag1)
- Crop production (med_ag2)
- Meat (Total production) (med_ag31)
- Annual production and utilisation of milk on the farm (med_ag32)
- Livestock in number of heads (med_ag33)
- Economic Accounts for Agriculture (EAA) (med_ag50)