Archive:Labour market slack - unmet need for employment - quarterly statistics
Data extracted in July 2020
Planned article update: October 2020
Highlights
Tweet Text
Tweet Text
Data extracted in June 2020
Planned article update: June 2021
<highlight>
The health crisis due to the Covid-19 has become in the European Union, like in other parts of the world, an economic crisis. It is highly expected and, even, already observed, that the outcomes of the economic storm impact significantly the EU-27 labour market. Concretely, given the lock-down and the impending recession, some people may have lost their job or the opportunity to start a new one. In addition, people who were previously considered unemployed by fulfilling the ILO requirement of looking for work might have given up their search for a certain period of time due to the poor economic prospects or the shut-down of the enterprises' activity moving them outside the labour force. It is therefore assumed that beyond unemployment, more jobless people either inside or outside the labour force may have an unmet need for employment. This whole potential demand for employment (the unemployed and the supplementary categories) constitute the labour market slack.
This article based on quarterly LFS data investigates the impacts of the crisis on unemployed people as well as on other people constituting also . These supplementary categories consist of underemployed people, those part-time workers who wish to work more, and of people who might be associated to the labour force, because of their availability to work or their work search, but who are not recorded as such. The last category is called the potential additional labour force.
Both European and country approach are taken in this article. It aims at showing the effects of the crisis in the European Union (EU) and in the [Glossary:EU_Member_States|Member States]].
Full article
Focus on unemployment
Focus on underemployed part-time workers
More underemployed part-time workers in Spain and Greece, few in Czechia, Hungary and Bulgaria
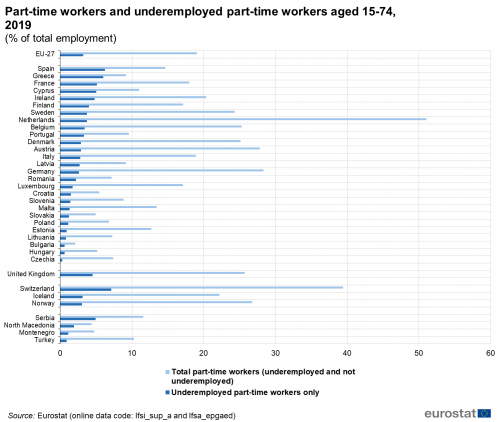
Figure 2 shows the share of employed persons in each country that were part-time workers in 2019 as well as the share of employed people who were underemployed part-time workers. At European level, 3.2 % of the total employment consisted of underemployed people. Underemployment in the EU-27 was highest in Spain (6.2 % of total working persons), followed by Greece (6.0 %), France (5.1 %) and Cyprus (5.0 %), in comparison with Czechia (0.3 %), Hungary and Bulgaria (both 0.6 %) where underemployment is almost non-existent. Even though there is no striking pattern, the lowest occurrences of underemployed part-time workers tend to be in the eastern part of the EU. Outside the EU, the EFTA country Switzerland recorded a higher underemployment rate, reaching 7.1 % in 2019.
(% of total employment)
Source: Eurostat (lfsa_sup_a) and (lfsa_epgaed)
Figure 2 shows also the percentage of part-time workers regardless the underemployment in each country in 2019. Part-time work may be considered as a risk of being in a job with too few working hours, and therefore underemployment might be somehow an accompanying feature of part-time employment, i.e. high shares of part-time workers may imply high shares of underemployed workers. However, Figure 2 suggests that it is not the case for all countries.
For example, in the European Union, total employment consisted of 19.0 % of part-time workers. In the Netherlands, it consisted of 51.0 % of part-time workers, of which 7.3 % were underemployed (relatively low compared to 16.9 % for the EU). This means that although part-time work was frequently applied in this country, a high share of part-time workers was satisfied with their situation (and not wishing to work more). In Romania, for example, it was the opposite. Part-time employment in Romania accounted for 7.1 % of the total employment but among the part-time workers, almost one third (i.e. 31.2 %) were underemployed. Among others, Italy is quite close to the average in terms of part-time employment (18.9 %) and also of underemployed people among part-time workers (15.0 %).
Moreover, regardless of the recourse to part-time employment at national level, some countries recorded high shares of underemployed part-time workers among the total part-time workers. This was the situation in 2019 in Greece (65.4 %), Cyprus (45.7 %), Spain (42.6 %) and Portugal (34.4 %) where more than one third of part-time workers wished to work more hours, while, as previously mentioned, the EU-27 average was 16.9 %. At the opposite end of the scale, Czechia, in addition to a low share of part-time workers in the total employment (7.4 %), has also a low share of part-time workers (4.4 %) that were underemployed.
Focus on the potential additional labour force
Potential additional labour force stood for 7.2 % of people outside the labour force in the EU-27
As already mentioned, the potential additional labour force consists of two subgroups. One category includes people who are available to work but do not seek it. At European level, this category accounted for 5.6 % of the total people outside the labour force in 2019. The other category is related to persons who seek work but are not immediately available to start working; this last group stood for 1.6 % of the total population outside the labour force.
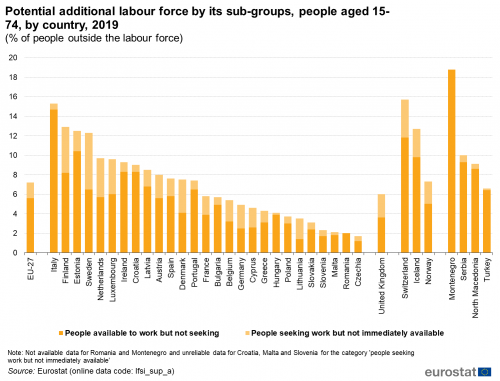
All countries apart from Lithuania follow the same main pattern clearly visible in Figure 3: people available but not seeking work outnumber those seeking work but not immediately available.
Figure 3 presents the size of each subgroup as a proportion of the population outside the labour force for every EU-27 country in 2019. Both together, these categories give the potential additional labour force as a percentage of the population outside the labour force. Italy (15.3 %), Finland (12.9 %), Estonia (12.5 %) and Sweden (12.3 %) recorded more than one out of ten persons outside the labour force in the potential additional labour force. In Czechia (1.7 %), Romania (2.0 %), Malta (2.1 %) and Slovenia (2.3 %), this is the opposite situation: these countries recorded the lowest shares of potential additional labour force compared to the population outside the labour force, each below 3 %.
Inside the potential additional labour force, there are also notable differences between countries. For instance, there were exceptionally few in the population outside the labour force who were available to work but not seeking a job in Czechia (1.2 %), Lithuania (1.4 %) and Slovenia (1.7 %), whereas these are relatively more numerous in Italy (14.7 %) and Estonia (10.4 %). Also the share of those who are seeking work but not immediately available varies greatly across countries: their proportion is relatively high in Sweden (5.8 %), Finland (4.7 %) and the Netherlands (4.0 %), while they are almost non-existent in Hungary, Malta and Czechia (all three reaching 0.5 % or less).
(% of people outside the labour force)
Source: Eurostat (lfsi_sup_a)
Labour market slack in the EU-27
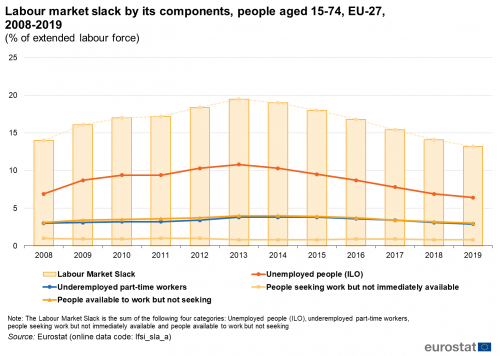
Labour market slack refers to all unmet needs for employment, including unemployment according to the ILO definition as well as the three supplementary indicators described in this article. In order to allow comparisons between these four groups, which do not all belong to the labour force, the concept of the “extended labour force” is used. It includes people in the labour force (unemployment and employment) and in the potential additional labour force (two categories outside the labour force), i.e. those available but not seeking, and those seeking but not available. The total labour market slack is expressed in percent of this extended labour force, and the relative size of each component of the labour market slack can be compared by using the extended labour force as denominator.
At European level, the development of the labour market slack seems to follow and emphasize the development of the unemployment (according to ILO) which is one of its components (see Figure 6). The unemployment fluctuations are however more pronounced than the variations of the other three components, more stable overtime but still connected to the economic situation. The labour market slack accounted for 14.0 % of the extended labour force in 2008 and for 13.2 % in 2019, with the highest value found in 2013 i.e. 19.5 %. Based on the annual data, the unemployment (ILO) in 2019 stood for 6.4 % of the extended labour force in the EU-27, about half of the value of the labour market slack.
(% of extended labour force)
Source: Eurostat (lfsi_sla_a)
In 2019, the labour market slack was the highest in Greece (24.5 %), Spain (22.7 %), Italy (21.5 %), France (16.1 %) and Finland (15.8 %), all above 15 % of the extended labour force (see Figure 7). Once again, the link between having a high labour market slack and a high unemployment rate is partially verified as the highest unemployment rates in the EU-27 in percentage of the extended labour force are also found in Greece (16.8 %), Spain (13.6 %), Italy (9.0 %), France (8.2 %). Finland ranked 7th with an unemployment rate of 6.3 %.
However, the weight of unemployment in the total labour market slack varies from one country to another, leaving the other components (like the underemployed people, people available for work but not seeking it and those seeking work but not immediately available) relatively more substantial. In 2019, in the Netherlands, Ireland and Finland, unemployment consisted of less than 40 % of the total slack while the three supplementary indicators accounted for more than 60 %. Unemployment stood for 31.0 % of the total labour market slack in the Netherlands, 35.4 % in Ireland and 39.9 % in Finland. In the EU-27, almost half of the slack, 48.9 %, consisted of unemployed people. On the opposite end, in Lithuania, Greece and Slovakia, unemployment accounted for more than two thirds of the total labour market slack.
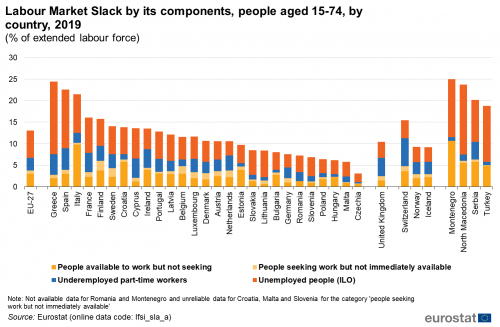
(% of extended labour force)
Source: Eurostat (lfsi_sla_a)
Source data for tables and graphs
Data sources
All figures in this article are based on the European labour force survey (EU-LFS).
Source: The European Union labour force survey (EU-LFS) is the largest European household sample survey providing quarterly and annual results on labour participation of people aged 15 and over as well as on persons outside the labour force. It covers residents in private households. Conscripts in military or community service are not included in the results. The EU-LFS is based on the same target populations and uses the same definitions in all countries, which means that the results are comparable between countries.
Reference period: Yearly results are obtained as averages of the four quarters in the year.
Coverage: The results from the survey currently cover all European Union Member States, the United Kingdom, the EFTA Member States of Iceland, Norway, Switzerland, as well as the candidate countries Montenegro, North Macedonia, Serbia and Turkey. For Cyprus, the survey covers only the areas of Cyprus controlled by the Government of the Republic of Cyprus.
European aggregates: EU refers to the sum of EU-27 Member States. If data are unavailable for a country, the calculation of the corresponding aggregates takes into account the data for the same country for the most recent period available. Such cases are indicated.
Definitions: The concepts and definitions used in the labour force survey follow the guidelines of the International Labour Organisation.
Five different articles on detailed technical and methodological information are linked from the overview page of the online publication EU labour force survey.
Context
These three indicators supplement the unemployment rate, thus providing an enhanced and richer picture than the traditional labour status framework, which classifies people as employed, unemployed or outside the labour force, i.e. in only three categories. The indicators create ‘halos’ around unemployment. This concept is further analysed in a Statistics in Focus publication titled 'New measures of labour market attachment', which also explains the rationale of the indicators and provides additional insight as to how they should be interpreted. The supplementary indicators neither alter nor put in question the unemployment statistics standards used by Eurostat. Eurostat publishes unemployment statistics according to the ILO definition, the same definition as used by statistical offices all around the world. Eurostat continues publishing unemployment statistics using the ILO definition and they remain the benchmark and headline indicators.
Direct access to
- New measures of labour market attachment - Statistics in focus 57/2011
- LFS main indicators (lfsi)
- Unemployment - LFS adjusted series (une)
- Supplementary indicators to unemployment - annual data (lfsi_sup_a)
- Supplementary indicators to unemployment - quarterly data (lfsi_sup_q)
- Unemployment - LFS adjusted series (une)
- LFS series - Detailed annual survey results (lfsa)
- Total unemployment - LFS series (lfsa_unemp)
- Supplementary indicators to unemployment by sex and age (lfsa_sup_age)
- Supplementary indicators to unemployment by sex and educational attainment level (lfsa_sup_edu)
- Supplementary indicators to unemployment by sex and citizenship (lfsa_sup_nat)
- Total unemployment - LFS series (lfsa_unemp)
- LFS series - Detailed quarterly survey results (lfsq)
- Total unemployment - LFS series (lfsq_unemp)
- Supplementary indicators to unemployment by sex and age (lfsq_sup_age)
- Supplementary indicators to unemployment by sex and educational attainment level (lfsq_sup_edu)
- Total unemployment - LFS series (lfsq_unemp)
<Interactive graph to be set by unit B4:>
or
or
Introduction text
</highlight>
Direct access to
Main tables
- Title(s) of second level folder (if any)
- Title(s) of third level folder (if any)
Database
- Title(s) of second level folder (if any)
- Title(s) of third level folder (if any)
Dedicated section
Publications
Publications in Statistics Explained (either online publications or Statistical articles) should be in 'See also' above
Methodology
<link to ESMS file, methodological publications, survey manuals, etc.>
- Crime and criminal justice (ESMS metadata file — crim_esms)
- Title of the publication
Legislation
- Use Eur-Lex icon on the ribbon tool at the top of the statistical article to enter the year and reference of your regulation or directive.
- See example of what should be issued hereafter
- Regulation (EU) No 1013/2016
Visualisations
- Regional Statistics Illustrated - select statistical domain 'xxx' (= Agriculture, Economy, Education, Health, Information society, Labour market, Population, Science and technology, Tourism or Transport) (top right)
External links
Notes
<footnote text will be automatically inserted if reference tags are used in article content text (use reference icon on ribbon)>
[[Category:<Subtheme category name(s)>|Name of the statistical article]] [[Category:<Statistical article>|Name of the statistical article]]
Delete [[Category:Model|]] below (and this line as well) before saving!
